

Category: Forex News, News
Euro Japanese yen Forecast: Latest PMI & CPI release
Euro–Japanese yen (EUR/JPY) is quoted around 182.569 as of 11:12am (UTC) on 20 February 2026, trading within an intraday range of 182.082–183.039. The cross is holding close to the European Central Bank’s latest euro reference rate for the yen, which stood near 182.05 JPY per EUR on 19 February 2026. Past performance is not a reliable indicator of future results.
The latest flash Eurozone composite PMI for February printed above both forecasts and the prior reading (Reuters, 20 February 2026), while Japan’s national CPI has eased to its slowest pace since early 2022 (MarketScreener, 20 February 2026). This combination has prompted some market participants to reassess the timing and extent of potential BoJ tightening, contributing to a softer yen tone.

EUR/JPY forecast 2026–2030: Analyst price target view
As of 20 February 2026, third-party euro Japanese yen predictions outline a mix of bullish and corrective technical scenarios, with levels clustered around recent trading near 182–185 and mapped against Fibonacci retracements, moving averages, and prior highs. Across these notes, analysts frame targets as conditional paths rather than firm projections, linking them to incoming Eurozone data, Japanese inflation, and the timing of potential Bank of Japan rate moves.
ING Think (quarterly projections)
ING Think sets forecasts for EUR/JPY at 184 in Q1 and Q2 2026, edging to 185 in Q3 and Q4 2026, before moderating to 177 in 2027. This profile implies a relatively stable trajectory through 2026, followed by a projected pullback the following year, based on ING’s macro assumptions for Japan and the broader G10 currency complex. As with other institutional forecasts, these figures reflect scenario-based modelling and remain sensitive to changes in interest-rate differentials, inflation trends, and global risk conditions (ING Think, 20 February 2026).
DailyForex (trend and levels)
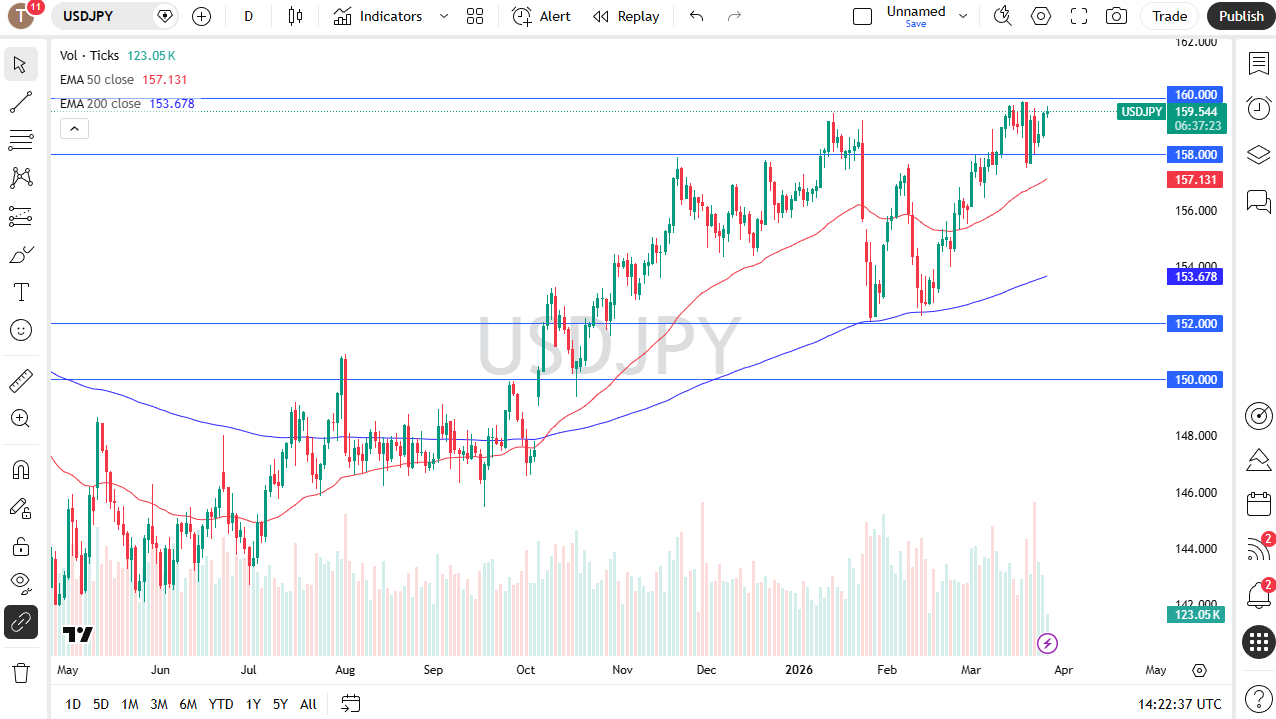
DailyForex notes that EUR/JPY is ‘hanging around the 185 yen level’, describing the market as trading within a broader uptrend and holding above its 50-day EMA, with pullbacks characterised as temporary retracements within that structure. The analysis references interest-rate differentials that favour the euro over the yen and identifies potential support zones around 182 and 180. It also highlights the upcoming European Central Bank rate decision as a potential catalyst for volatility, noting that policy surprises could either disrupt the prevailing trend or reinforce it, depending on the outcome (DailyForex, 5 February 2026).
Economies.com (intraday bullish scenario)
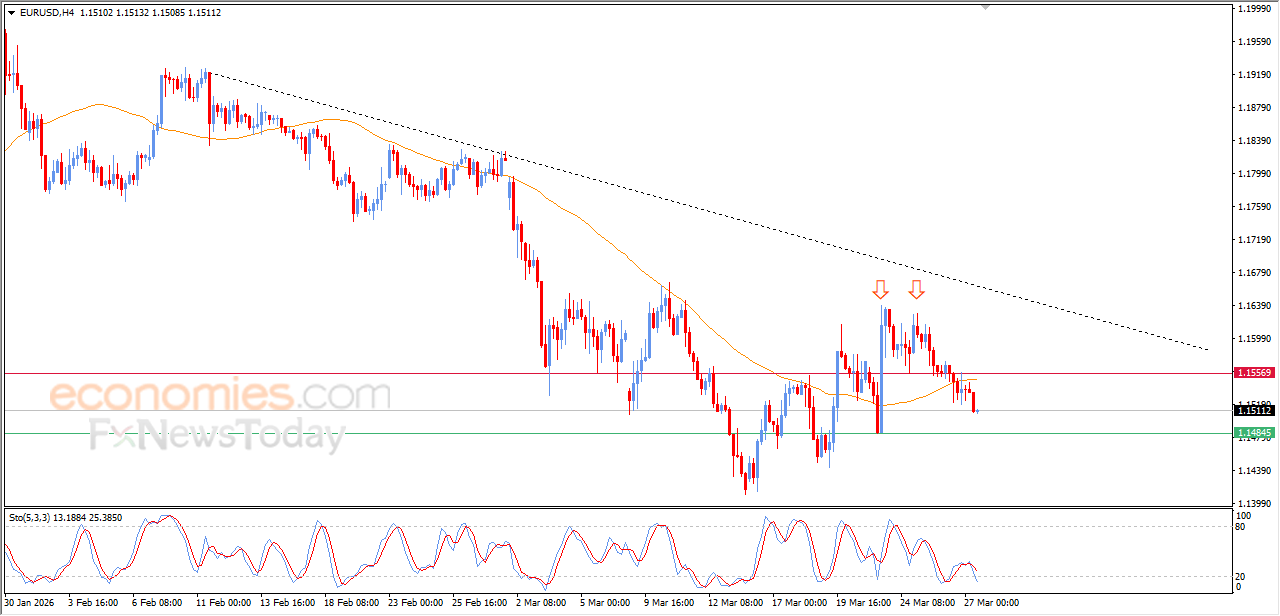
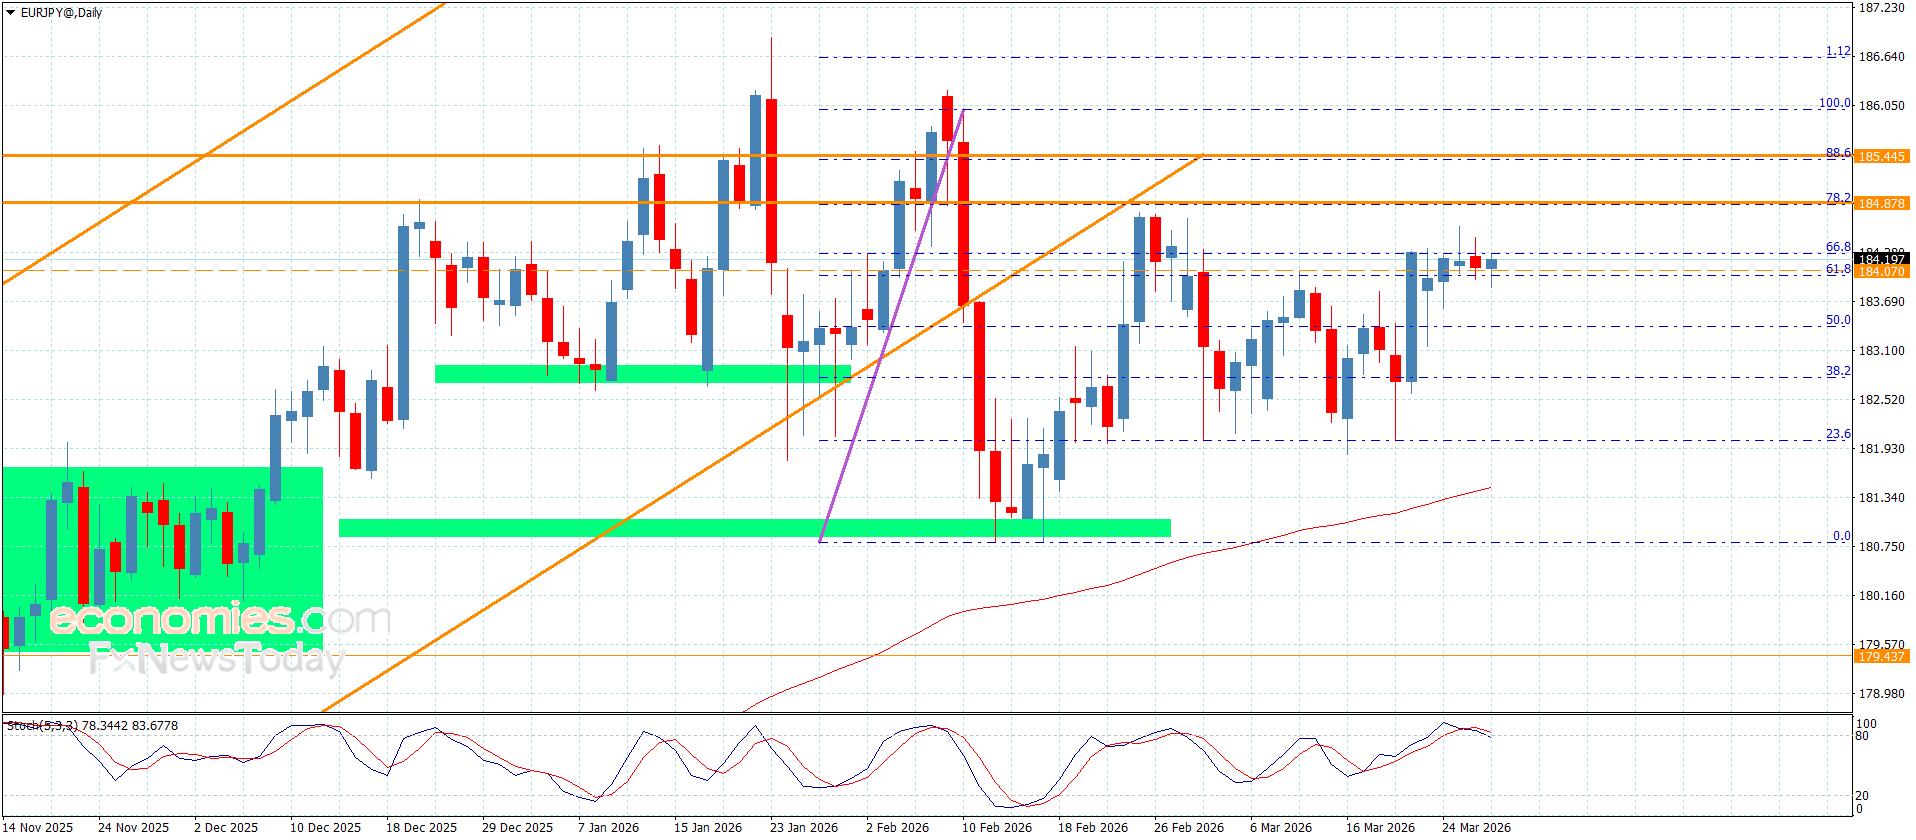
Economies.com states that EUR/JPY ‘keeps the positivity’, after reaching 183.15 and consolidating near 182.35. The bullish scenario is described as valid while support at 180.80 holds. The analysis references continued positive signals from technical indicators and suggests that maintaining trade above 180.80 could open the way towards 183.40 and the 61.8% Fibonacci correction level at 184.05, while noting that broader sentiment conditions remain relevant (Economies.com, 20 February 2026).
Takeaway: These third-party outlooks indicate a range of potential scenarios. Analysts stress that outcomes remain contingent on BoJ policy signals, Eurozone data, and shifts in global risk appetite.
Predictions and third-party forecasts are inherently uncertain, as they cannot fully account for unexpected market developments. Past performance is not a reliable indicator of future results.
Euro–Turkish lira: Technical overview
One the daily chart, EUR/JPY trades around 182.569 as of 11:12am (UTC) on 20 February 2026, with price oscillating just below a broad moving-average band defined by the 20-, 50-, 100- and 200-day SMAs at roughly 183, 184, 181 and 176. The same-period EMAs cluster nearby, with the 100-day EMA near 180.7 and the 200-day EMA around 176.5. This configuration leaves the longer-term trend structure intact, even as shorter-dated averages lean softer.
The 14-day RSI sits near 46, in neutral territory, while an ADX reading around 20 indicates a modest, non-directional trend backdrop rather than a strong impulse in either direction.
On the topside, the nearest classic pivot resistance stands at R1 around 186.3; a daily close above this level would place R2 near 189.1 into focus as the next reference area. On the downside, the classic pivot at 184.0 remains an overhead marker, while the 100-day SMA near 181.0 forms an initial moving-average shelf. A sustained move below this zone could expose S1 near 181.2 if selling pressure builds (TradingView, 20 February 2026).
This technical analysis is provided for informational purposes only and does not constitute financial advice or a recommendation to buy or sell any instrument.
EUR/JPY history (2024–2026)
Over the two years to 20 February 2026, EUR/JPY has trended higher from the mid-150s to the low-180s, advancing in stages rather than in a straight line. The pair spent much of early 2024 consolidating around 160–165, then moved into the high-160s and low-170s through mid-2024 before pushing above 170 during the summer and closing 2024 near 163–165.
By mid-2025, EUR/JPY was trading around 165–170. A subsequent leg higher produced prices in the high-160s to low-170s during the second half of the year, before the pair finished near 184.
So far in 2026, daily prices have mostly remained within a relatively tight 181–186 band. EUR/JPY traded around 182.58 on 20 February 2026 after briefly moving above 186 earlier in the month. Overall, the cross stands noticeably higher than it did two years ago, while still exhibiting short-term volatility within broader ranges.


Written by : Editorial team of BIPNs
Main team of content of bipns.com. Any type of content should be approved by us.


Share this article: