The main category of Forex News.
You can use the search box below to find what you need.
[wd_asp id=1]
The main category of Forex News.
You can use the search box below to find what you need.
[wd_asp id=1]
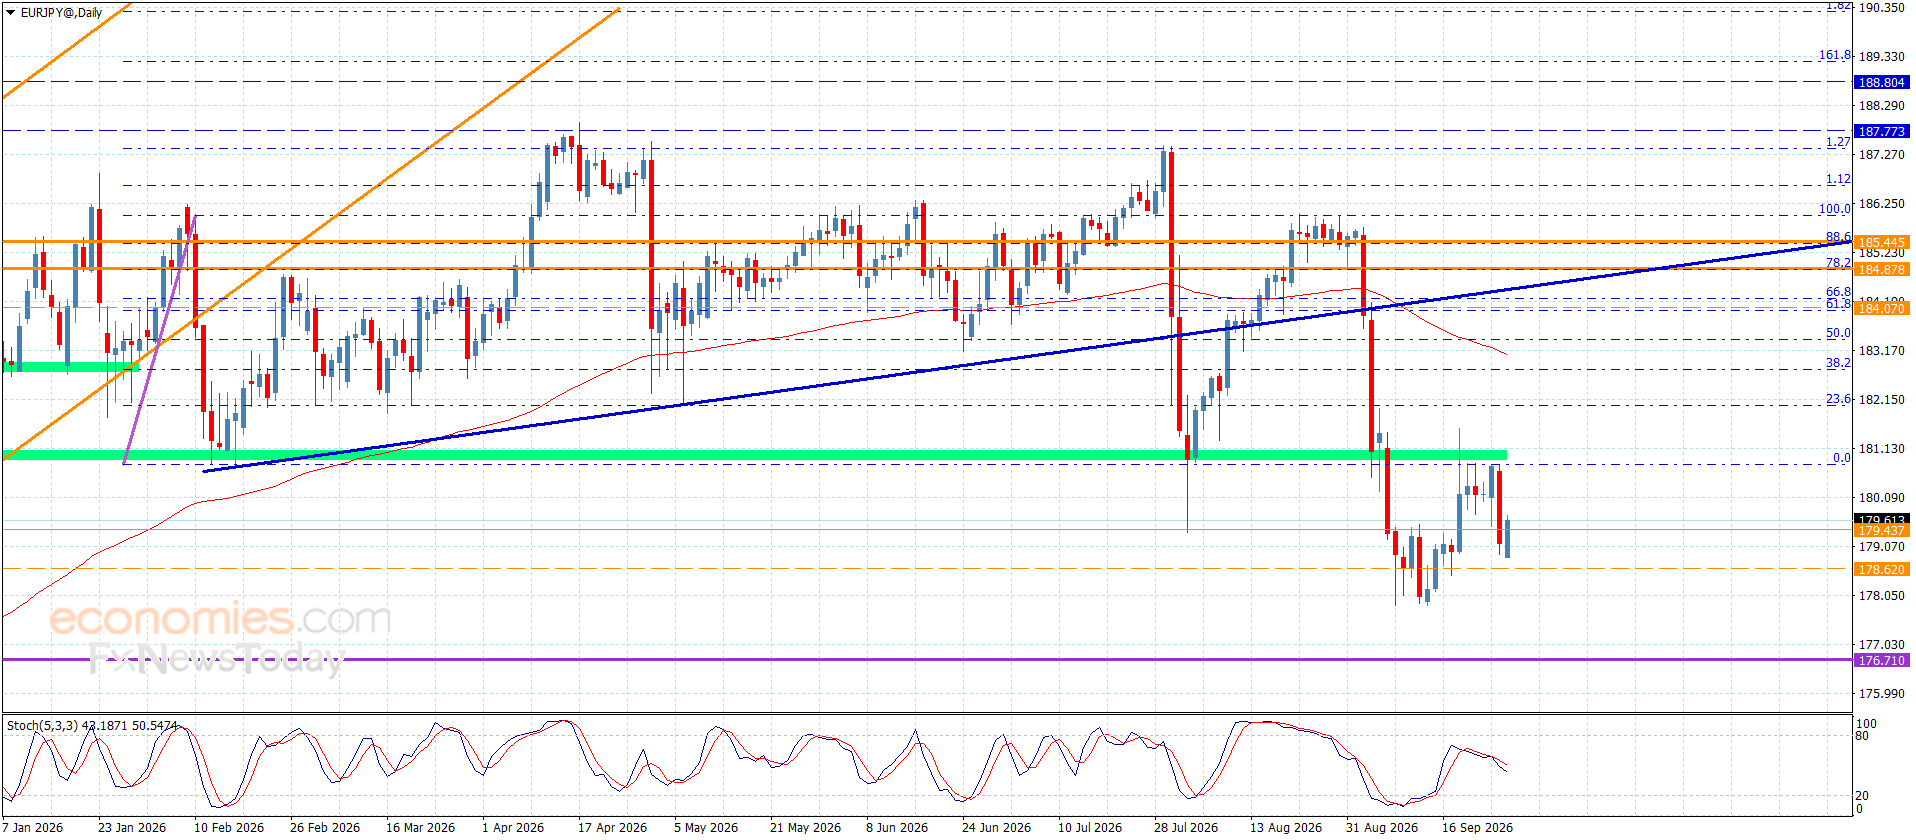
The EURJPY pair confirmed delaying the negative attempts, with the positive momentum that comes from the main indicators, to attempt to record some gains by reaching 185.35.
Note that the continuation of facing positive pressures, by the attempt of forming an initial support at 184.20 level, which might help it to reinforce the chances of recording extra gains by targeting 185.85 level, while the return of the fluctuation below 184.20 will reinforce the chances of forming new bearish trading, to expect reaching 183.50 level initially, attempting to reach the next support at 182.90.
The expected trading range for today is between 184.40 and 185.80
Trend forecast: Bullish
Domestic coffee prices today
Coffee prices today in key production areas simultaneously decreased. The average price was recorded at 89,200 VND/kg, down 600 VND/kg compared to the previous update.
In Dak Lak, coffee prices decreased by 600 VND/kg, down to 89,200 VND/kg. Gia Lai also recorded a similar decrease, bringing the purchase price back to 89,200 VND/kg.
In Lam Dong, coffee prices today decreased by 600 VND/kg, down to 88,800 VND/kg and continue to be the lowest level among the surveyed areas.
The old Dak Nong area had the highest purchase price, reaching 89,300 VND/kg, but decreased more sharply than the remaining areas, with a decrease of 700 VND/kg.
Thus, domestic coffee prices currently range from 88,800-89,300 VND/kg. The gap between the region with the highest and lowest prices is 500 VND/kg.
The USD/VND exchange rate according to Vietcombank was recorded at 26,076 VND/USD, down 15 VND.
World coffee prices
World coffee prices fluctuated in opposite directions in the most recent trading session. Arabica on the New York exchange increased, while Robusta on the London exchange simultaneously decreased for all terms.
On the London exchange, the September 2026 Robusta futures contract fell 63 USD/ton, equivalent to 1.74%, to 3,564 USD/ton.
Robusta futures in November 2026 decreased by 60 USD/ton, equivalent to 1.68%, to 3,510 USD/ton. The January 2027 term decreased by 54 USD/ton, to 3,467 USD/ton.
Robusta futures for March 2027 decreased by 51 USD/ton, equivalent to 1.47%, to 3,429 USD/ton.
The July 2026 contract was recorded at 3,761/ton, down 56 USD/ton. However, the trading volume of this term is only 2 lots because the contract has approached maturity, so it does not fully reflect the general diễn biến of the market.
On the New York floor, Arabica futures in September 2026 increased by 4.60 US cents/lb, equivalent to 1.68%, to 277.80 US cents/lb.
Arabica futures in December 2026 increased by 2.50 US cents/lb, reaching 263.40 US cents/lb. March 2027 futures increased by 2.10 US cents/lb, to 258.70 US cents/lb.
May 2027 futures increased by 1.90 US cents/lb, equivalent to 0.74%, reaching 258.90 US cents/lb.
Coffee price assessment
According to financial data firm Barchart, Arabica prices rose sharply as heavy rains in Brazil continued to slow harvest progress.
Meteorological company Somar Meteorologia said that Minas Gerais state, Brazil’s largest coffee producing region, recorded 31.3 mm of rainfall in the week ending June 28. This level is equivalent to 1.956% of the historical average of the same period.
Heavy rain in the middle of harvest season can hinder coffee harvesting, transportation and drying. Coffee beans exposed to prolonged humidity also face the risk of declining quality, thereby creating support for Arabica prices.
In addition to weather factors, standard Arabica inventories on the US Intercontinental Exchange continued to decrease. Arabica inventories fell to 380,534 bags, the lowest in about 2 years and 3 months.
The decrease in available Arabica supply on the exchange made the market more sensitive to unfavorable information about the Brazilian harvest. This is one of the reasons why Arabica maintained its upward momentum even though Robusta turned down.
In the opposite direction, Robusta is under pressure as inventory on the European Intercontinental Exchange increased to 4,053 lots, the highest level in about 2 months and 3 weeks.
Previously, Robusta inventory had decreased to 3,631 lots on May 15, the lowest level in 2 years. The addition of standard goods somewhat reduced concerns about short-term supply shortages.
Robusta supply from Vietnam is also trending upwards. The Foreign Agricultural Services Agency of the US Department of Agriculture forecasts that Vietnam’s coffee production in the 2026-2027 crop year will reach 32.5 million bags, an increase thanks to production expansion after a period of high coffee prices.
Year-end weather risks are still a factor being monitored by businesses. The US National Oceanic and Atmospheric Administration assesses that there is a 63% chance that El Niño will reach very strong intensity in the period from November 2026 to January 2027.
El Niño may change the rainfall pattern in Brazil during the coffee tree flowering period in September and October, and also affect production conditions in Robusta growing areas in Asia. However, the level of impact depends on the actual developments in each region.
In terms of pressure, the Foreign Agricultural Services Agency of the US Department of Agriculture forecasts that Brazil may produce 66.7 million bags of coffee in the 2026-2027 crop year. The Dutch bank Rabobank also forecasts that the global Arabica market will continue to have a surplus.
In general, Arabica prices are being supported by heavy rain in Brazil and standard inventories are falling sharply. Meanwhile, Robusta is under pressure from recovery inventories and the prospect of increased Vietnamese supply.
The EURJPY pair confirmed delaying the negative attempts, with the positive momentum that comes from the main indicators, to attempt to record some gains by reaching 185.35.
Note that the continuation of facing positive pressures, by the attempt of forming an initial support at 184.20 level, which might help it to reinforce the chances of recording extra gains by targeting 185.85 level, while the return of the fluctuation below 184.20 will reinforce the chances of forming new bearish trading, to expect reaching 183.50 level initially, attempting to reach the next support at 182.90.
The expected trading range for today is between 184.40 and 185.80
Trend forecast: Bullish
Copper price is affected by the positivity of the main indicators since yesterday, specifically by forming extra support by the moving average 55 at $5.9500, which obstructs the bearish corrective attempts, forming new sideways fluctuations by its stability near $6.1000.
The sideways fluctuations remains the dominance in today’s trading until gathering the negative momentum, confirming the importance of its stability at $6.3000 level, to motivate forming bearish waves to target $5.8200 and $5.7100.
The expected trading range for today is between $5.9500 and $6.2000
Trend forecast: Fluctuating
The GBP/USD pair attracts some sellers during the Asians session on Tuesday and reverses a part of the previous day’s strong move up to a one-week top. Spot prices, for now, seem to have snapped a three-day winning streak and currently trade around the 1.3235-1.3230 region, down nearly 0.20% for the day.
The US Dollar (USD) regains some positive traction amid mixed signals on US-Iran talks and firming expectations that the US Federal Reserve (Fed) will hike interest rates in 2026. Furthermore, the UK political uncertainty ahead of a leadership contest is seen as undermining the British Pound (GBP) and exerting some downward pressure on the GBP/USD pair.
From a technical perspective, the recent repeated failures near the 200-period Simple Moving Average (SMA) on the 4-hour chart favor bearish traders. Moreover, spot prices retain a negative bias below the 1.3300 mark, though momentum indicators suggest that upside attempts could persist while the broader structure is still constrained by the overhead supply zone.
In fact, the Relative Strength Index (RSI) hovers near 54 while the Moving Average Convergence Divergence (MACD) histogram remains modestly positive. Hence, any further decline is more likely to find a decent support near the 1.3200 mark, below which the GBP/USD pair could aim to retest the year-to-date low, around the 1.3140 region, and decline further.
On the topside, initial resistance is located near the 1.3300 round figure, which is followed by the 200-period SMA at 1.3366. A sustained strength above this barrier would start to ease the broader bearish bias and open the way for a more convincing recovery phase, though a failure would leave the GBP/USD pair vulnerable to resume its downtrend.
(The technical analysis of this story was written with the help of an AI tool.)
The table below shows the percentage change of US Dollar (USD) against listed major currencies today. US Dollar was the strongest against the Euro.
| USD | EUR | GBP | JPY | CAD | AUD | NZD | CHF | |
|---|---|---|---|---|---|---|---|---|
| USD | 0.28% | 0.19% | 0.16% | 0.16% | 0.21% | -0.02% | 0.24% | |
| EUR | -0.28% | -0.09% | -0.15% | -0.16% | -0.08% | -0.31% | -0.05% | |
| GBP | -0.19% | 0.09% | -0.04% | -0.08% | 0.02% | -0.21% | 0.03% | |
| JPY | -0.16% | 0.15% | 0.04% | 0.00% | 0.05% | -0.16% | 0.07% | |
| CAD | -0.16% | 0.16% | 0.08% | -0.00% | 0.03% | -0.17% | 0.08% | |
| AUD | -0.21% | 0.08% | -0.02% | -0.05% | -0.03% | -0.20% | 0.07% | |
| NZD | 0.02% | 0.31% | 0.21% | 0.16% | 0.17% | 0.20% | 0.23% | |
| CHF | -0.24% | 0.05% | -0.03% | -0.07% | -0.08% | -0.07% | -0.23% |
The heat map shows percentage changes of major currencies against each other. The base currency is picked from the left column, while the quote currency is picked from the top row. For example, if you pick the US Dollar from the left column and move along the horizontal line to the Japanese Yen, the percentage change displayed in the box will represent USD (base)/JPY (quote).
The EURJPY pair confirmed delaying the negative attempts, with the positive momentum that comes from the main indicators, to attempt to record some gains by reaching 185.35.
Note that the continuation of facing positive pressures, by the attempt of forming an initial support at 184.20 level, which might help it to reinforce the chances of recording extra gains by targeting 185.85 level, while the return of the fluctuation below 184.20 will reinforce the chances of forming new bearish trading, to expect reaching 183.50 level initially, attempting to reach the next support at 182.90.
The expected trading range for today is between 184.40 and 185.80
Trend forecast: Bullish
The USD/JPY pair trades 0.16% higher to near 162.25 during the European trading session on Tuesday, the highest level seen in over four decades. The pair trades firmly as the US Dollar (USD) outperforms ahead of the United States (US) Nonfarm Payrolls (NFP) data for June, which will be released on Thursday.
At press time, the US Dollar Index (DXY), which gauges the Greenback’s value against six major currencies, trades 0.2% higher to near 101.36.
The table below shows the percentage change of US Dollar (USD) against listed major currencies today. US Dollar was the strongest against the Euro.
| USD | EUR | GBP | JPY | CAD | AUD | NZD | CHF | |
|---|---|---|---|---|---|---|---|---|
| USD | 0.27% | 0.20% | 0.19% | 0.16% | 0.19% | 0.02% | 0.27% | |
| EUR | -0.27% | -0.07% | -0.11% | -0.16% | -0.09% | -0.27% | -0.02% | |
| GBP | -0.20% | 0.07% | -0.02% | -0.08% | -0.01% | -0.19% | 0.05% | |
| JPY | -0.19% | 0.11% | 0.02% | -0.03% | -0.01% | -0.15% | 0.07% | |
| CAD | -0.16% | 0.16% | 0.08% | 0.03% | 0.02% | -0.12% | 0.11% | |
| AUD | -0.19% | 0.09% | 0.01% | 0.00% | -0.02% | -0.14% | 0.09% | |
| NZD | -0.02% | 0.27% | 0.19% | 0.15% | 0.12% | 0.14% | 0.22% | |
| CHF | -0.27% | 0.02% | -0.05% | -0.07% | -0.11% | -0.09% | -0.22% |
The heat map shows percentage changes of major currencies against each other. The base currency is picked from the left column, while the quote currency is picked from the top row. For example, if you pick the US Dollar from the left column and move along the horizontal line to the Japanese Yen, the percentage change displayed in the box will represent USD (base)/JPY (quote).
Investors will pay close attention to the US official employment data to get fresh cues regarding the Federal Reserve’s (Fed) monetary policy outlook.
Currently, the CME FedWatch tool shows that traders see an almost 80% chance that the central bank will deliver at least one interest rate hike this year.
On the Tokyo front, Japan officials have warned of intervention to support the Japanese Yen (JPY). Earlier in the day, Japan’s Finance Minister (FM) Satsuki Katayama said that her government “will respond appropriately to currency moves at any time as needed”. However, Katayama declined to comment on specific FX levels.
USD/JPY trades higher at around 162.25. The pair holds a bullish near-term bias as it extends above the 10-week exponential moving average (EMA) at 160.32, keeping the broader uptrend intact.
The Relative Strength Index (RSI) at 65.72 stays in positive territory but shy of overbought, suggesting persistent upside pressure with only moderate risk of a momentum correction.
On the downside, immediate support emerges at the June 223 high at 161.93, followed by the 10-week EMA near 160.32. Looking up, the apir could extend its advance towards 163.00 and 164.00.
(The technical analysis of this story was written with the help of an AI tool.)
(This story was corrected at 06:25 GMT to say in the first paragraph that The USD/JPY pair trades 0.16% higher to near 162.25 during the European trading session on Tuesday, the highest level seen in over four decades and not the lowest level.)
The US Dollar (USD) is the official currency of the United States of America, and the ‘de facto’ currency of a significant number of other countries where it is found in circulation alongside local notes. It is the most heavily traded currency in the world, accounting for over 88% of all global foreign exchange turnover, or an average of $6.6 trillion in transactions per day, according to data from 2022.
Following the second world war, the USD took over from the British Pound as the world’s reserve currency. For most of its history, the US Dollar was backed by Gold, until the Bretton Woods Agreement in 1971 when the Gold Standard went away.
The most important single factor impacting on the value of the US Dollar is monetary policy, which is shaped by the Federal Reserve (Fed). The Fed has two mandates: to achieve price stability (control inflation) and foster full employment. Its primary tool to achieve these two goals is by adjusting interest rates.
When prices are rising too quickly and inflation is above the Fed’s 2% target, the Fed will raise rates, which helps the USD value. When inflation falls below 2% or the Unemployment Rate is too high, the Fed may lower interest rates, which weighs on the Greenback.
In extreme situations, the Federal Reserve can also print more Dollars and enact quantitative easing (QE). QE is the process by which the Fed substantially increases the flow of credit in a stuck financial system.
It is a non-standard policy measure used when credit has dried up because banks will not lend to each other (out of the fear of counterparty default). It is a last resort when simply lowering interest rates is unlikely to achieve the necessary result. It was the Fed’s weapon of choice to combat the credit crunch that occurred during the Great Financial Crisis in 2008. It involves the Fed printing more Dollars and using them to buy US government bonds predominantly from financial institutions. QE usually leads to a weaker US Dollar.
Quantitative tightening (QT) is the reverse process whereby the Federal Reserve stops buying bonds from financial institutions and does not reinvest the principal from the bonds it holds maturing in new purchases. It is usually positive for the US Dollar.
Copper price is affected by the positivity of the main indicators since yesterday, specifically by forming extra support by the moving average 55 at $5.9500, which obstructs the bearish corrective attempts, forming new sideways fluctuations by its stability near $6.1000.
The sideways fluctuations remains the dominance in today’s trading until gathering the negative momentum, confirming the importance of its stability at $6.3000 level, to motivate forming bearish waves to target $5.8200 and $5.7100.
The expected trading range for today is between $5.9500 and $6.2000
Trend forecast: Fluctuating
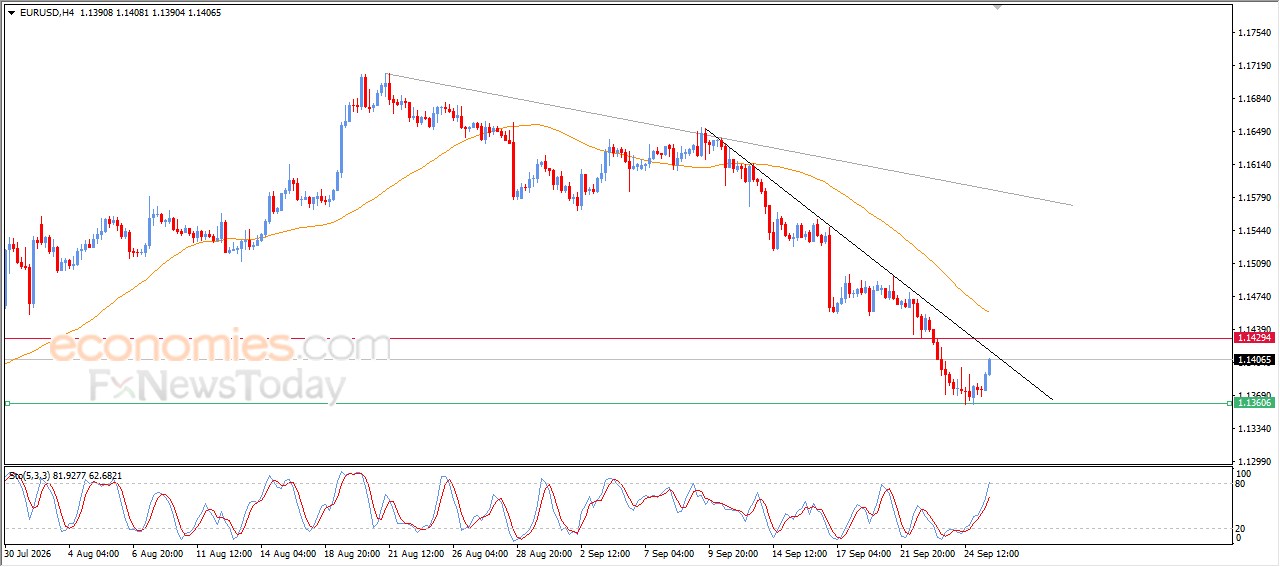
The Euro to Dollar (EUR/USD) exchange rate has stabilised near 1.1410 after suffering a sharp sell-off during June as stronger US economic data and geopolitical tensions boosted demand for the Dollar.
Berenberg believes the Euro may continue to struggle in the short term, but expects a more supportive backdrop to emerge as economic growth on both sides of the Atlantic begins to converge.
The bank argues that the single currency “lost twice” against the Dollar this year. Not only did the Iran conflict and higher energy prices weaken the Eurozone economy, but the US economy simultaneously received a boost from the AI investment boom and stronger-than-expected economic data.
According to Berenberg, this combination of weaker European growth and stronger US momentum created a powerful tailwind for the Dollar.
Earlier in the year, the Euro had benefited from improving Eurozone data and strong international investment flows into European equity and bond markets, briefly pushing EUR/USD above 1.20 for the first time since 2021.
However, Berenberg believes the medium-term outlook is more balanced. The bank expects growth differentials between the US and Eurozone to narrow as the boost from Germany’s fiscal stimulus gathers pace.
While the bank cautions that “the currency is likely to continue to struggle in the short term”, it believes improving Eurozone growth prospects should provide support for EUR/USD over the medium term as the current divergence in economic momentum begins to fade.
The Pound Sterling advances against the Japanese Yen on Monday, up 0.59% amid fears for a possible intervention by Japanese authorities in the foreign exchange markets. At the time of writing, the GBP/JPY trades at 214.78, bouncing off daily lows of 213.41.
The cross-pair consolidates near the year highs, forming an ‘ascending triangle’, which could open the door for further upside. The GBP/JPY has reclaimed the 50-day Simple Moving Average (SMA) at 214.06, which has exacerbated the rally towards the current spot price of 215.00.
Momentum, as measured by the Relative Strength Index (RSI), turned bullish exponentially, clearing the 50-neutral level and heading toward the 55.00 mark. The path of least resistance is tilted to the upside, if not for the potential intervention.
The first resistance for GBP/JPY would be 215.00. A breach of the latter will expose the 215.40-215.50 area ahead of 216.00. Above this area, the next resistance is the year-to-date (YTD) high at 216.60.
Downwards, the first support is the 50-day SMA at 214.06. If breached, the next support would be the 213.00 mark ahead of the 100-day SMA at 212.83.
The table below shows the percentage change of Japanese Yen (JPY) against listed major currencies today. Japanese Yen was the strongest against the Canadian Dollar.
| USD | EUR | GBP | JPY | CAD | AUD | NZD | CHF | |
|---|---|---|---|---|---|---|---|---|
| USD | -0.33% | -0.41% | 0.10% | 0.11% | 0.11% | -0.27% | -0.31% | |
| EUR | 0.33% | -0.11% | 0.46% | 0.46% | 0.47% | 0.10% | 0.05% | |
| GBP | 0.41% | 0.11% | 0.51% | 0.52% | 0.52% | 0.15% | 0.19% | |
| JPY | -0.10% | -0.46% | -0.51% | 0.00% | -0.00% | -0.32% | -0.41% | |
| CAD | -0.11% | -0.46% | -0.52% | -0.01% | 0.00% | -0.32% | -0.44% | |
| AUD | -0.11% | -0.47% | -0.52% | 0.00% | -0.00% | -0.37% | -0.34% | |
| NZD | 0.27% | -0.10% | -0.15% | 0.32% | 0.32% | 0.37% | -0.03% | |
| CHF | 0.31% | -0.05% | -0.19% | 0.41% | 0.44% | 0.34% | 0.03% |
The heat map shows percentage changes of major currencies against each other. The base currency is picked from the left column, while the quote currency is picked from the top row. For example, if you pick the Japanese Yen from the left column and move along the horizontal line to the US Dollar, the percentage change displayed in the box will represent JPY (base)/USD (quote).