The main category of Forex News.
You can use the search box below to find what you need.
[wd_asp id=1]
The main category of Forex News.
You can use the search box below to find what you need.
[wd_asp id=1]
Copper price began forming bullish waves yesterday, attempting to face the temporary negative pressure to reinforce the dominance of the main bullish scenario, to fluctuate near $5.0500 level now.
We expect to provide mixed trading, noting that the attempt to resume the bullish attack requires breaching the initial barrier near $5.2000, while the stability below it might force it to form corrective wave to reach towards the initial support at $4.7500.
The expected trading range for today is between $4.9500 and $5.2000
Trend forecast: Fluctuated
The GBPJPY pair provided mixed trading yesterday, affected by the contradiction between the main indicators, which might cause activating the bearish corrective track, so the stability below 206.90 forms main factor to confirm the negative suggestion in the near-term trading, therefore, we will keep waiting for its activation with stochastic negativity, to begin targeting corrective stations that might begin at 203.75.
Note that the price attempt to rally above 206.00 may delay the corrective trading in the current period, paving the way for retesting the mentioned barrier before reaching the suggested corrective targets.
The expected trading range for today is between 203.75 and 206.00
Trend forecast: Bearish
Silver (XAG/USD) rallies sharply during the North American session, edged up more than 2.50% after bouncing off daily lows of $49.73 and trades at $51.37 at the time of writing. Expectations that the Federal Reserve might ease policy in December push US Treasury yields lower, a tailwind for the non-yielding metal.
Silver’s uptrend in the short-term resumed, but traders need to clear key resistance at $52.46, November 13 high. A breach of the latter will expose the yearly high of 54.46 reached in mid-October, ahead of the $55.00 milestone.
Momentum as measured by the Relative Strength Index (RSI) is bullish, hence the path of least resistance is upwards.
Conversely, if XAG/USD tumbles below $51.00, look for a drop towards $50.00. Once cleared, the 20-day SMA is up next at $49.67, followed by the 50-day SMA at $48.45
Silver is a precious metal highly traded among investors. It has been historically used as a store of value and a medium of exchange. Although less popular than Gold, traders may turn to Silver to diversify their investment portfolio, for its intrinsic value or as a potential hedge during high-inflation periods. Investors can buy physical Silver, in coins or in bars, or trade it through vehicles such as Exchange Traded Funds, which track its price on international markets.
Silver prices can move due to a wide range of factors. Geopolitical instability or fears of a deep recession can make Silver price escalate due to its safe-haven status, although to a lesser extent than Gold’s. As a yieldless asset, Silver tends to rise with lower interest rates. Its moves also depend on how the US Dollar (USD) behaves as the asset is priced in dollars (XAG/USD). A strong Dollar tends to keep the price of Silver at bay, whereas a weaker Dollar is likely to propel prices up. Other factors such as investment demand, mining supply – Silver is much more abundant than Gold – and recycling rates can also affect prices.
Silver is widely used in industry, particularly in sectors such as electronics or solar energy, as it has one of the highest electric conductivity of all metals – more than Copper and Gold. A surge in demand can increase prices, while a decline tends to lower them. Dynamics in the US, Chinese and Indian economies can also contribute to price swings: for the US and particularly China, their big industrial sectors use Silver in various processes; in India, consumers’ demand for the precious metal for jewellery also plays a key role in setting prices.
Silver prices tend to follow Gold’s moves. When Gold prices rise, Silver typically follows suit, as their status as safe-haven assets is similar. The Gold/Silver ratio, which shows the number of ounces of Silver needed to equal the value of one ounce of Gold, may help to determine the relative valuation between both metals. Some investors may consider a high ratio as an indicator that Silver is undervalued, or Gold is overvalued. On the contrary, a low ratio might suggest that Gold is undervalued relative to Silver.
Gold price (XAU/USD) attracts some buyers to around $4,140 during the early Asian session on Tuesday. The precious metal rises on growing expectations of a US Federal Reserve (Fed) interest rate cut in the December policy meeting. Traders await the release of the US ADP Employment Change Weekly, Retail Sales, and Producer Price reports, which are due later on Tuesday.
Several Fed officials signalled support for a December rate reduction, which underpins the yellow metal. Fed Governor Christopher Waller said on Monday that available data showed the US job market remains weak enough to warrant another quarter-point rate cut at the Fed’s December policy meeting. Meanwhile, San Francisco Fed President Mary Daly stated that the US central bank should cut the rates as the labor market has become increasingly vulnerable.
“The market is increasingly getting convinced that the U.S. Federal Reserve is on track to cut interest rates in December,” said Bart Melek, head of commodity strategies at TD Securities. Lower interest rates could reduce the opportunity cost of holding Gold, supporting the non-yielding precious metal. Markets are now pricing in nearly an 80% chance of a Fed interest rate cut of a quarter-point next month, up from 30% odds before their remarks, according to the CME FedWatch tool.
Traders brace for fresh US economic data later on Tuesday for further clues on the monetary policy. The US Producer Price Index (PPI) is expected to show an increase of 0.3% MoM in September, while the Retail Sales are projected to show a rise of 0.4% MoM during the same period. If the reports show hotter-than-expected outcomes, this could lift the US Dollar (USD) and weigh on the USD-denominated commodity price.
Gold has played a key role in human’s history as it has been widely used as a store of value and medium of exchange. Currently, apart from its shine and usage for jewelry, the precious metal is widely seen as a safe-haven asset, meaning that it is considered a good investment during turbulent times. Gold is also widely seen as a hedge against inflation and against depreciating currencies as it doesn’t rely on any specific issuer or government.
Central banks are the biggest Gold holders. In their aim to support their currencies in turbulent times, central banks tend to diversify their reserves and buy Gold to improve the perceived strength of the economy and the currency. High Gold reserves can be a source of trust for a country’s solvency. Central banks added 1,136 tonnes of Gold worth around $70 billion to their reserves in 2022, according to data from the World Gold Council. This is the highest yearly purchase since records began. Central banks from emerging economies such as China, India and Turkey are quickly increasing their Gold reserves.
Gold has an inverse correlation with the US Dollar and US Treasuries, which are both major reserve and safe-haven assets. When the Dollar depreciates, Gold tends to rise, enabling investors and central banks to diversify their assets in turbulent times. Gold is also inversely correlated with risk assets. A rally in the stock market tends to weaken Gold price, while sell-offs in riskier markets tend to favor the precious metal.
The price can move due to a wide range of factors. Geopolitical instability or fears of a deep recession can quickly make Gold price escalate due to its safe-haven status. As a yield-less asset, Gold tends to rise with lower interest rates, while higher cost of money usually weighs down on the yellow metal. Still, most moves depend on how the US Dollar (USD) behaves as the asset is priced in dollars (XAU/USD). A strong Dollar tends to keep the price of Gold controlled, whereas a weaker Dollar is likely to push Gold prices up.
– Written by
Frank Davies
STORY LINK GBP/USD Forecast: Pound Sterling Steady as Markets Brace for UK Budget
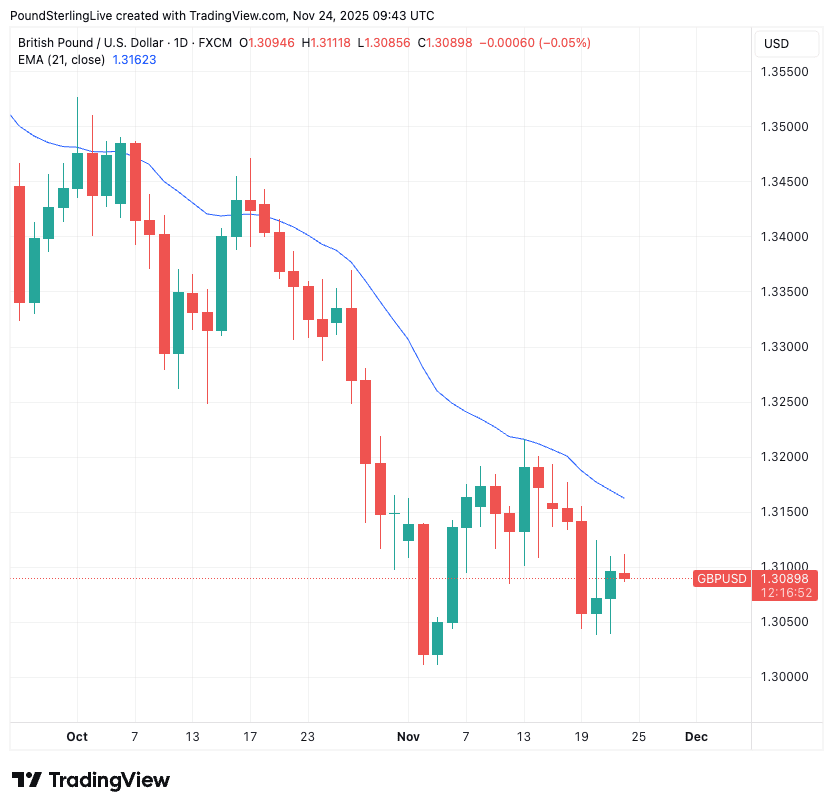
The Pound to Dollar exchange rate (GBP/USD) moved little on Monday, with traders staying cautious ahead of Wednesday’s autumn budget.
At the time of writing, GBP/USD was trading at $1.3095, showing minimal movement since markets opened.
The Pound (GBP) held to a narrow range on Monday, with traders opting for caution as they awaited fresh clarity from Westminster. The absence of new UK data left sentiment largely unchanged, while all eyes turned to Wednesday’s autumn budget.
Chancellor Rachel Reeves is preparing to unveil the government’s fiscal blueprint for the year ahead — a challenging balance between supporting economic growth, maintaining fiscal credibility, and managing competing political pressures within the Labour Party.
With so much riding on Wednesday’s announcement, investors hesitated to reposition Sterling without firmer clues on the government’s direction.
The US Dollar (USD) also traded sideways on Monday, with investors uncertain about how the Federal Reserve will guide policy in the coming months.
The currency drew strong support last week as markets tilted toward a more hawkish Fed outlook. That momentum faded after policymaker John Williams struck a softer tone, prompting the Dollar to relinquish part of its recent gains.
Get better rates and lower fees on your next international money transfer.
Compare TorFX with top UK banks in seconds and see how much you could save.
By Monday, the ‘Greenback’ had stabilised, with traders opting for restraint while awaiting further Fed commentary and upcoming US data releases.
The Confederation of British Industry’s (CBI) distributive trades survey is the sole UK release on Tuesday, and the Pound may struggle if the data disappoints. Sales volumes are expected to fall further in November — from -27 to -30 — signalling ongoing pressure on consumer demand. Any such weakness could lightly weigh on Sterling.
In the US, attention turns to the latest ADP employment change data. Following two consecutive declines, another soft print would reinforce concerns that the labour market is losing momentum. Weakening employment trends typically heighten expectations for Federal Reserve interest rate cuts, which could put pressure on the US Dollar.
However, the ‘Greenback’ may find some support from additional data due on Tuesday. Producer prices for September are forecast to rise, while retail sales are expected to remain in positive territory — both reminders that underlying demand in the US economy remains resilient.
Broader market sentiment will also play a key role. A risk-on shift would tend to support the increasingly risk-sensitive Pound, while any deterioration in confidence could steer investors back toward the safer US Dollar, limiting potential USD losses.

International Money Transfer? Ask our resident FX expert a money transfer question or try John’s new, free, no-obligation personal service! ,where he helps every step of the way,
ensuring you get the best exchange rates on your currency requirements.
TAGS: Pound Dollar Forecasts
The 20-day average has become the centerpiece of recent price action. Prior to last week’s successful defense, three earlier pullbacks briefly undercut the line only to be immediately reclaimed; today’s instant rejection from the converged zone demonstrates progressively stronger demand and a clearly improving structural relationship with this critical benchmark.
With follow-through above today’s low, the $4.59 level will officially register as another higher swing low above last week’s $4.46 low print, extending the textbook series of higher lows that has defined the rally since the October bottom and reinforcing the underlying bullish trends integrity.
Bulls still need strong weekly conviction to deliver a sustained breakout above last week’s $4.81 lower swing high. Clearing that level erases the only bearish blemish on the chart and directly targets the March 2025 trend high near $4.95 alongside the full 88.6% Fibonacci retracement of the entire August-to-March bear move.
A sustained daily decline below the 20-day average and today’s $4.59 low would constitute the clearest bearish warning yet, immediately placing the November $4.46 swing low in jeopardy. Only a decisive break beneath that level would fully invalidate the higher high/higher low sequence and shift the intermediate trend bias.
Monday’s textbook defense of the 20-day/internal trendline confluence strongly favors continuation of the higher-low pattern and keeps buyers firmly in control. Protect the $4.59–$4.54 zone to maintain structural integrity and set up a weekly assault on $4.81 toward $4.95; sustained trade below the 20-day line would redirect attention to the November $4.46 low as the next make-or-break decision point.
For a look at all of today’s economic events, check out our economic calendar.
GBP/USD Year-End 2025 Forecast
Consensus from major banks.
Image © Adobe Images
The pound to dollar exchange rate (GBP/USD) could recover if this week’s budget set-piece does just enough to reassure investors that the UK isn’t facing an imminent debt crisis.
Budget 2026 will see the government lay out tax changes that will aim to generate between £20BN and £30BN, depending on who you ask.
That’s quite the range and opens the door to a host of outcomes that means the day should be an interesting one with the potential to generate notable volatility.
How much are you sending from pounds to dollars?
Your potential USD savings on this GBP transfer:
$318
By using specialist providers vs high street banks
Compare GBP to USD Rates Now →
Free comparison • No commitment required • Takes 2 minutes
One-week risk reversals on the options markets show investors are positioned for intraday volatility of about 1.0%, which is quite significant and tells us that those with pound into dollar payments, and vice versa, should be ready to act quickly on any beneficial moves.
Our partners at Horizon Currency are here to help you set up your pre-budget strategy. Just
The risk for GBP is that Chancellor Rachel Reeves fails the credibility test and that the announced tax hikes are judged by markets to be both inefficient and ineffective.
This could push UK bond yields higher and the pound lower, in a sign of distress akin to the Liz Truss mini-budget.
However, markets have sold sterling for weeks now in anticipation of a bad budget, meaning it’s already absorbed a hefty risk premium.
“The GBP has priced in a fiscal risk premium over the past month, with the broader USD rally also contributing to a lower GBPUSD,” says a note from the UBS Chief Investment Office.

GBP/USD fell steadily through September and October, from 1.3650 to a low of 1.3010 on November 04, from where it has entered a sideways consolidation that tops out at 1.32.
With positioning still leaning one-sided against sterling, there’s a good chance (above 50%) that the market actually breathes a sigh of relief once the event has passed.
Just the lifting of uncertainty might be enough to trigger a rebound.
“The Autumn Budget presents a two-sided risk, but we expect the fiscal risk premium to be priced out after the event, supporting GBPUSD toward 1.34 by year-end,” says UBS CIO.
“With heightened market attention, the government’s main priority is to reassure fiscal soundness by adhering to fiscal rules and increasing headroom. We think they will deliver just that, which should translate into the removal of GBP’s risk premium and a boost to GBPUSD,” adds the note.
The Budget: What to Watch
The government heads into the 26 November Autumn Budget with an estimated £20bn deterioration in fiscal headroom against the deficit rule.
Goldman Sachs expects the Chancellor to deliver a £25bn net fiscal consolidation (0.7% of GDP), raising headroom to around £15bn after new measures.
A larger adjustment to household energy bills is now anticipated, costing £4.3bn initially, replacing the previously expected VAT cut.
A freeze in fuel duty and extension of the temporary 5p cut remains expected, costing £3bn in FY2026.
Spending cuts look set to be modest at around £3bn, with departmental budgets broadly unchanged through FY2028.
Welfare changes include around £1bn in savings but also the full lifting of the two-child benefit cap, costing £3.5bn.
This means around £30bn of tax increases will be needed, likely delivered through a package of smaller measures rather than income tax rate rises.
Extending personal tax threshold freezes to 2030 is expected to raise £10bn, with other measures spanning council tax, pensions, CGT and gambling.
New measures are expected to deliver a 0.2% cumulative drag on demand, while energy-related policies should reduce headline inflation by 0.4pp in 2026.
OBR forecasts are likely to show higher CGNCR in FY2025 (+£8bn) but little change in FY2026, with downward revisions later due to lower borrowing and reduced APF losses.
T-Mobile US (TMUS) declined in its latest intraday trading, under the dominance of a primary short-term downtrend with movement aligned to a descending minor trendline supporting this path. Persistent negative pressure continues as the stock trades below its 50-day simple moving average, and additionally, a clear bearish divergence has formed on the Relative Strength Indicators after they reached extremely overbought levels, exaggerated relative to the price action, with fresh negative signals emerging.
Therefore, we expect the stock to decline in the upcoming trading sessions, as long as resistance at the price level of $218.35 remains intact, targeting the key support level of $199.40.
Today’s price forecast: Bearish
BitcoinWorld
USD/JPY Forecast: Morgan Stanley’s Shocking Prediction of 140 Drop Revealed
Forex markets are buzzing with Morgan Stanley’s latest USD/JPY forecast predicting a dramatic drop to 140. This surprising prediction comes at a time when cryptocurrency traders are closely watching traditional currency movements for cross-market opportunities. The investment bank’s analysis suggests significant shifts in global currency dynamics that could impact digital asset valuations and trading strategies.
Morgan Stanley’s research team has released a comprehensive USD/JPY forecast that challenges current market consensus. Their analysis points to several key factors driving this prediction:
The Morgan Stanley analysis employs sophisticated quantitative models combined with fundamental research. Their team examines multiple scenarios including:
| Scenario | Probability | Target Level |
|---|---|---|
| Base Case | 60% | 140 |
| Bearish Case | 25% | 135 |
| Bullish Case | 15% | 155 |
The projected yen strength stems from multiple fundamental drivers. Bank of Japan policy normalization appears increasingly likely as inflation pressures build. Meanwhile, Japan’s current account surplus provides structural support for the currency. Technical analysis also suggests the yen is oversold after years of weakness, setting the stage for a meaningful reversal.
Morgan Stanley’s forecast reflects concerns about dollar weakness extending beyond just the JPY pair. The US currency faces headwinds from potential Fed rate cuts, growing fiscal concerns, and shifting global reserve allocation patterns. This dollar weakness could have significant implications for cryptocurrency markets, particularly stablecoins and cross-border trading pairs.
For forex trading professionals, this forecast requires careful consideration of position sizing and risk management. Key actionable insights include:
What timeframe does Morgan Stanley project for USD/JPY reaching 140?
The analysis suggests this level could be reached within the next 6-12 months, depending on policy developments.
How does this forecast compare to other major banks?
Morgan Stanley appears more bearish on USD/JPY than most competitors, who generally see more limited downside.
What are the main risks to this forecast?
Unexpected Fed hawkishness or delayed BOJ normalization could delay or prevent the projected move.
How should cryptocurrency traders interpret this forecast?
Currency movements often correlate with crypto markets, particularly affecting JPY trading pairs and stablecoin flows.
Which companies are most affected by USD/JPY movements?
Japanese exporters like Toyota and Sony benefit from yen weakness, while US companies with Japanese operations face currency headwinds.
Morgan Stanley’s bold USD/JPY forecast to 140 represents a significant shift in currency market expectations. The combination of yen strength and dollar weakness creates both challenges and opportunities for traders across all asset classes. As global monetary policies diverge and economic conditions evolve, staying informed about currency dynamics becomes increasingly crucial for successful portfolio management.
To learn more about the latest Forex market trends, explore our article on key developments shaping currency pairs and interest rates institutional adoption.
This post USD/JPY Forecast: Morgan Stanley’s Shocking Prediction of 140 Drop Revealed first appeared on BitcoinWorld.
EUR/USD trades around 1.1540 on Monday, up 0.20% on the day, extending Friday’s rebound from 1.1490. The move reflects a moderate recovery in risk sentiment, while the US Dollar loses momentum as easing expectations continue to build.
The table below shows the percentage change of Euro (EUR) against listed major currencies today. Euro was the strongest against the Japanese Yen.
| USD | EUR | GBP | JPY | CAD | AUD | NZD | CHF | |
|---|---|---|---|---|---|---|---|---|
| USD | -0.13% | 0.07% | 0.39% | 0.14% | 0.13% | 0.17% | -0.01% | |
| EUR | 0.13% | 0.20% | 0.53% | 0.27% | 0.27% | 0.30% | 0.13% | |
| GBP | -0.07% | -0.20% | 0.33% | 0.07% | 0.07% | 0.09% | -0.07% | |
| JPY | -0.39% | -0.53% | -0.33% | -0.25% | -0.26% | -0.21% | -0.38% | |
| CAD | -0.14% | -0.27% | -0.07% | 0.25% | -0.00% | 0.02% | -0.14% | |
| AUD | -0.13% | -0.27% | -0.07% | 0.26% | 0.00% | 0.03% | -0.13% | |
| NZD | -0.17% | -0.30% | -0.09% | 0.21% | -0.02% | -0.03% | -0.16% | |
| CHF | 0.00% | -0.13% | 0.07% | 0.38% | 0.14% | 0.13% | 0.16% |
The heat map shows percentage changes of major currencies against each other. The base currency is picked from the left column, while the quote currency is picked from the top row. For example, if you pick the Euro from the left column and move along the horizontal line to the US Dollar, the percentage change displayed in the box will represent EUR (base)/USD (quote).
Markets remain focused on the increasingly accommodative tone coming from the Federal Reserve (Fed). After New York Fed President John Williams suggested last Friday that policy was now “modestly restrictive” and that there was “room for further adjustment in the near term”, investors were encouraged again on Monday by remarks from Governor Christopher Waller, who said he would advocate for a rate cut at the December meeting, noting that recent data show “not much change” in the inflation-employment balance and highlighting persistent weakness in the labor market.
This shift has significantly strengthened easing expectations. According to the CME FedWatch tool, markets now assign nearly a 70% chance to a 25-basis-point rate cut in December, up from roughly 50% at the end of last week.
In the Eurozone, however, the backdrop remains more fragile. Monday’s IFO survey showed that German business sentiment deteriorated further in November, with the headline index falling to 88.1 from 88.4, against expectations for an improvement. The small uptick in the Current Assessment index was overshadowed by a sharp decline in Expectations, down to 90.6, confirming that Germany’s recovery remains slow and uneven. An element that limits upside potential for the Euro (EUR).
This follows Friday’s Purchasing Managers Index (PMI) releases, which revealed renewed contraction in Eurozone Manufacturing activity and a slowdown in Services. The region’s subdued momentum continues to prevent the Euro from attracting more sustained inflows, even though the broader market mood is improving.
In the United States (US), last week’s S&P Global PMIs and the Michigan Consumer Sentiment Index painted a mixed but broadly softening picture of the economy. The data reinforced the narrative of a gradual cooling, giving markets confidence that the Fed can safely shift toward policy easing. The dovish messaging from Fed policymakers largely overshadowed these developments.
While Monday’s economic calendar remains light, traders are already preparing for a high-impact Tuesday, featuring several economic data sets in the Eurozone and especially in the US.
These releases could redefine short-term direction for both the US Dollar and the Euro, and will likely play a decisive role in shaping EUR/USD this week. If US data confirm further cooling, the pair may extend its recovery. Conversely, stronger-than-expected US inflation or consumption figures could quickly restore support for the Greenback and cap the Euro’s current rebound.
In the 4-hour chart, EUR/USD trades at 1.1541, up for the day and 25 pips above the day opening. The 100-period Simple Moving Average (SMA) edges lower at 1.1554, and the pair holds beneath it, keeping rallies contained. A close above this average would ease bearish pressure. The Relative Strength Index (RSI) prints 50 (neutral) after a rebound from oversold, hinting at stabilizing momentum. Immediate resistance stands at 1.1550.
The descending trend line from 1.1819 limits gains, with resistance seen at 1.1624. Support is seen at 1.1500, followed by 1.1470. A break of 1.1550 would open a run toward 1.1624 and 1.1820, while rejection under the moving average would leave the bias heavy and expose 1.1500.
(The technical analysis of this story was written with the help of an AI tool)


