The main category of Forex News.
You can use the search box below to find what you need.
[wd_asp id=1]
The main category of Forex News.
You can use the search box below to find what you need.
[wd_asp id=1]
Gold (XAU/USD) is consolidating near $4,040 per ounce, holding just above critical support at $4,000, after retreating nearly 7% from its October 20 all-time high of $4,380. The metal’s recent slump marks its steepest decline since April, driven by renewed strength in the U.S. dollar (DXY 100.1), aggressive Treasury yields, and heavy liquidation from speculative longs following last month’s retail euphoria. The move coincides with turbulence across the mining sector, where Barrick Gold Corp (NYSE:GOLD) is under pressure from Elliott Management and investors calling for structural changes amid declining output and internal turmoil.
Gold’s chart structure has shifted into a symmetrical consolidation pattern, anchored between $4,000 and $4,100, after breaking down from the October double-top. Despite volatility, higher lows from $3,950 to $4,020 continue to build a potential base. According to current trading data, support at $4,000 has been tested five times over the past six sessions without a daily close below it, underscoring its technical significance. Should that level fail, the next support zone lies at $3,895–$3,916, while on the upside, $4,145–$4,161 and $4,250 serve as resistance. Sustained movement above $4,250 would reopen a path toward $4,380 and possibly $4,500, a key psychological mark.
Momentum indicators remain mixed: the RSI hovers near 48, showing loss of bullish momentum without clear capitulation, while MACD signals flattening. The ADX at 29 indicates a consolidating, rather than trending, environment—consistent with coiling behavior before a potential breakout.
In Southeast Asia, demand for physical gold remains intense. In Kuala Lumpur, jeweler data shows 916 gold priced at RM595 per gram, while 999.9 gold fetches around RM625–RM640, even after retreating from October’s RM680 peak. Despite the dip, Habib Jewels and other major retailers report 20% higher sales in 2025 than last year, with queues forming as buyers exchange jewelry for profit or reinvest in gold bars. Retailers are serving 50–100 customers daily, doubling weekday volume from 2024.
Buyers are split between profit-taking and accumulation. Some anticipate further gains, targeting RM700–RM1,000 per gram by 2026. Public Gold, one of Malaysia’s largest digital investment platforms, reports a surge in online gold purchases as households seek to hedge inflation and currency risk.
The broader macro setup remains pivotal. Gold’s correlation with the S&P 500 (INDEXSP:.INX) has turned positive again in 2025, meaning both assets move in sync amid U.S. growth uncertainty. The Federal Reserve’s decision to delay any policy easing into 2026, confirmed by Morgan Stanley (NYSE:MS) forecasts, limits upside momentum for non-yielding assets. Additionally, rising Japanese bond yields, concerns over an AI-driven equity bubble, and fears of a global market correction have amplified volatility.
Still, gold remains resilient compared to broader risk assets. The CBOE Volatility Index (VIX) surged 11% this week, while gold held within its range, suggesting steady haven interest. Inflation pressures from energy and food remain persistent, keeping real yields tight and dampening speculative buying.
While gold prices hover near $4,000, miners are facing a reckoning. Barrick Gold Corp (NYSE:GOLD)—valued near $64 billion—is under activist scrutiny following the abrupt exit of CEO Mark Bristow and the entry of Elliott Management, which has reportedly taken a $700 million stake. The hedge fund’s push for restructuring, possibly splitting the company into separate North American and global units, follows a series of setbacks, including safety incidents, declining production, and geopolitical risk from its $9 billion Reko Diq copper-gold project in Pakistan.
Barrick’s share price has lagged peers like Agnico Eagle Mines (NYSE:AEM) and AngloGold Ashanti (NYSE:AU), trading at lower valuation multiples despite record bullion prices. Interim CEO Mark Hill has shifted focus to Nevada operations, integrating its Pueblo Viejo mine and emphasizing safety improvements after three fatalities across sites this year. Investors expect clarity before year-end on potential asset divestments or a merger with Newmont Corp (NYSE:NEM), which already shares ownership of key assets.
Silver (XAG/USD) amplifies the pressure, sliding over 10% since its October peak. The metal’s double-top pattern suggests deeper retracement potential, with downside targets near $41 per ounce. The technical correlation between gold and silver remains strong, meaning a silver breakdown often precedes extended weakness in XAU/USD. Analysts view the A-B-C corrective wave in silver as a cautionary signal for gold bulls expecting a quick rebound.
ETF holdings show defensive behavior. SPDR Gold Shares (NYSEARCA:GLD) reported modest outflows of $327 million last week, while iShares Gold Trust (NYSEARCA:IAU) saw $95 million in inflows, suggesting portfolio rebalancing rather than mass liquidation. Institutional investors are rotating from leverage-based products to physical-backed funds amid tightening liquidity conditions.
Retail sentiment, on the other hand, is deeply polarized—fear of missing another rally competes with the desire to lock profits. The gold-to-silver ratio, now above 95, remains elevated, signaling risk aversion and preference for core safe-haven exposure over industrial-linked metals.
Despite its near-term consolidation, gold retains its hedge status across multiple jurisdictions. Central banks, led by China, Turkey, and India, have collectively purchased over 460 tons year-to-date, according to IMF data. China’s opaque reserve accumulation policy remains a key driver—its quiet acquisitions throughout Q3 supported gold’s early rally past $4,000 before October’s selloff.
Meanwhile, private-sector gold accumulation in emerging markets continues. Digital platforms in Southeast Asia report transaction growth exceeding 35% year-over-year, a sign that retail confidence remains strong despite volatility. In Malaysia and Thailand, gold remains a cultural and financial hedge, underpinning long-term demand even as global markets flirt with panic.
From a technical and macro standpoint, gold’s near-term direction hinges on the $4,000 support threshold. A daily close below it risks a breakdown toward $3,895–$3,900, while sustained trade above $4,100–$4,150 could mark the beginning of a new rally cycle toward $4,250 and eventually $4,380.
Institutional positioning leans neutral but biased toward accumulation on dips. If central banks maintain gold buying pace and the Fed signals even mild dovishness in Q1 2026, XAU/USD could regain its bullish footing.
At current levels near $4,040, the risk-reward balance favors a Hold outlook—technically cautious, fundamentally supported. The consolidation between $3,950 and $4,150 remains a potential launchpad for renewed momentum once macro clarity returns. Gold’s behavior against the S&P 500 (INDEXSP:.INX) and NASDAQ:IXIC correlation will serve as the next barometer for investor risk tolerance as 2025 draws to a volatile close.
– Written by
Frank Davies
STORY LINK British Pound to Dollar Forecast: GBP/USD Risks Tilted to Upside
The Pound to Dollar exchange rate (GBP/USD) held near 1.3075 despite a sharp global risk-off move led by equities and crypto.
Softer UK data and renewed fiscal worries are limiting Sterling’s ability to extend higher, keeping consensus expectations anchored around a 1.30-1.31 trading band.
Markets now look to incoming fiscal updates and December BoE signals to judge whether support at 1.30 can hold.
Volatility across asset classes jumped on Thursday with a particular focus on equities. The US S&P 500 index initially traded sharply higher before a sharp reversal in Nvidia triggered notable losses.
The FTSE 100 index also dipped sharply to 1-month lows on Friday while bitcoin slumped to 7-month lows.
In these circumstances, the Pound was broadly resilient with the Pound to Dollar (GBP/USD) exchange rate trading around 1.3075, but there will be notable unease surrounding the UK fundamentals and risk conditions.
Get better rates and lower fees on your next international money transfer.
Compare TorFX with top UK banks in seconds and see how much you could save.
According to UoB; “The outlook for today is mixed after the choppy price movements. Today, GBP could trade between 1.3045 and 1.3120.”
Key support remains around 1.30.
The UK government borrowing requirement narrowed to £17.4bn for October from £19.2bn the previous year, but above consensus forecasts of £15.2bn.
For the first seven months of fiscal 2025/26, the deficit widened to £116.8bn from £107.8bn the previous year and around £10bn above ONS projections.
Richard Carter, head of fixed interest research at Quilter Cheviot commented; “Ultimately, today’s borrowing figures suggest Reeves is running out of room, and potentially time, to kick start the economy and get it growing once again. While rate cuts will help, inflation remains sticky and as such the Bank of England may not act as aggressively as the government would like. The ball is in Reeves’ court, but her next move will prove crucial next week.”
Kenneth Broux, head of corporate research FX and rates at Societe Generale commented; “It’s very difficult and I think there’s quite a bit of bad news already priced in, but it doesn’t mean that it can’t get worse.”
He added; “If the gilt market has absolutely no trust in the new borrowing figures and whether the fiscal headroom can be delivered, then we will see a fair steepening of the gilt curve and that is going to result in a weaker sterling.”

Retail sales data was also weaker than expected with a 1.1% decline in volumes for October compared with expectations of a 0.1% decline with the year-on-year increase held to 0.2%.
The UK PMI services-sector index also dipped to a 7-month low of 50.5 for October from 52.3 and below consensus forecasts of 52.0 although the manufacturing PMI index edged back above the 50.0 level to a 14-month high.
Notably, the rate of increase in output charges slowed to a 5-year low despite strong upward pressure on costs.
Chris Williamson, Chief Business Economist at S&P Global Market Intelligence commented; “November’s flash PMI surveys brought disappointing news on the UK economy. Economic growth has stalled, job losses have accelerated, and business confidence has deteriorated.”
He added; “The PMI data therefore suggest the policy debate will shift further away from inflation worries toward the need to support the struggling economy, hence adding to the chances of interest rates being cut in December.”
International Money Transfer? Ask our resident FX expert a money transfer question or try John’s new, free, no-obligation personal service! ,where he helps every step of the way,
ensuring you get the best exchange rates on your currency requirements.
TAGS: Pound Dollar Forecasts
The GBP/USD weekly forecast reveals sustained pressure as the soft UK data, like a 1.1% MoM drop in UK retail sales in October, while annual growth came at 0.2%, both well below expectations.
-Are you looking for the best AI Trading Brokers? Check our detailed guide-
Meanwhile, sterling came under pressure amid growing odds of the Bank of England’s tilt towards a looser policy in the near term due to weaker domestic demand and persistent fiscal concerns ahead of the Autumn budget. The UK PMI data remained mixed, failing to generate any buying traction. On the other hand, the US Federal Reserve signaled caution as inflation remains a risk, shrinking December rate cut expectations. The net effect is GBP/USD staying within a narrow range near 1.3100 after finding a bottom around 1.3050.
Across the Atlantic, the US dollar remains firm after hawkish FOMC meeting minutes that dampened expectations for rate cuts, as revealed by the CME FedWatch tool, to around 35%. The US NFP data exceeded expectations, reflecting 119k jobs added against the expected 55k. The October data is not likely to be released, although some of it will be reflected in the November data, which will be key to watch. Meanwhile, US PMI readings showed a mild improvement, with no significant impact on the US dollar.
Moving ahead to the next week, the outlook remains tilted to the downside unless sterling receives a positive boost. On the UK side, the market participants will be watching for signs of stabilization in consumer spending after poor retail sales. However, the primary focus remains on the UK budget. In the US, the focus lies on the labor and inflation data, along with further remarks from Fed officials. The significant events scheduled for next week include Core PCE, PPI, Retail Sales, and the GDP Price Index.
The GBP/USD daily chart reveals a weak structure near the broken demand zone. A strong bearish candle, followed by a bearish pinbar, shows the odds of more downside. However, 1.3050 acts as an intermediate support ahead of 1.3000. As UOB states, the pound is unlikely to find a sustained breakout below 1.3000. But a breakout could attract more sellers and test the 1.2900 level.
-Are you looking for the best MT5 Brokers? Check our detailed guide-
On the other hand, any acceptance above the 1.3100 area could gather buying momentum and aim to test the 1.3200 level. While the RSI has begun rising from the oversold region, it remains below 50.0, indicating neutral momentum.
Looking to trade forex now? Invest at eToro!
75% of retail investor accounts lose money when trading CFDs with this provider. You should consider whether you can afford to take the high risk of losing your money.
Gold (XAU/USD) is trading near $4,065 per ounce, maintaining a steady range after retreating from the record high of $4,294 reached in October 2025. The metal has corrected about 5.4% over the past month as traders digest mixed signals from the Federal Reserve, a stronger dollar, and resilient U.S. yields. Despite the pullback, gold remains up over 45% year-to-date, underscoring its strength as the top-performing major asset of 2025.
Since October, gold has fallen by roughly $230 per ounce, sliding from $4,294 to $4,065 amid tightening liquidity and a temporary rebound in the U.S. dollar. The Dollar Index (DXY) climbed toward 100.5, while the 10-year Treasury yield stabilized at 4.06%, curbing speculative inflows into precious metals. The correction coincided with a sharp depreciation of emerging-market currencies, including the Indian Rupee, which hit ₹89.43 per USD — indirectly cushioning gold prices in local terms. Analysts attribute the drop to profit-taking after the record surge and the fading probability of a December rate cut, which swap markets now estimate at 40%, down from 73% two weeks ago.
Gold’s technical pattern has formed a symmetrical triangle, reflecting consolidation after the vertical rally. Support remains firm near $4,000 to $4,044, tested repeatedly during the week without a single daily close below that zone. The next support cluster lies at $3,895–$3,916, marking the level where buyers are likely to re-enter aggressively. On the upside, short-term resistance is seen around $4,145 to $4,161, followed by a critical breakout barrier at $4,250. A confirmed close above that level would open the door toward $4,380–$4,500, which aligns with the next Fibonacci projection and psychological extension target.
The 50-day moving average currently sits near $4,088, the 100-day at $3,960, and the 200-day at $3,752, keeping the medium-term trend decisively bullish. The RSI on the daily chart holds near 52, suggesting neutral momentum with a slight upward bias. As long as $4,000 holds, the broader trajectory remains constructive.
The gold market is anchored to expectations around U.S. monetary policy. New York Fed President John Williams recently signaled openness to a rate cut “in the near term,” giving short-term support to gold. However, Chicago Fed President Austan Goolsbee cautioned against early easing, warning that inflation progress has “begun to move in the wrong direction.” These conflicting statements have kept gold confined to its current $4,000–$4,150 corridor ahead of the December 9-10 FOMC meeting. A decisive dovish tilt could reignite a rally; conversely, a firm “higher for longer” message would expose gold to renewed downside pressure toward $3,900.
Underlying fundamentals remain exceptionally strong. Data from the World Gold Council show that global demand reached 1,249 tonnes in Q2 2025, up 3% year-on-year, while central banks added 166 tonnes to their reserves. Institutional investors continue to treat gold as a structural hedge against fiscal imbalance and currency debasement. The iShares Global Gold Index ETF (TSX:XGD) has gained over 100% YTD, and the Sprott Physical Gold Trust (TSX:PHYS) reported steady inflows through October despite temporary profit-taking. This reinforces that gold’s investor base is not purely speculative but strategically anchored to long-term macro hedging.
Gold miners continue to amplify the metal’s performance due to strong operational leverage. IAMGOLD (TSX:IMG), with production costs near $2,500 per ounce, has benefited disproportionately — its stock is up 135% YTD, far exceeding the 54% rise in gold prices earlier this year. Sierra Madre Gold & Silver (TSXV:SM) posted a 24% quarter-on-quarter revenue jump to $3.59 million in Q2 2025, with realized prices averaging $3,271 per ounce and cash costs at $23.32 per silver-equivalent ounce. At current gold prices above $4,000, margin expansion across miners remains significant, suggesting continued earnings strength if prices stay near current levels.
Geopolitical dynamics remain a persistent catalyst for gold. The tentative U.S.–Russia–Ukraine peace proposal temporarily reduced haven flows but failed to shift the longer-term narrative of global instability. In Asia, renewed trade friction between India and the U.S. added uncertainty, keeping gold demand steady in key consumption hubs. The Pakistan market mirrored international trends, with 24-karat gold rising $23 per ounce to $4,065, equivalent to an increase of Rs 2,300 per tola. Rising silver prices — now near $49.98 per ounce — underline a broader defensive allocation across precious metals.
Gold is consolidating within a healthy bullish channel. If $4,000 continues to hold, technical projections favor a retest of $4,250 in the coming weeks, followed by potential extension toward $4,380–$4,500 if the Fed confirms a rate-cut path. A breakdown below $3,895 would trigger short-term cooling but would not compromise the longer-term uptrend unless $3,750 is breached.
According to Ponmudi R. (Enrich Money), short-term targets range between $4,100–$4,160, while the medium-term view caps resistance near $4,210–$4,250. He emphasizes that dips below $3,970 could attract value-based buying, especially from central banks and Asian wholesalers. The Dollar Index’s resistance at 100.50 remains critical; failure to break higher would likely support renewed gold strength through December.
Gold remains a macro-hedge asset supported by central-bank demand, real-yield compression, and high geopolitical tension. The correction from $4,294 to $4,065 reflects consolidation, not exhaustion. Current data suggest accumulation is favored between $4,000 and $4,050, with stop levels just under $3,895 and upside targets between $4,250 and $4,450.
The long-term drivers — monetary debasement, fiscal deficits exceeding 120% of GDP across G7 economies, and rising production costs — continue to underpin a structural bullish outlook.
Trading News Verdict:
Gold (XAU/USD): HOLD → Bullish Bias Above $4,000 | Breakout Target $4,450
Current Price: $4,065
Support: $3,895 / $4,044
Resistance: $4,161 / $4,250 / $4,380
Record High: $4,294 (October 2025)
Central Bank Purchases: 166 tonnes (Q2 2025)
Dollar Index: 100.5 — Key Resistance
Price has spent the entire week testing the critical confluence of the 61.8% Fibonacci retracement at $4,023 and the 20-day average near $4,041. A short-term uptrend line cuts through the range, adding dynamic context to this high-density support zone.
Weekly support arrives at the rising 10-week average near $3,988, mirroring the daily 50-day average at $3,981. Both longer-term benchmarks sit only marginally below current price and remain untested since their August reclaim.
The $3,998 higher interim swing low established Tuesday stays intact so far. As long as it holds, the uptrend structure from October’s $3,886 base remains valid, bolstered by the recent 10-day/20-day bullish cross and 20-day reclaim.
Last week’s lower swing high at $4,245 and closing in the lower half of the week’s range created a potential shooting star. Validation requires a weekly close below last week’s $3,997 low, which would deliver strong bearish momentum and threaten the 50-day line. However, for active traders, an initial dip may provide a valid signal.
A weekly push above $4,133 targets last week’s high, then the $4,381 October record. Recent momentum slowdown, however, makes extended consolidation beyond this week a realistic possibility.
Gold’s inside week places the 20-day/61.8% confluence as the immediate pivot. Hold $3,998–$3,997 to protect the higher-low sequence and favor eventual continuation higher; a weekly close below $3,997 activates the shooting star and targets the untested 50-day near $3,981. Until proven otherwise, dips into this zone remain buyable in the structural bull trend.
Natural gas price rose in its last trading on the intraday basis, due to its leaning on the support of EMA50, gaining bullish momentum that helped it to achieve these last gains, preparing to attack the key resistance at $4.75, amid the dominance of the main bullish trend on the short-term basis and its trading alongside supportive trend line for this trend, besides the emergence of the positive signals on the relative strength indicators, after reaching oversold levels.
Therefore, we suggest a rise in its upcoming intraday trading, especially when breaching $4.75, to target its main resistance at $5.00.
The expected trading range for today is between $4.55 and $5.00
Trend forecast: Bullish
The euro initially tried to rally against the British pound but turned around to show signs of weakness again. Ultimately, this is a market that I think is going to continue to be very choppy, and therefore, you have to look at it through the prism of a range-bound type of situation, with short-term pullbacks perhaps offering buying opportunities. The 0.8750 level is an area that previously had been significant resistance, so I think you have to look at it as market memory just waiting to happen in the form of support.
The 50-day EMA sits there as well, so that, of course, helps. I look at this as a market that gives us an opportunity on these dips to pick up cheap euros. I don’t look for an explosive move, but I do think the measured move of the previous consolidation, suggesting 0.89 as a target, is pretty reasonable, but this pair tends to move at a snail’s pace.
For a look at all of today’s economic events, check out our economic calendar.
Gold is struggling for a direction, while trading under the $4,100 mark early Friday, although remaining confined in a familiar range. Despite the range-play, Gold is set to end the week on a subdued note.
Markets remain wary about whether the US Federal Reserve (Fed) will cut or not cut interest rates in December, especially after the dated September US employment report released Thursday.
The headline US Nonfarm Payrolls (NFP) rose by 119,000 in September, following a 4,000 decrease (revised from +22,000) recorded in August. The reading outpaced the market forecast of 50,000.
Meanwhile, the Unemployment Rate rose to 4.4% from 4.3% in this period. The mixed data provided an ambiguous picture of the Fed’s path forward on interest rates.
However, markets continued to price in about a 40% chance that the Fed will lower rates next month as policymakers remained cautious on further monetary policy easing.
“Cleveland Fed President Beth Hammack warned on Thursday that cutting rates further right now carries a wide range of risks for the economy. Fed Governor Lisa Cook sees a risk of outsized asset price declines.”
The hawkish sentiment surrounding the Fed is weighing on non-yielding assets such as Gold. But Gold’s downside appears cushioned by the tech sell-off on Wall Street and later in the Asian markets as the solid Nvidia earnings-led rally faded.
Expectations of a massive economic stimulus package due to be unveiled by Japan’s government later on Friday also help keep Gold buyers hopeful. The package is estimated to be worth over JPY 20 trillion, the biggest since COVID-19.
Traders now eagerly await the S&P Global preliminary PMI data for November from the United States (US) for fresh insights on the health of the US economy The data could help markets reprice Fed rate cut expectations, eventually impacting Gold price action.
The US Manufacturing PMI is set to fall to 52 in November from 52.5 in October. The Services PMI is likely to stay unchanged at 54.8 in the reported period.
In the daily chart, XAU/USD trades at $4,065.29. The 50-, 100-, and 200-day Simple Moving Averages (SMAs) advance while price holds above them, maintaining a bullish bias. The 21-day SMA has flattened and edged lower, with $4,044.66 offering nearby dynamic support. The Relative Strength Index (RSI) stands at 52.00 (neutral), reflecting balanced momentum after the recent rebound.
Measured from the $4,381.17 high to the $3,885.84 low, the 38.2% retracement at $4,075.05 acts as near-term resistance, and a daily close above it would open the 50% retracement at $4,133.50. With momentum neutral and trend support intact, the path of least resistance would improve on a break of this barrier, while failure to clear it would keep gains capped and risk a return to the rising averages.
(The technical analysis of this story was written with the help of an AI tool)
Monetary policy in the US is shaped by the Federal Reserve (Fed). The Fed has two mandates: to achieve price stability and foster full employment. Its primary tool to achieve these goals is by adjusting interest rates.
When prices are rising too quickly and inflation is above the Fed’s 2% target, it raises interest rates, increasing borrowing costs throughout the economy. This results in a stronger US Dollar (USD) as it makes the US a more attractive place for international investors to park their money.
When inflation falls below 2% or the Unemployment Rate is too high, the Fed may lower interest rates to encourage borrowing, which weighs on the Greenback.
The Federal Reserve (Fed) holds eight policy meetings a year, where the Federal Open Market Committee (FOMC) assesses economic conditions and makes monetary policy decisions.
The FOMC is attended by twelve Fed officials – the seven members of the Board of Governors, the president of the Federal Reserve Bank of New York, and four of the remaining eleven regional Reserve Bank presidents, who serve one-year terms on a rotating basis.
In extreme situations, the Federal Reserve may resort to a policy named Quantitative Easing (QE). QE is the process by which the Fed substantially increases the flow of credit in a stuck financial system.
It is a non-standard policy measure used during crises or when inflation is extremely low. It was the Fed’s weapon of choice during the Great Financial Crisis in 2008. It involves the Fed printing more Dollars and using them to buy high grade bonds from financial institutions. QE usually weakens the US Dollar.
Quantitative tightening (QT) is the reverse process of QE, whereby the Federal Reserve stops buying bonds from financial institutions and does not reinvest the principal from the bonds it holds maturing, to purchase new bonds. It is usually positive for the value of the US Dollar.
The Pound Sterling (GBP) broke its previous week’s consolidation to the downside against the US Dollar (USD), as GBP/USD revisited levels below the 1.3100 threshold.
The broad-based USD resurgence and increased concerns over the United Kingdom’s (UK) fiscal health emerged as the two main underlying themes during the week, driving the GBP/USD price action.
The Greenback garnered strength from receding interest rate cut bets for the US Federal Reserve (Fed) and worries about AI technology stock overvaluations. However, the former was the main catalyst.
Markets preferred to hold the US currency in the lead-up to the quarterly earnings report from chipmaker giant Nvidia and the first US employment data release, following nearly two months without public data.
As a result, the upside in the pair remained restricted, with a fresh leg lower seen on the release of the UK Consumer Price Index (CPI) for October.
Data published by the Office for National Statistics (ONS) showed on Wednesday that the headline annual CPI increased by 3.6% in October, in line with market expectations and compared to a rise of 3.8% in September.
The UK inflation cooled down for the first time in five months, reviving bets for a rate cut by the Bank of England (BoE) next month. Following the UK CPI report, traders increased BoE easing bets with December cut probabilities rising to 85% versus 80% pre-data release.
The market now sees 63 basis points (bps) of monetary easing by the end of 2026 compared to 59 bps before the inflation report. GBP/USD hit fresh 11-day lows at 1.3038 in the aftermath.
Thereafter, Pound Sterling buyers briefly came up for air in the first half of Thursday’s trading, courtesy of the relief rally on global stocks. Nvidia reported a 65% jump in net income, beating analysts’ estimates and temporarily calming nerves surrounding overvaluation concerns.
However, strong US Nonfarm Payrolls data for September paused the risk rally, as markets believed that higher-than-expected job gains could dissuade the Fed from further monetary policy easing.
The NFP rose by 119,000 in September, following a 4,000 decrease (revised from +22,000) recorded in August. The reading outpaced the market forecast of 50,000. Meanwhile, the Unemployment Rate rose to 4.4% from 4.3% in this same period.
Markets continued to price in about a 40% chance that the Fed will lower rates next month as officials remained cautious about their policy stance due to inflation risks.
The renewed risk-aversion wave, combined with easing Fed rate cut bets, helped the USD hold its ground near ten-month highs against its major currency rivals, halting the pair’s recovery.
Buyers once again tried their luck on Friday but faced headwinds from a bigger-than-expected drop in British retail volume data. Retail Sales fell by 1.1% in October, against expectations of no growth.
Further, the UK S&P Global Preliminary data showed that UK private sector growth eased in November, adding to the downside pressure on the Pound Sterling. The S&P Global Composite Purchasing Managers’ Index (PMI) dropped to 50.5 in November from 52.2 in October. The data came in way below the estimates of 51.8.
The USD held resilient against its peers on Friday and limited GBP/USD’s upside as the S&P Global reported in its preliminary estimate that the Composite Purchasing Managers’ Index (PMI) rose to 54.8 from 54.6 in October. This print highlighted an ongoing expansion in the private sector’s economic activity at a robust pace.
The main event risk of the upcoming week is the British 2025 Autumn Forecast, followed by the Budget speech from Chancellor of the Exchequer Rachel Reeves.
The Budget is highly anticipated after the Financial Times (FT) reported earlier this month that UK Prime Minister Keir Starmer and Reeves scrapped plans to raise income tax rates in a massive U-turn.
According to the Guardian, speculation remains that “the chancellor could extend a freeze on income tax and NI thresholds beyond the planned 2028-29 deadline.”
Next in relevance will be the resumption of the mid- and top-tier economic data releases from the United States (US), the September Producer Price Index (PPI), Retail Sales and Durable Goods Orders data.
Meanwhile, the October Core Personal Consumption Expenditures (PCE) – Price Index figures are also slated for release, alongside the third-quarter Gross Domestic Product (GDP). But there is no official confirmation of these metrics as yet.
Additionally, speeches from the Fed and BoE officials will be closely scrutinized to gauge the path forward on interest rates from these major central banks.
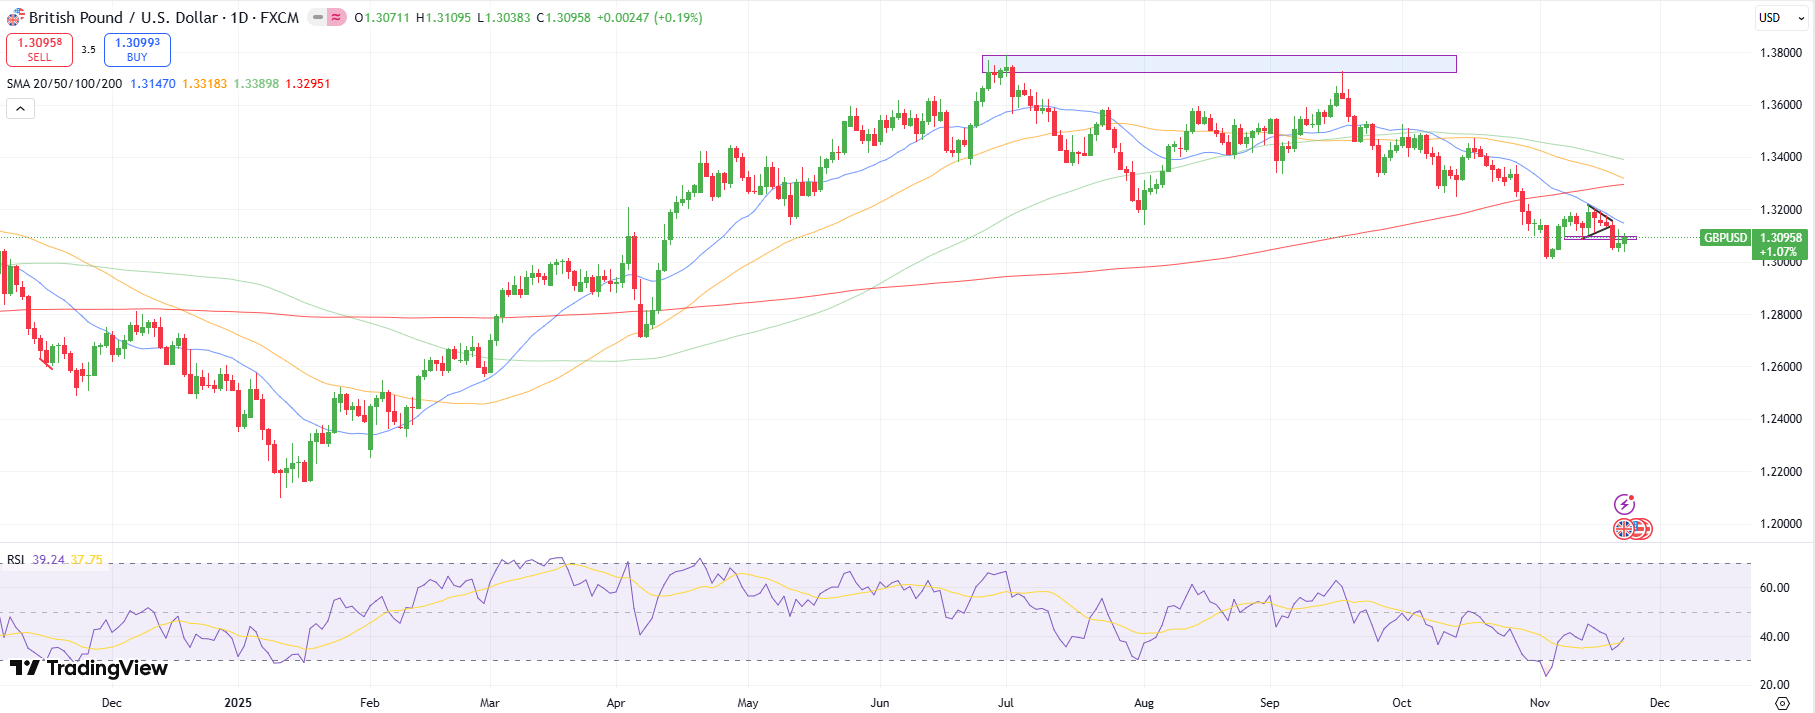
On the daily chart, the 21-day Simple Moving Average (SMA) extends its decline beneath the 50- and 100-day SMAs, and the pair holds under all of them, keeping the short-term outlook bearish. The 50- and 100-day SMAs continue to slide, while the 200-day SMA edges higher, highlighting short-term weakness against a steadier long-term trend. The Relative Strength Index (RSI) stands at 36.55, below the midline and consistent with persistent selling pressure.
Adding credence to the bearish potential, the 50-day SMA is looking to cross the 200-day SMA from above, and if that happens on a daily candlestick closing basis it would confirm a Death Cross.
Immediate resistance aligns with the 21-day SMA at 1.3154. Recovery attempts could face the rising 200-day SMA at 1.3298, with additional caps at the 50-day SMA at 1.3320 and the 100-day SMA at 1.3392. RSI needs to firm toward 50 to suggest fading bearish momentum and allow a more durable bounce. While price trades beneath the descending short- and medium-term averages, the path of least resistance would remain to the downside.
(The technical analysis of this story was written with the help of an AI tool)
The United Kingdom’s Budget, or Financial Statement, is a statement made to the House of Commons by the Chancellor of the Exchequer on the nation’s finances and the Government’s proposals for changes to taxation. The Budget also includes forecasts for the economy by the Office for Budget Responsibility (OBR).
The US dollar has rallied a little bit during the early hours here on Thursday but gave back some of the gains on the 158 yen level. The 158 yen level, of course, is an area that I think continues to be important as it had previously been resistance. Ultimately, though, this is a market that continues to see a little bit of an overextension. I do think at this point in time, if we pull back from here, it is likely that buyers will try to find some type of value.

I would be particularly interested in the 155.50 yen level, as it is an area that we launched from, and there should be a lot of demand. Below there, we have the 154 yen level followed by the 153 yen level. Ultimately, the interest rate differential continues to favor the US dollar, and I think that continues to be the case for quite some time. Ultimately, I just do not see a scenario where things change rapidly, and the fact that you get paid to hang on to this position at the end of every day certainly helps as well.
If we could clear the 159 yen level, this market could really start to take off, but I think we are a little overdone at this point. I am looking for some value. I went ahead and closed my long position for the day. Not because I think this is a bearish market, just because I think we pull back, we try to find a little bit of support, and then we continue the overall uptrend. Longer term, I do not really know where we go, but you could make an argument for 162 yen before it is all said and done.
Want to trade our USD/JPY forex analysis and predictions? Here’s a list of forex brokers in Japan to check out.
Christopher Lewis has been trading Forex and has over 20 years experience in financial markets. Chris has been a regular contributor to Daily Forex since the early days of the site. He writes about Forex for several online publications, including FX Empire, Investing.com, and his own site, aptly named The Trader Guy. Chris favours technical analysis methods to identify his trades and likes to trade equity indices and commodities as well as Forex. He favours a longer-term trading style, and his trades often last for days or weeks.

 Price Forecast: Inside Week Tests 20-Day & 61.8% Support")


")