The main category of Forex News.
You can use the search box below to find what you need.
[wd_asp id=1]
The main category of Forex News.
You can use the search box below to find what you need.
[wd_asp id=1]
Platinum price didn’t change anything due to its fluctuation between the levels of the current sideways track, that are represented by $1605.00, and $1525.00, which represents a key support for reducing the chances of suffering extra losses.
Note that stochastic attempt to provide positive momentum might push the price to form bullish trading, to attempt to renew the pressure on the previously mentioned barrier, to find an exit to record extra gains in the upcoming period, while breaking the support and holding below it will force it to suffer several losses that begin at $1485.00.
The expected trading range for today is between 985.00 and 1040.00
Trend forecast: Bullish
Gold (XAU/USD) is consolidating just above the $4,000 per ounce mark following one of its sharpest corrections of 2025. After hitting an all-time high above $4,356, the metal plunged 8.7% over recent weeks, reaching an intraday low of $3,886 before recovering. The latest weekly close near $4,000.57 marks the third consecutive decline, but also the smallest trading range since mid-September — a sign that selling pressure is fading as markets digest macro and geopolitical shocks. Despite the retracement, gold remains up over 19% year-to-date, supported by relentless central bank buying, fiscal stress in major economies, and the return of the currency devaluation trade, which continues to attract investors seeking shelter from the erosion of fiat value.
Persistent U.S. political paralysis and the 38-day government shutdown have revived safe-haven flows into bullion. The delay of the non-farm payrolls report and broader macro data disruptions have amplified uncertainty, pushing traders to reduce risk exposure in equities and the dollar. The CME FedWatch Tool now prices a 66% probability of a December rate cut, compared to 48% just two weeks earlier. The U.S. Dollar Index (DXY) has retreated to 99.55, down 0.14%, while 10-year Treasury yields eased to 4.09%, both developments supporting gold’s resilience above key support. Traders note that each time the shutdown extends past a month, gold tends to outperform equities by an average of 4.2%, reinforcing its defensive appeal during policy dysfunction.
One of the most powerful forces underpinning the market is central bank accumulation. According to the World Gold Council, sovereign institutions are on track to purchase over 1,000 tons of gold in 2025 — the fourth consecutive year exceeding that threshold. Countries including China, India, Turkey, and Singapore have expanded reserves aggressively to diversify away from the dollar. These purchases are not speculative; they are part of a long-term structural hedge against currency depreciation and sovereign debt expansion. Analysts estimate that Asian central banks alone have absorbed nearly 70% of global gold flows this year. The People’s Bank of China, for example, added 27 tons in October, bringing its total holdings to 2,270 tons, the highest in its modern history.
Strategists such as Stephen Innes of SPI Asset Management emphasize that gold’s long-term bull thesis remains tied to a “slow-burning currency devaluation trade.” With U.S. fiscal deficits projected to surpass $2 trillion in 2026, investors continue rotating out of fiat and into hard assets like gold and Bitcoin. The combination of rising interest costs, surging debt issuance, and a looming wave of Treasury monetization has reignited long-duration inflation hedging. Even if the devaluation trade appears “dormant” in the short term, it remains a dominant theme in macro portfolios. As Peter Spina of GoldSeek.com notes, gold’s pullback could merely be “a calibration phase” before another explosive move — potentially to $5,000 per ounce if inflation expectations remain anchored above the Fed’s target and monetary stimulus resumes globally.
From a technical standpoint, XAU/USD continues to respect the $4,000 psychological threshold, with buyers consistently defending the zone between $3,847 and $3,878, corresponding to the 50-day moving average and 50% retracement of the late-August rally. The latest weekly doji pattern on the chart indicates indecision, signaling that a potential exhaustion low is forming. Momentum, however, remains fragile: the RSI has retreated from overbought levels to 58, and weekly MACD readings show fading bullish momentum. Key resistance lies near $4,080 (median-line) and $4,192, representing the 61.8% retracement of the October decline. A close above $4,192 would confirm a bullish reversal, opening the path toward $4,356 and $4,553, the next Fibonacci extensions. Conversely, a sustained break below $3,847 could target $3,720, the 61.8% retracement of the August–October uptrend — a line technicians identify as the medium-term bullish invalidation level.
Physical market trends are diverging across regions. In India, high volatility and record rupee-adjusted prices have curbed jewelry demand, forcing dealers to offer steep discounts of $30–$40 per ounce against global benchmarks. By contrast, China’s bullion appetite has strengthened following policy shifts that allowed state banks to expand import quotas. The country’s retail gold ETFs recorded net inflows of $1.4 billion in October alone, reversing three months of outflows. Beijing’s planned reform of its rare earth export licensing framework may indirectly boost domestic liquidity, further supporting gold buying among institutional and household investors. The broader Asia-Pacific demand remains robust, especially from emerging markets seeking protection against regional currency instability.
The upcoming Federal Reserve pivot — with markets expecting quantitative easing to resume on December 1, 2025 — could prove decisive for gold’s next major move. The policy shift, driven by slower U.S. growth and the need to fund persistent deficits, will likely weaken the dollar further while reigniting commodity inflation. Gold’s correlation with real yields has reasserted itself: every 10-basis-point decline in the U.S. 10-year TIPS yield historically lifts gold by about $25. With real rates now oscillating near 1.6%, well above post-pandemic averages, the metal retains significant headroom. Meanwhile, the World Bank projects that global government debt-to-GDP ratios will exceed 102% in 2026, reinforcing gold’s role as the ultimate fiscal hedge.
The dollar started strong this week, but couldn’t hold its ground, and that shift is setting up some interesting moves across the majors.
In today’s video, I’ll break down what I’m watching on the DXY, EURUSD, GBPUSD, USDCHF, and XAUUSD — including the key levels I’m eyeing for next week’s setups.
The US dollar started the week with a rally, but buyers struggled to break through the 100.25 resistance, as anticipated.
The 100.25 August high was significant, and the unfinished auction made a sweep and rejection more likely.
Thursday’s session closed below the November open, which flipped to resistance on Friday.
So far, we’re seeing DXY sellers follow through on Thursday’s breakdown, with all eyes on 99.30.
I’ve discussed the two single prints in the 99.30 region since the October 30th rally. Inefficiencies like this are often revisited by markets.
What will be interesting is how the DXY handles the inefficiencies at 99.30, considering the 99.40 support is just above those.
A sweep below 99.40 and into 99.30 could offer some short-term relief, but it would have to be confirmed by buyers. That’s yet to be seen.
Below 99.40 is the 98.40 inefficiency. If traders are looking for a place for the dollar to bounce, that’s it.
Until then, I’ll be looking to sell rallies from the USD.
EURUSD signaled a bullish shift in momentum on Wednesday, as I noted in the VIP Discord group at the time.
That structure break opened the door to the November open at 1.1540 and key resistance at 1.1555.
The EURUSD struggled a bit there on Thursday, but a bullish reclaim seemed likely given the price action.
Fast forward to Friday, and EURUSD is basing above 1.1555. That will be significant going into next week if euro bulls can hold Friday’s rally.
The impulse above 1.1555 opens up the September low at 1.1608. We also have a buy-side single print at 1.1595 that could pull the price higher.
As for longs, I’d need to see a pullback into 1.1540/50 to fill Friday’s sell-side inefficiency and offer a favorable risk-to-reward ratio.
Provided the EURUSD rally holds on Friday, key support next week is at 1.1540/50, with resistance in the 1.1600 region.
 2")
GBPUSD is also reclaiming a significant area on Friday.
The pair fell below its range lows to start the week, but bulls quickly pushed the market back to 1.3140.
We also have the November open at 1.3130, adding to the significance of the area.
I mentioned to VIP members on Thursday that they should anticipate a bullish move on Friday. Immediate retests like this are often early signs of a reversal.
The confirmation is whether GBPUSD bulls can hold Friday’s session convincingly above 1.3140.
Do that, and I like the idea of looking for longs on pullbacks next week.
Several buy-side unfinished auctions could serve as targets this month. Those include 1.3217 and 1.3280, as well as the September low at 1.3324.
Alternatively, if Friday fails to hold above 1.3140, I’ll stand aside next week and wait for more structure.
 3")
USDCHF is rotating lower from its 0.8100 range resistance. The weekly time frame has been incredibly clean for years, and shows this 0.8100 area the best.
Similar to the DXY, we have sellers taking over this week. In the case of USDCHF, the break below 0.8060 shifts the momentum in favor of sellers.
Support comes in at 0.8038. But also like the DXY, I wouldn’t be surprised to see a sweep of 0.8038 and some relief from the 0.8030 region.
However, with the overall structure shifting bearish, rallies could be for shorting.
As for targets, the 0.7950 area is appealing. We have a sell-side single print there and an unfinished auction at 0.7926.
 4")
Gold has been stuck in a tight sideways range since late October. It’s natural for a market to spend time exchanging hands after a liquidity event, such as the one we saw in mid-October.
As mentioned earlier in the week, the $4,030-$4,060 area is the line in the sand. That’s my trigger for a long.
Without a convincing close above $4,060, there isn’t much to do, as that’s required to confirm a bullish shift following the October cascade.
Furthermore, the potential for sell-side liquidity sweeps exists while XAUUSD is below the $4,060 range highs.
For that reason alone, trying to buy gold here is risky and ill-advised.
We’ve had the sell-side liquidity event; now we need buyers to show their hand and shift momentum from neutral to bullish. The $4,060 level is the hinge for that shift in momentum.
If buyers force a break of $4,060, my targets will include $4,150, $4,242, and the $4,300 area.
And if they can’t, I’ll stand aside and wait for a better opportunity.
 5")
The GBP/USD weekly forecast tilts slightly up after paring BOE-led losses on Friday, closing above the 1.3150 level. The move stemmed from the US major data blackout amid a continued government shutdown.
As the Bank of England kept the rates unchanged at 4%, it came along with a readiness, instead of the previous cautiousness, to resume rate cuts from the December meeting. MPC members’ vote revealed a 5-4 split, with the Deputy Governor Sarah Breeden also favoring the majority for a 25 bps rate cut, highlighting the growing concerns about the UK’s sluggish growth and cooling inflation.
–Are you interested in learning more about XRP price prediction? Check our detailed guide-
The BoE also emphasized that the CPI figures have already found a top and is poised for further slowdown. Markets now price in a 70% chance of one December cut and a probability of 50 bps easing in the next year.
On the other hand, the greenback regained renewed strength amid resilient labor data and moderate disinflation. However, the Dollar Index (DXY) reached a six-month high near 100.36 this week before slipping to 99.45 by Friday. Fed’s Jefferson noted that the central bank should gradually proceed with further easing as the policy approaches a neutral rate and should decide further moves based on the upcoming economic data.
According to CNN, Kevin Hassett, the White House economic advisor, noted that the economy is in jeopardy because of the current shutdown, anticipating a contraction of 1-1.5% in GDP growth this quarter. The shutdown has obstructed key data releases, causing limited visibility in the markets, with investors shifting to secondary data sources for near-term market clues.
The UoM Consumer Sentiment revealed that the consumer sentiment slipped to 50.3 from 53.6 in October. Together, these developments weigh on the greenback and limit the dollar’s further upside.


The significant events in the coming week include:
Next week, US inflation data remains the key driver. However, it is important to see whether the data will be released or not. Continued weakness in CPI reading could prompt the Fed to cut further in the December meeting.
The GBP/USD daily chart shows a corrective rebound from 1.3020 up to 1.3180 before closing the week near 1.3150. The price remains well below the 50-, 100-, and 200-day MAs, reflecting sellers’ dominance. Meanwhile, 100- and 200 MAs are looking to form a bearish crossover.
–Are you interested to learn more about low spread forex brokers? Check our detailed guide-
The RSI is near 40, indicating limited upside strength. A sustained move above 1.3180 could extend gains towards 1.3260 and 1.3340. Conversely, a drop below 1.3100 could intensify the selling pressure and trigger a downside towards 1.3000 and 1.2890.
Looking to trade forex now? Invest at eToro!
68% of retail investor accounts lose money when trading CFDs with this provider. You should consider whether you can afford to take the high risk of losing your money.
Today’s projected close above the 10-day average at $3,978 marks the first such occurrence since the line flipped from support to resistance on October 21. This development signals improving short-term demand and raises odds for a continued push toward the 20-day average, currently $4,082 and range-bound over the past week.
The 20-day average has traded sideways recently, making gold’s reaction to it key in the current environment. A rally into $4,082 is expected to encounter selling pressure, potentially triggering a bearish reversal that retests recent lows as support—consistent with the broader consolidation phase.
A drop below Friday’s $3,974 low would flash weakness and target the interim swing low at $3,929. Further downside exposes the recent swing low at $3,886, now increasingly significant with the rising 50-day average at $3,878 converging nearby.
The 50% retracement at $3,846 aligns closely with the 50-day line and $3,886 zone. Watch for a potential undercut-and-run scenario: a brief violation of the prior swing low followed by swift recovery and renewed strength—classic false breakdown behavior.
The 50-day average has not been tested as support since gold reclaimed it in the second half of August, marking the start of the latest rally leg. An eventual pullback to this level remains anticipated and would represent a healthy development for the bull trend, especially after the 20-day already failed as support.
Short-term strengthening via the 10-day close supports a probe toward the $4,082 20-day average, where a bearish response is possible. Failure to hold $3,974 opens the path to $3,929–$3,886, with the 50-day/50% confluence at $3,846–$3,878 as the high-probability bounce zone. A false breakdown there could catalyze the next upside leg; sustained weakness below flips the focus to lower prices.
Gold hovered near $3,998 per ounce, steadying after a volatile week marked by China’s new tax oversight, U.S. silver-tariff discussions, and mounting pressure on the Federal Reserve to clarify its policy stance amid a historic government shutdown. The metal has moved within its tightest range since September, fluctuating only about $100 high-to-low, and sits roughly 8.6% below October’s record high of $4,381 per ounce. This consolidation reflects a tug-of-war between safe-haven demand and a firmer dollar that continues to test investors’ conviction.
Beijing’s newly announced value-added tax reform marked one of the most aggressive structural changes to China’s bullion market in over a decade. The new rule requires banks and gold retailers to link their systems directly to the national tax network, giving authorities real-time visibility over all bullion transactions. The Shanghai Gold Exchange closed the week near ¥919 per gram, unchanged from the prior week, suggesting stability despite tighter regulation. Analysts inside China note that the move formally separates gold’s dual role as a financial asset and consumer product, improving transparency while likely raising costs for jewelry manufacturers and retail buyers. The World Gold Council anticipates this change will temper short-term jewelry sales but strengthen long-term investment flows as households treat gold more like a financial asset.
Across the Pacific, the U.S. Geological Survey added silver to its 2025 “critical minerals” list, setting the stage for potential Section 232 import tariffs under national-security provisions. The move aligns silver with copper and metallurgical coal in Washington’s campaign to secure domestic supply chains. Traders fear that if tariffs materialize, they could distort global bullion trade by redirecting silver flows away from U.S. refiners. Yet, despite the political noise, silver (XAG/USD) held near $48.25 per ounce, about 10.8% below last month’s record peak above $54, while gold (XAU/USD) maintained composure around $3,995.
The narrowing volatility band highlights a temporary equilibrium between bulls and bears. On one side, risk-averse investors continue allocating to gold as the shutdown delays key data releases; on the other, a resilient U.S. dollar and mildly higher Treasury yields cap momentum. The 10-year yield rose slightly to 4.089%, while the Dollar Index (DXY) edged up to 99.81, trimming some speculative positions in the metal. Still, total daily gold volume averaged $67.2 billion, showing strong institutional participation even in a sideways tape.
The macro driver remains the Federal Reserve’s rate-cut trajectory. According to the CME FedWatch Tool, the probability of a December rate cut now stands at 67%, down from 90% earlier in the month, after the Challenger report revealed 153,074 job cuts in October—triple September’s total and the worst October reading since 2003. With official employment data frozen by the shutdown, private reports have become the only guidepost for policymakers. The uncertainty around inflation and labor conditions amplifies gold’s appeal as a non-yielding hedge against both monetary missteps and macro stagnation.
Spot gold (XAU/USD) trades comfortably above its 50-day moving average of $3,878.37, preserving a short-term bullish bias. Primary support sits at $3,928.68 and $3,886.46, while the broader floor remains the $3,846.50 pivot. A breakout above $4,046.60 would open the door to the next resistance band at $4,133.95–$4,192.36, an area of dense option open interest and prior selling pressure. Conversely, a decisive close below $3,846 would negate the uptrend and trigger momentum-based liquidation toward $3,750.
The prolonged U.S. government shutdown, now the longest in modern history, has paralyzed federal data collection, leaving traders without official benchmarks. This “information blackout” reinforces gold’s role as a crisis proxy, especially with market chatter of stagflation returning to the fore. Inflation remains sticky even as output slows, and with the Fed’s real policy rate near neutral, the metal benefits from diminishing real yields. Chicago Fed President Austan Goolsbee remarked that the lack of data “accentuates the need to move cautiously,” effectively signaling a pause. Investors have translated that caution into renewed allocation toward tangible assets.
Gold’s stability near $4,000 per ounce continues to deliver record cash flow for producers. Perseus Mining Ltd. reported $837 million in cash and bullion with zero debt as of September 2025, ensuring flexibility to hedge at favorable levels. The company’s management maintains downside protection via put options, securing margins even if prices dip toward $3,000.
Integra Resources Corp., operating the Florida Canyon heap-leach mine, guides 70,000–75,000 ounces for 2025 and channels proceeds to its DeLamar Project, now entering feasibility. Its long-term plan values production at a conservative $2,175/oz assumption, rendering the current market near $4,000 almost double its base case.
Cabral Gold Ltd. advances construction in Brazil’s Cuiú Cuiú District, targeting 25,000 ounces annually at an AISC of $1,210/oz. At today’s prices, that translates to nearly $3,000 profit per ounce or $70 million annual free cash flow on just $37.7 million in initial capex—a margin profile unmatched in the junior space.
Meanwhile, U.S. Gold Corp. progresses its CK Gold Project, fully permitted and designed for a gold-to-copper revenue split of roughly 80/20. Its February 2025 PFS estimated AISC at $937/oz, positioning it as one of North America’s most efficient upcoming mines.
A stronger dollar pressures global miners that report in local currencies but can also generate offsetting benefits. Serabi Gold and Cabral Gold in Brazil benefit from a weaker real, which boosts local-currency revenue while tempering input inflation. Serabi expects 44,000–47,000 ounces in 2025 with steady margins, citing favorable FX trends. Chief Executive Mike Hodgson** noted that “the combination of high gold prices and real-to-dollar dynamics has created an economic tailwind for Brazilian operations.”
North American newcomers are leveraging existing infrastructure to scale efficiently. i-80 Gold Corp. in Nevada, now transitioning from developer to mid-tier producer, recorded 8,400 ounces sold in Q2 2025 at an average realized price of $3,301, generating $28 million in revenue. As it refurbishes the Lone Tree Autoclave, expected online by 2028, recovery rates could rise from 55–60% to 92%, nearly doubling operating leverage. In Ontario, West Red Lake Gold Mines successfully restarted the Madsen Mine, producing 12,800 ounces in Q1-Q3 2025 with ambitions to exceed 100,000 ounces by 2029.
The March 2025 Executive Order on mineral independence has accelerated permitting in the U.S., reducing project timelines for Nevada-based developers. This domestic push may offset global trade disruptions caused by China’s tax reform or potential silver tariffs. The synergy between policy and commodity demand underpins a long-term bullish structure for gold: while tariffs might distort short-term pricing, they indirectly validate bullion’s strategic value as a secure asset class.
Broader precious metals mirrored gold’s consolidation. Platinum (XPT/USD) fell 2% to $1,557/oz, palladium (XPD/USD) slid 4.6% below $1,400/oz, and silver (XAG/USD) stabilized near $48.25/oz. Liquidity shortages in London’s white-metal markets have widened spreads, but the relative strength of gold underscores its dominance as the default store of value.
On the chart, momentum indicators suggest accumulation near current levels. The Relative Strength Index holds near 54, neutral but tilting positive, while stochastic oscillators remain above oversold territory. Open interest in COMEX gold futures has risen 5% week-on-week, implying fresh long exposure rather than liquidation. Options skews show growing demand for upside strikes around $4,100–$4,200, indicating traders still expect an eventual breakout once the Fed path clarifies.
Institutional flows show rotation rather than exit. Gold ETFs saw modest inflows this week after two consecutive weeks of redemptions, hinting that large investors view the sub-$4,000 region as an attractive accumulation zone. With the Dollar Index capped below 100 and real yields near 1.7%, the opportunity cost of holding gold remains historically moderate. The key narrative has shifted from inflation hedge to policy-risk hedge—gold now functions as insurance against data opacity, fiscal uncertainty, and political intervention.
The structure of XAU/USD remains robust. Prices above $3,878 preserve the bullish bias, and safe-haven flows continue amid policy paralysis. With supply from key mining regions steady, and demand from central banks and ETFs stabilizing, the market appears positioned for another upward leg once macro clarity returns.
Verdict: BUY / BULLISH — The data justifies a Buy stance on Gold (XAU/USD). The confluence of tightening U.S. labor conditions, rate-cut repricing, and structural geopolitical risk reinforces the case for holding and expanding gold exposure. Short-term consolidation between $3,920–$4,050 is likely, but a confirmed breakout above $4,046.60 targets $4,192–$4,250, while downside risk remains cushioned above $3,846.
For the second consecutive session, the 78.6% Fibonacci retracement at $4.41 has capped upside, just shy of the 161.8% projected target of the rising ABCD pattern at $4.45. This creates a defined $4.41–$4.45 resistance band. The extended top channel line runs straight through the heart of the current four-day consolidation range as well, adding another indicator showing of overhead supply.
The intraday reversal today strongly favors an inside day close heading into next week, fully contained within a developing four-day topping pattern. A drop below Friday’s $4.27 low would flash immediate weakness, but a bearish reversal only confirms on a decisive break beneath the four-day range support at $4.18.
Natural gas continues to demonstrate resilience near the highs while repeatedly challenging resistance, reflecting sustained buyer interest. This dynamic raises the possibility that one more push higher could materialize before any pullback unfolds. And when correction does arrive, it may remain shallow and short-lived. This is not a prediction, merely a scenario to keep in view.
Strength reasserts on any rally above the $4.42 trend high established Friday, with the $4.45 ABCD completion as the immediate next objective. A clean, decisive advance through $4.45 would signal the rising trend retains momentum and may have additional upside legs ahead.
First dynamic support arrives at the 10-day moving average, currently $4.01 and rising. Just below sits the 38.2% Fibonacci retracement at $3.94, converging with the original rising channel top line—previously resistance and now an untested potential support zone following the recent breakout above it.
The $4.41–$4.45 resistance zone holds the near-term key. Persistent failure here likely forces a deeper test of support the four-day range toward $4.18, with $4.01–$3.94 as the follow-on support cluster. A breakout above $4.45, however, validates continuation within the broader channel and opens higher targets. The inside day resolution may provide the next critical directional signal.
– Written by
Ben Hughes
STORY LINK Euro to Dollar Forecast: EUR/USD Nears 1.16 on US Job Market Worries
The Euro to Dollar (EUR/USD) exchange rate rebounded strongly above 1.15 after disappointing US jobs figures triggered renewed selling in the dollar.
ING analysts suggest a key low may have formed near 1.1470, though analysts warn that confirmation will depend on further clarity over the US labour market.
The Euro moved back above the 1.1500 level against the Dollar after weak US jobs data on Thursday and made further headway on Friday with 1-week highs close to 1.1560.
According to ING; “There is a chance that EUR/USD may have established an important low at 1.1470 this week. But for a rally to unfold, we will probably need to get more clarity on the slowing US jobs market. Let’s see whether intra-day support at 1.1500/1510 can now hold.”
UOB commented; “the EUR’s weakness from a week ago has stabilised, and we expect EUR to trade in a range of 1.1485/1.1610 for the time being.
Challenger reported that layoffs in October surged 175% from a year ago to 153,074, the highest October figure for 20 years. For the first 10 months of the year, layoffs increased 65% to near 1.1mn.
Get better rates and lower fees on your next international money transfer.
Compare TorFX with top UK banks in seconds and see how much you could save.
ING noted the weak data, but added; “with the US government shutdown ongoing, we are still in the dark about the true labour market picture.”
Jeffries economist Mohit Kumar noted the scarcity of data; “With the December Fed meeting more or less a coin toss which crucially depends on the labour market picture, the market is overreacting to any hints about the labour market.”
Markets are pricing in just over a 65% chance of a further Fed rate cut at the December meeting.
MUFG noted the impact of uncertainty; “The Fed has indicated that it would prefer to leave rates on hold in December if they are unable to gain more clarity on the health of the US economy and labour market by then.”
The US government shutdown has still not been resolved.
MUFG added; “The timing of when the record government shutdown comes to an end remains important for US dollar performance.”
The US currency will be vulnerable if there is convincing evidence of a weaker labour market.

The Euro could still face challenges surrounding the global economy with markets also digesting the outlook for US tariffs.
ING commented; “While we like the idea of a weaker dollar and a stronger EUR/USD, last night’s Chinese trade data is unwelcome news. It suggests China might not have as easily diversified its exports away from the US as first thought – or at least the ex-US demand is insufficient to offset the loss of the US market. That will only add to fears of increasing Chinese pressure in European markets.”
International Money Transfer? Ask our resident FX expert a money transfer question or try John’s new, free, no-obligation personal service! ,where he helps every step of the way,
ensuring you get the best exchange rates on your currency requirements.
TAGS: Euro Dollar Forecasts
Unicredit Tower A, Milan © Sergio Fabio Brivio, Flickr
The market is underestimating how far and fast the Bank of England will cut interest rates, which will weigh materially on the pound to euro exchange rate, says a leading global investment bank.
“We see more and faster rate cuts than markets,” says Daniel Vernazza, Chief International Economist at UniCredit in London.
The market is currently anticipating two more reductions in Bank Rate during this cycle, taking it to 3.5%.
This expectation was reinforced by Thursday’s decision to leave interest rates unchanged at 4.0% but signal in clear terms that another cut was imminent. Most economists think the tone adopted by the Bank points to a cut at December’s meeting.
However, UniCredit expects the labour market to continue to weaken and consumption growth to remain soft, reinforced by the likely material tightening of fiscal policy in the upcoming Autumn Budget.
The government looks all but set to raise the basic rate of income tax for the first time since the 1970s, which economists say will squeeze the economy and pressure inflation.
“Inflation should move down to 2% next year. In this environment, we expect the MPC to cut rates in December, followed by a quarterly pace of rate cuts next year to 2.75%,” says Vernazza.
The Bank of England’s November Monetary Policy Report revealed forecasts showing it expects inflation to fall back to the 2.0% target much later, in late 2027.
The Bank’s latest forecasts also show it is modelling the economic outlook on the market’s assumption that Bank Rate will fall to a terminal rate at 3.5% next year.
Foreign exchange markets are responsive to interest rate expectations, meaning the pound would decline in the event that the market adjusts to UniCredit’s thinking on inflation and the more aggressive path of cuts that the Bank of England would respond with.
If the Milan-based lender is correct, a significant repricing in market interest rate expectations awaits, which will drag materially on the pound.
Given this, UniCredit holds a pound to euro forecast of 1.11, which is well below the consensus of predictions made by its peer investment banks.
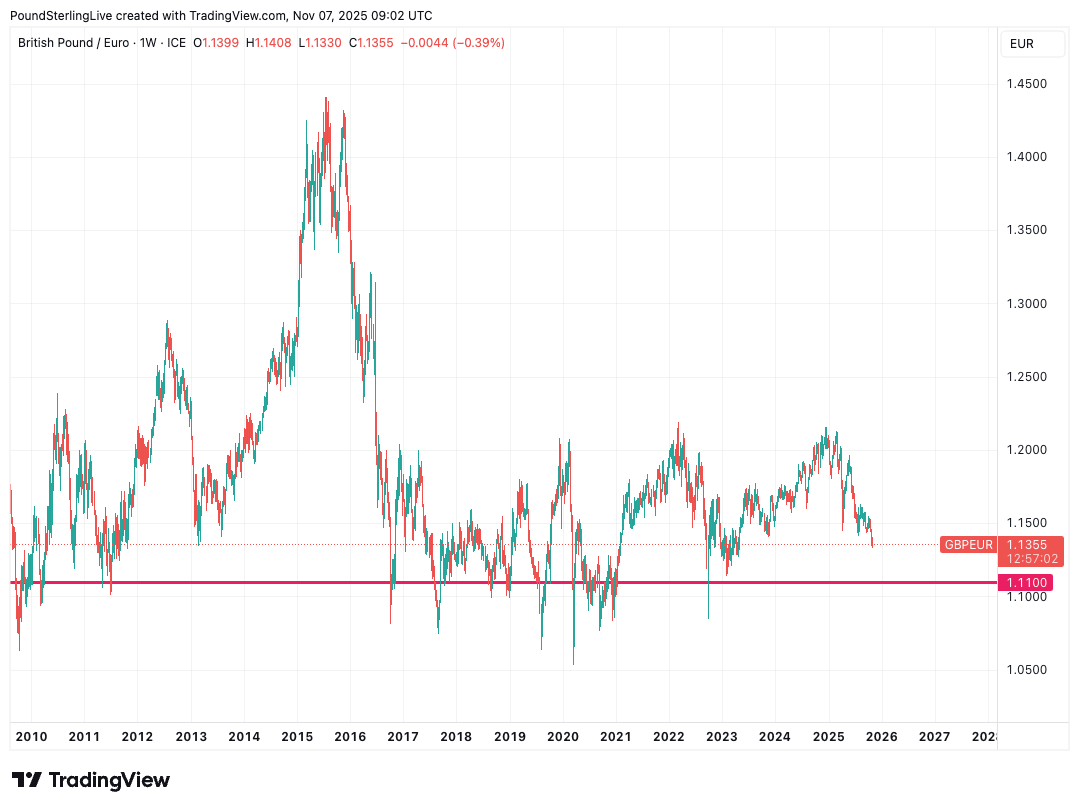
Above: 1.11 is the bottom of a long-term range for GBP/EUR.
The Pound Sterling (GBP) extended its downtrend and reached seven-month lows near 1.3000 against the US Dollar (USD), before GBP/USD buyers quickly jumped in and recovered some ground.
Safe-haven flows returned with a bang and acted as a strong headwind to the risk-sensitive Pound Sterling while boosting the US Dollar to its highest in five months against its six major currency rivals.
“Sell everything” theme gripped the market as traders witnessed a wave of exhaustion following the Artificial Intelligence (AI) driven record rally in global stocks. US tech stocks tumbled, drowning the major indices, with investors selling Gold to cover their losses in equity markets.
Investors grew concerned over inflated technology stock valuations, particularly in the artificial intelligence (AI) space, fuelling the long-due correction in global indices.
That being said, the USD also found fresh support from reduced expectations that the US Federal Reserve (Fed) will deliver another interest rate cut in December. The December Fed rate cut bets were slashed after strong US private sector employment and services activity data.
Data published by the ADP showed that US private payrolls increased by 42,000 jobs in October, exceeding expectations of a 25,000 gain, while the ISM Services PMI increased more than expected to 52.4 last month due to a solid jump in New Orders.
This broad USD strength smashed the GBP/USD pair to challenge the 1.3000 psychological level before it staged a decent comeback in the latter part of the week.
Cable’s turnaround was mainly driven by a sharp pullback in the USD across the board and US Treasury bond yields, following Thursday’s private labor data and resurfacing concerns over a protracted government shutdown.
The executive outplacement firm Challenger, Gray & Christmas said on Thursday that corporations announced a 183.1% monthly surge in layoffs, the worst October in over two decades, per Reuters.
The latest jobs data refuelled concerns about the weakening US labor market conditions, slightly boosting the odds of the Fed rate cut next month to 69% versus a drop to 62% seen after the release of the US ADP Employment Change data.
The recovery in GBP/USD was unfazed by the Bank of England’s (BoE) dovish hold decision. The members of the BoE Monetary Policy Committee (MPC) voted 5-4 to maintain the key Bank Rate at 4%, in a narrower than expected split.
The BOE underscored that future rate cuts will depend on the evolution of the outlook for inflation. “If progress on disinflation continues, Bank Rate is likely to continue on a gradual downward path,” the Monetary Policy Statement (MPS) said.
Heading into the weekend, the USD came under renewed selling pressure and helped GBP/USD stretch higher. The monthly report published by the University of Michigan (UoM) showed that the Consumer Sentiment Index dropped to 50.3 in November from 53.6 in October.
Amid a holiday-shortened week, the data drought from the United States (US) will likely continue as no end in sight to the government shutdown.
The longest shutdown in American history will put the focus back on some private-sector statistics and speeches from Fed officials. In case the government funding is restored, the delayed US Nonfarm Payrolls and Jobless Claims will be eagerly awaited.
The US Consumer Price Index (CPI), Producer Price Index (PPI) and Retail Sales reports for October will also be in focus.
From the United Kingdom’s (UK) economic calendar, the employment data on Tuesday will offer some incentives to Pound Sterling traders.
On Wednesday, BoE Chief Economist Huw Pill is due to speak in a panel discussion titled “An assessment of the BoE’s reaction to Covid-19” at the Institute of International Monetary Research Conference hosted by the University of Buckingham.
Thursday will feature the monthly and preliminary reading of the British third-quarter Gross Domestic Product (GDP) data alongside the industrial figures.
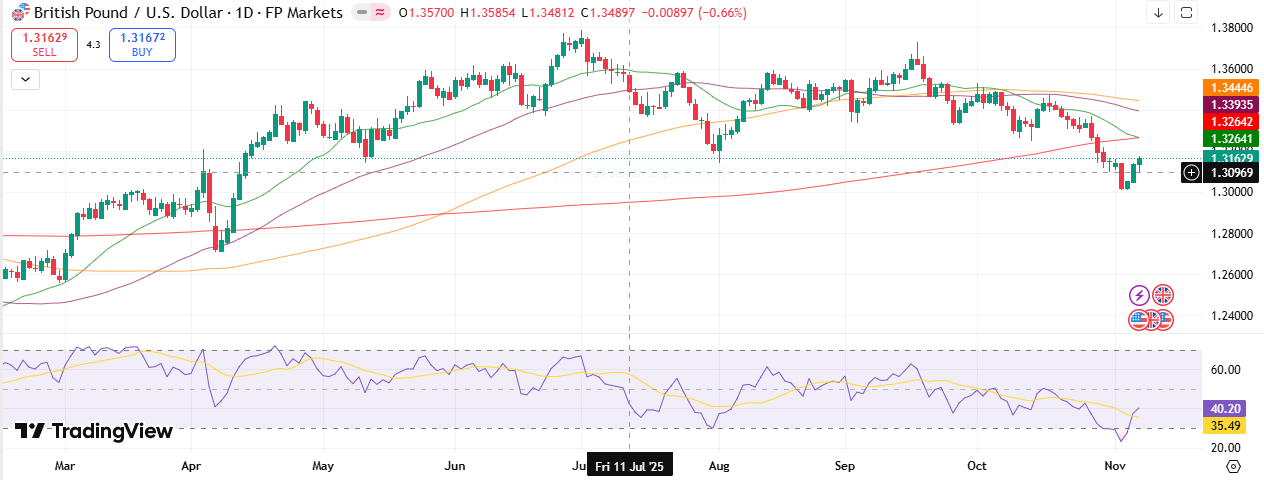
As observed on the daily chart, GBP/USD is struggling at the previous strong support-turned-resistance at 1.3142 on the road to recovery.
The 14-day Relative Strength Index (RSI) has turned lower while below the midline, currently near 36, suggesting that more downside remains on the cards.
Adding credence to the bearish potential, the 21-day Simple Moving Average (SMA) is looking to close the week below the 200-day SMA, which will confirm a Bear Cross if that happens.
These technical indicators point to more pain for the GBP/USD pair heading into a new week.
If the abovementioned resistance is scaled decisively, powerful resistance will then align around the 1.3265 region, where the Aug 4 low, the 21-day and 200-day SMA close in.
A sustained move above that zone will unleash additional recovery toward the 50-day SMA barrier at 1.3393.
Conversely, if the downside regains momentum, a test of the multi-month troughs at 1.3010 will be inevitable.
Selling pressure will intensify below the latter, opening the door toward the April 11 low of 1.2967.
The last line of defense for Pound Sterling buyers is seen at the 1.2850 psychological level.
The Gross Domestic Product (GDP), released by the Office for National Statistics on a monthly and quarterly basis, is a measure of the total value of all goods and services produced in the UK during a given period. The GDP is considered as the main measure of UK economic activity. The QoQ reading compares economic activity in the reference quarter to the previous quarter. Generally, a rise in this indicator is bullish for the Pound Sterling (GBP), while a low reading is seen as bearish.


 Price Forecast: Closes Above 10-Day MA – First Since October 20")

