The main category of Forex News.
You can use the search box below to find what you need.
[wd_asp id=1]
The main category of Forex News.
You can use the search box below to find what you need.
[wd_asp id=1]

Obviously, that’s a longer-term call, but for me, that is a longer-term buy-and-hold setup just waiting to happen. You get paid to hang on to the trade between now and then, which always helps. That means you can pad your trade a little bit. Also, keep in mind that the 50-day EMA is racing to reach the 149 yen level, which is right around where we bounced from earlier in the session.
The Japanese yen has a host of issues working against it, not the least of which will be the fact that the Bank of Japan cannot tighten rates much, if at all. With the debt load in Japan, they probably have reached about as tight as they can get. If that is in fact going to be the case, and of course, the reaction to the recent election is the correct one, where Japan should become a loose monetary state anyway, then this is a pair that should continue to take off to the upside.
The US dollar has been very stubborn against multiple currencies around the world, so the Japanese yen won’t be any different. This is a pair that I have been buying since somewhere around 143 yen. It’s been a little bit of a rocky road on the way up, but I’ve been getting paid every day to hang on to it. Therefore, it allows me to stick with the trade longer. I think we have the next leg up just waiting to happen here. That being said, I remain bullish.
Want to trade our USD/JPY forex analysis and predictions? Here’s a list of forex brokers in Japan to check out.
Christopher Lewis has been trading Forex and has over 20 years experience in financial markets. Chris has been a regular contributor to Daily Forex since the early days of the site. He writes about Forex for several online publications, including FX Empire, Investing.com, and his own site, aptly named The Trader Guy. Chris favours technical analysis methods to identify his trades and likes to trade equity indices and commodities as well as Forex. He favours a longer-term trading style, and his trades often last for days or weeks.
Gold (XAU/USD) is trading around $4,230 per ounce, regaining traction after one of the most volatile weeks in modern market history. Following a record surge to $4,380, the precious metal suffered a dramatic reversal that erased nearly $1 trillion in market value within hours. The sharp correction, driven by a temporary strengthening of the U.S. dollar and recalibration of safe-haven flows, triggered widespread profit-taking but failed to alter the long-term structural uptrend. Even as short-term technical exhaustion took hold, gold’s dominant macro pillars—central bank accumulation, geopolitical tension, and weakening global yields—remain firmly intact.
The 2025 rally in gold stands as one of the most powerful in decades, with the metal up 54% year-to-date, the highest annual return since 1979. The rally has been fueled primarily by unprecedented central bank purchases, led by China and India, as part of an ongoing de-dollarization strategy. These strategic flows have redefined gold’s market structure, lifting physical demand to record highs and tightening supply. According to INVERCO data, European gold investment funds saw returns exceeding 100% this year, ranking among the top-performing assets globally. In parallel, global exchange-traded funds (ETFs) linked to gold reported surging inflows amid investor demand for protection against U.S. debt concerns and monetary policy uncertainty.
Gold’s breakout through $4,000 marked its ninth consecutive weekly advance—the longest streak since August 2020—driven by persistent geopolitical risk and expectations of near-term rate cuts by the Federal Reserve. The move to $4,380 represented the largest single-week trading range on record, with volatility levels not seen since the 2008 crisis. Technical readings signaled extreme overextension as momentum reached levels comparable only to April 2006. Analysts warned of “exhaustion risk” as bulls pushed into resistance zones between $4,084–$4,113, with upper projections stretching toward $4,583. Short-term traders began locking in gains, prompting a retracement to $4,200—a natural pause in a structurally bullish cycle rather than the onset of a reversal.
The epicenter of gold’s latest surge lies in Japan, where trading volume in spot gold soared by 300%, marking one of the largest single-country increases in history. The spike reflects both investor anxiety and strategic hedging, as Japanese institutions seek insulation from currency depreciation and regional instability. The surge in yen-based gold contracts has positioned Japan as a major price driver in the global market, amplifying liquidity and contributing to the intraday volatility seen in recent sessions. Analysts note that the increase is not purely speculative—large pension and insurance funds are actively expanding allocations as part of long-term diversification away from negative real yields.
The gold market’s sharp selloff coincided with an extraordinary liquidity migration toward digital assets, most notably Bitcoin (BTC-USD), which surged above $106,000 as gold corrected. Over $1 trillion was withdrawn from gold positions, temporarily weighing on prices but revealing an important cross-asset relationship: investors are not abandoning gold, but reallocating between tangible and digital safe-havens. The correlation between BTC and gold flipped negative in October, with institutional traders exploiting arbitrage between both markets. The short-term shift has raised speculation that Bitcoin is increasingly viewed as a high-beta hedge alongside gold rather than a competing asset. However, institutional sources confirm that large funds, including BlackRock (NYSE:BLK), maintain significant physical gold exposure as a stabilizer against digital volatility.
Friday’s pullback was exacerbated by a modest rebound in the U.S. Dollar Index (DXY), which climbed 0.1%, making dollar-denominated gold temporarily more expensive for foreign buyers. Meanwhile, comments from former U.S. President Donald Trump, signaling a softer stance on China tariffs, dampened immediate demand for defensive assets. U.S. gold futures for December delivery closed at $4,213.30, down 2.1% on the session. Still, markets continue to price in two 25-basis-point rate cuts by the Federal Reserve—one in October and another in December—creating a favorable backdrop for non-yielding assets like gold. With the next FOMC meeting scheduled for October 29, traders are recalibrating exposure around inflation data and real yield trends, both of which remain supportive of continued gold strength through year-end.
Physical demand across Asia remains robust. In India, festival season has pushed gold premiums to decade highs, while Chinese retail demand continues to accelerate amid local equity market weakness. Combined Asian consumption is expected to exceed 1,300 tons in 2025, the highest level since 2011. These flows are reinforcing the physical floor around $3,850–$3,900, limiting downside risk. The Shanghai Gold Exchange reported record withdrawals of 321 tons in September alone, underscoring how retail and institutional appetite remains firm even as speculative Western flows unwind. This divergence between physical and paper markets supports the thesis that gold corrections are transitory within an ongoing super-cycle.
Across Europe, mutual and pension funds have recorded one of their strongest performances in recent history. Data from INVERCO show that equity funds in Spain gained 31.66% in the first nine months of the year, yet defensive strategies like gold outperformed by a wide margin. At Generali Investments, strategists warned that risk assets are moving into narrow valuation ranges, but gold remains justified as a strategic hedge amid record-low euro credit spreads. Deutsche Bank’s CIO, Christian Nolting, maintains a cautiously optimistic tone, highlighting “temporary setbacks” but reaffirming that gold’s long-term trajectory remains underpinned by structural imbalance between supply and demand. Meanwhile, U.S. ETFs continue to attract inflows as Treasury yields stabilize near 4%, signaling investor confidence in gold as a medium-term store of value.
From a technical standpoint, XAU/USD faces immediate resistance between $4,084–$4,113, representing the upper bounds of the recent breakout channel. A weekly close above $4,308 would confirm renewed bullish momentum toward $4,583–$4,592, with extreme targets at $4,753. On the downside, support is firmly anchored near $3,859, coinciding with the monthly open, while $3,782 marks the 61.8% Fibonacci retracement of the May advance. A break below that would suggest deeper correction potential toward $3,666, though such a scenario remains improbable given the underlying macro tailwinds. Volatility indicators remain historically elevated, with the average weekly range exceeding $300, emphasizing the need for disciplined position sizing.
Persistent fiscal instability and geopolitical escalation continue to drive the safety premium embedded in gold’s valuation. The ongoing U.S. government shutdown debate and rising debt service costs have eroded confidence in the dollar’s long-term stability, pushing sovereign funds to diversify reserves. Simultaneously, conflicts across the Middle East and Eastern Europe have elevated gold’s geopolitical hedge function, with risk premiums adding an estimated $250–$300 to current spot prices. Analysts at Vontobel emphasize that these structural factors—ranging from fiscal deficit expansion to central bank balance-sheet constraints—create an environment where gold remains systematically favored over fiat currencies.
Despite record highs, the rally in gold coincides with booming equity markets, underscoring investor polarization. The S&P 500 (SPX) trades near 6,664, and the Nasdaq (NDX) at 22,680, suggesting that both risk-on and risk-off assets are advancing simultaneously. This “wall of worry” dynamic reflects liquidity-driven exuberance amid expectations of 2026 fiscal stimulus and AI-led productivity growth. Yet, historical data show that periods when gold and equities rise together often precede macro rebalancing phases. For diversified investors, this alignment strengthens the case for gold as both a hedge and a performance enhancer within multi-asset portfolios.
Global mine output has struggled to keep pace with investment demand. Production growth remains capped below 1.5% annually, while recycling flows are down nearly 18% year-over-year. Meanwhile, central bank holdings have reached 37,000 tons, a post–Bretton Woods record. Nations such as China, Turkey, and India continue to accumulate reserves as a direct counterbalance to U.S. Treasury exposure. With real yields hovering near zero and global inflation expectations edging higher, gold’s opportunity cost remains minimal. The interplay between constrained supply and consistent demand supports a sustained upward trajectory into 2026.
Gold’s sharp pullback from record highs represents a technical breather, not a structural reversal. The combination of central bank accumulation, Asian physical demand, and macro uncertainty continues to underpin a bullish thesis for XAU/USD. As long as prices hold above $3,850, the risk-reward dynamic remains favorable for long positioning. Upside targets stretch toward $4,500, with potential extension to $4,750 under sustained dollar weakness and further rate cuts. In a world of fragile fiscal stability and geopolitical unpredictability, gold remains the most credible global hedge. Trading stance: BUY — structural bull trend intact.
West Texas Intermediate (WTI) Oil price falls on Friday, early in the European session. WTI trades at $56.79 per barrel, down from Thursday’s close at $56.94.
Brent Oil Exchange Rate (Brent crude) is also shedding ground, trading at $60.68 after its previous daily close at $60.86.
WTI Oil is a type of Crude Oil sold on international markets. The WTI stands for West Texas Intermediate, one of three major types including Brent and Dubai Crude. WTI is also referred to as “light” and “sweet” because of its relatively low gravity and sulfur content respectively. It is considered a high quality Oil that is easily refined. It is sourced in the United States and distributed via the Cushing hub, which is considered “The Pipeline Crossroads of the World”. It is a benchmark for the Oil market and WTI price is frequently quoted in the media.
Like all assets, supply and demand are the key drivers of WTI Oil price. As such, global growth can be a driver of increased demand and vice versa for weak global growth. Political instability, wars, and sanctions can disrupt supply and impact prices. The decisions of OPEC, a group of major Oil-producing countries, is another key driver of price. The value of the US Dollar influences the price of WTI Crude Oil, since Oil is predominantly traded in US Dollars, thus a weaker US Dollar can make Oil more affordable and vice versa.
The weekly Oil inventory reports published by the American Petroleum Institute (API) and the Energy Information Agency (EIA) impact the price of WTI Oil. Changes in inventories reflect fluctuating supply and demand. If the data shows a drop in inventories it can indicate increased demand, pushing up Oil price. Higher inventories can reflect increased supply, pushing down prices. API’s report is published every Tuesday and EIA’s the day after. Their results are usually similar, falling within 1% of each other 75% of the time. The EIA data is considered more reliable, since it is a government agency.
OPEC (Organization of the Petroleum Exporting Countries) is a group of 12 Oil-producing nations who collectively decide production quotas for member countries at twice-yearly meetings. Their decisions often impact WTI Oil prices. When OPEC decides to lower quotas, it can tighten supply, pushing up Oil prices. When OPEC increases production, it has the opposite effect. OPEC+ refers to an expanded group that includes ten extra non-OPEC members, the most notable of which is Russia.
Friday’s reversal wasn’t purely technical. A firmer U.S. dollar and shifting geopolitical signals weighed on sentiment. The U.S. Dollar Index edged up 0.1%, applying pressure to dollar-denominated gold by making it more expensive for international buyers. Meanwhile, U.S. gold futures for December delivery settled 2.1% lower at $4213.30.
Gold had been on track for its biggest weekly gain since September 2008, fueled by safe-haven demand. But market tone shifted after former President Donald Trump walked back comments about full-scale tariffs on China, confirming plans for a meeting with his Chinese counterpart. “Trump’s more conciliatory tone… has taken a little heat out of the precious trade,” said independent metals trader Tai Wong.
Despite Friday’s selloff, broader market fundamentals remain supportive over the longer term. Gold is still up over 64% year-to-date, driven by central bank purchases, strong ETF inflows, a weakening dollar, and persistent geopolitical risk. Markets are pricing in a 25 basis point Fed cut in both October and December — a clear tailwind for non-yielding assets like gold.
On the physical side, demand in Asia remains resilient, with Indian premiums hitting decade highs ahead of festival season. That demand base could offer price support even in a near-term pullback.
In the short term, gold looks vulnerable to a technical correction. The confirmation of Friday’s reversal top could trigger a test of $4162.71 and potentially $3944.43. A decisive break below the latter would shift focus toward the 50-day moving average at $3675.27.
Until bulls reclaim control above $4380.99, the near-term bias is bearish. However, rate cut expectations and strong structural demand continue to underpin a bullish long-term outlook.
Gold (XAU/USD) is hovering around $4,250 per ounce, retreating from last week’s record peak at $4,378.69 as traders balance safe-haven demand with growing signs of speculative excess. The metal, up more than 58% year-on-year and nearly 17% this month, remains the standout performer in global markets, outpacing equities, cryptocurrencies, and commodities. Yet the surge has entered a more volatile phase as Treasury yields rebound, the U.S. dollar steadies, and profit-taking emerges after the largest monthly gain since the 2008 financial crisis.
After touching its intraday high above $4,370, gold reversed sharply to $4,220, marking a 2.2% swing that highlights exhaustion among short-term buyers. The RSI, which surged to 82 last week, has now cooled toward 68 — still elevated but signaling an early correction. Key support stands at $4,180, followed by $4,050, where institutional flows re-entered during the previous pullback. Resistance remains at $4,300, with a breakout above that zone potentially reigniting the rally toward $4,500. Market data show ETF inflows of over $34 billion in the past ten weeks, confirming that gold’s rise is not purely retail-driven but also fueled by institutional hedging against debt and currency debasement.
Volatility in U.S. Treasury yields continues to dominate gold’s short-term direction. The 10-year yield briefly climbed toward 4.72% before easing to 4.58%, reflecting mixed expectations over the Federal Reserve’s upcoming policy meeting. Traders now price in a 25-basis-point cut in October and a second reduction by December, a sharp pivot from the hawkish stance earlier this year. Lower yields typically support non-yielding assets like gold, but the speed of the rate repricing has injected uncertainty. The Fed’s shift toward prioritizing employment over inflation, the so-called “Powell pivot,” has weakened the dollar but raised questions about the sustainability of real yields.
That tension has created an unusual correlation: both speculative growth equities and gold have rallied in tandem, reflecting investor preference for liquidity over valuation. Yet as the Fed signals further easing, the risk of yield-driven volatility in the gold market remains elevated. For institutional desks, the trade has evolved from a simple inflation hedge into a macro positioning tool for monetary instability.
Global central bank purchases remain one of the most powerful undercurrents supporting gold’s strength. According to the World Gold Council, official sector buying exceeded 1,100 metric tons this year — the second-highest annual pace on record. The People’s Bank of China continues to expand reserves for an eleventh consecutive month, while India, Poland, and Turkey have also increased holdings amid concerns about dollar weaponization and U.S. fiscal risk. Analysts estimate that sovereign accumulation now represents over 25% of total demand, up from just 12% in 2018.
The “debasement trade,” as dubbed by institutional strategists, rests on the expectation that heavily indebted governments will eventually favor inflation over austerity. With U.S. federal debt surpassing $35 trillion and real interest rates turning negative on long maturities, gold’s appeal as a non-sovereign reserve asset has never been stronger. As UBS noted, the metal’s low correlation with equities and bonds, particularly during macro shocks, has re-established its role as the anchor of institutional portfolios rather than a mere defensive instrument.
The rally’s magnitude has reignited debate over whether gold has entered a speculative bubble. Goldman Sachs, HSBC, and Bank of America all revised forecasts within weeks as prices surpassed earlier targets. Goldman lifted its 2025 forecast to $4,900, HSBC sees $5,000 by early 2026, and Bank of America projects an extension to $6,000 amid accelerating inflows into physical ETFs and central-bank-backed vaults. In the past ten weeks alone, the ratio of upside to downside trading sessions for gold has been nearly 3:1, indicating one-sided momentum that may be prone to reversal once profit-taking intensifies.
However, unlike previous speculative phases in 1980 and 2011, today’s market includes a deeper institutional base. ETFs hold more than $260 billion in bullion exposure, and the share of gold within total global investment assets has risen from 4% to 6% in two years — still far below the 22% peak of the 1980 bubble. This suggests room for structural expansion even as sentiment overheats. For retail investors, especially across Asia, cultural demand remains strong: the Perth Mint reported a 21% monthly increase in gold bar purchases, and India’s festival season is expected to boost jewelry demand further despite record-high prices.
Indonesia’s Aneka Tambang (Antam) gold price dropped sharply by Rp 57,000 to Rp 2.42 million per gram, tracking the global correction. That move followed an earlier surge from Rp 1.55 million at the start of the year — a 57% rise before profit-taking hit. Despite the pullback, domestic appetite remains strong, with Antam importing 30 tons of gold from Singapore and Australia to meet demand. The correction aligns with the global pattern of retracement following overextension, yet Indonesian traders view the drop as an entry point amid persistent inflation risk.
Across Asia, demand patterns reflect dual motivations — wealth preservation and speculative anticipation. Chinese household accumulation continues to surge as Beijing maintains tight capital controls, while Indian imports are set to exceed 900 tons in 2025, the highest in a decade. These localized trends amplify gold’s global tightness, keeping spot prices supported even as Western profit-taking pressures futures markets.
EUR/USD stretched its weekly rally into a third consecutive day on Thursday and continued to push higher early Friday. After touching its strongest level in over a week near 1.1730, the pair corrected lower and was last seen fluctuating at around 1.1700.
The table below shows the percentage change of Euro (EUR) against listed major currencies this week. Euro was the strongest against the Australian Dollar.
| USD | EUR | GBP | JPY | CAD | AUD | NZD | CHF | |
|---|---|---|---|---|---|---|---|---|
| USD | -0.72% | -0.54% | -1.41% | 0.43% | 0.80% | 0.43% | -1.47% | |
| EUR | 0.72% | 0.18% | -0.63% | 1.14% | 1.62% | 1.16% | -0.77% | |
| GBP | 0.54% | -0.18% | -0.78% | 0.97% | 1.42% | 0.98% | -0.97% | |
| JPY | 1.41% | 0.63% | 0.78% | 1.79% | 2.18% | 1.88% | -0.13% | |
| CAD | -0.43% | -1.14% | -0.97% | -1.79% | 0.34% | 0.01% | -1.92% | |
| AUD | -0.80% | -1.62% | -1.42% | -2.18% | -0.34% | -0.44% | -2.36% | |
| NZD | -0.43% | -1.16% | -0.98% | -1.88% | -0.01% | 0.44% | -1.93% | |
| CHF | 1.47% | 0.77% | 0.97% | 0.13% | 1.92% | 2.36% | 1.93% |
The heat map shows percentage changes of major currencies against each other. The base currency is picked from the left column, while the quote currency is picked from the top row. For example, if you pick the Euro from the left column and move along the horizontal line to the US Dollar, the percentage change displayed in the box will represent EUR (base)/USD (quote).
The US Dollar (USD) failed to shake off the bearish pressure on Thursday and allowed EUR/USD to preserve its bullish momentum. In addition to the uncertainty surrounding the US-China relations and the US government shutdown, growing concerns over the unhealthy lending practices of regional US banks caused the USD to weaken against its peers.
Meanwhile, French Prime Minister Sébastien Lecornu has survived two votes of no confidence. Although Lecornu will face an uphill battle in a parliamentary debate to pass the budget until the end of the year, this development seems to be supporting the Euro.
Early Friday, US stock index futures trade deep in negative territory, losing more than 1%. The risk-averse market atmosphere seems to be limiting EUR/USD’s upside for now.
In the absence of high-impact data releases, the risk perception could drive EUR/USD’s action heading into the weekend.
However, the USD could struggle to attract safe-haven flows in case US Treasury bond yields continue to decline alongside stocks. On Thursday, the benchmark 10-year US T-bond yield lost more than 1% and dropped to its weakest level since early April below 4%. Another deep slide in US T-bond yields could open the door for another leg higher in EUR/USD.
After breaking above the 100-day Simple Moving Average (SMA), currently located at 1.1650, EUR/USD climbed above 1.1700, where the 20-day, 50-day and the 200-period on the -4-hour chart align. In case EUR/USD manages to stabilize above 1.1700 and confirm that level as support, 1.1765 (Fibonacci 23.6% retracement of the latest uptrend) could be seen as the next resistance level before 1.1820 (static level).
If EUR/USD retreats below 1.1700 and fails to reclaim this level, technical buyers could hesitate. In this scenario, 1.1650 (100-day SMA) aligns as the next support level ahead of 1.1580 (Fibonacci 61.8% retracement).
The Euro is the currency for the 19 European Union countries that belong to the Eurozone. It is the second most heavily traded currency in the world behind the US Dollar. In 2022, it accounted for 31% of all foreign exchange transactions, with an average daily turnover of over $2.2 trillion a day.
EUR/USD is the most heavily traded currency pair in the world, accounting for an estimated 30% off all transactions, followed by EUR/JPY (4%), EUR/GBP (3%) and EUR/AUD (2%).
The European Central Bank (ECB) in Frankfurt, Germany, is the reserve bank for the Eurozone. The ECB sets interest rates and manages monetary policy.
The ECB’s primary mandate is to maintain price stability, which means either controlling inflation or stimulating growth. Its primary tool is the raising or lowering of interest rates. Relatively high interest rates – or the expectation of higher rates – will usually benefit the Euro and vice versa.
The ECB Governing Council makes monetary policy decisions at meetings held eight times a year. Decisions are made by heads of the Eurozone national banks and six permanent members, including the President of the ECB, Christine Lagarde.
Eurozone inflation data, measured by the Harmonized Index of Consumer Prices (HICP), is an important econometric for the Euro. If inflation rises more than expected, especially if above the ECB’s 2% target, it obliges the ECB to raise interest rates to bring it back under control.
Relatively high interest rates compared to its counterparts will usually benefit the Euro, as it makes the region more attractive as a place for global investors to park their money.
Data releases gauge the health of the economy and can impact on the Euro. Indicators such as GDP, Manufacturing and Services PMIs, employment, and consumer sentiment surveys can all influence the direction of the single currency.
A strong economy is good for the Euro. Not only does it attract more foreign investment but it may encourage the ECB to put up interest rates, which will directly strengthen the Euro. Otherwise, if economic data is weak, the Euro is likely to fall.
Economic data for the four largest economies in the euro area (Germany, France, Italy and Spain) are especially significant, as they account for 75% of the Eurozone’s economy.
Another significant data release for the Euro is the Trade Balance. This indicator measures the difference between what a country earns from its exports and what it spends on imports over a given period.
If a country produces highly sought after exports then its currency will gain in value purely from the extra demand created from foreign buyers seeking to purchase these goods. Therefore, a positive net Trade Balance strengthens a currency and vice versa for a negative balance.
The Japanese Yen (JPY) has long been a pivotal currency in global foreign exchange markets. Understanding its dynamics can help traders make informed decisions, especially regarding the USD/JPY currency pair. This analysis provides insights into the factors influencing the Yen, its forecast for 2025 and 2026, and whether it is a good pair to trade.
Understanding the Japanese Yen
The Japanese Yen is the official currency of Japan and serves as a major reserve currency. Its significance in the forex market stems from Japan’s status as one of the world’s largest economies. The Yen is often viewed as a safe-haven currency, meaning that it tends to strengthen during periods of economic uncertainty or market volatility.
Key Characteristics of the Yen
Safe-Haven Currency: Investors flock to the Yen during geopolitical tensions or financial crises, leading to appreciation against other currencies.
Interest Rates: The Bank of Japan (BOJ) plays a crucial role in influencing the Yen’s value through its monetary policy, particularly its interest rates.
Economic Indicators: Economic data such as GDP growth, inflation, and trade balance significantly impact the Yen’s performance.
Factors Influencing the Yen
Several factors can influence the strength of the Japanese Yen, making it essential for traders to stay informed:
1. Monetary Policy
The Bank of Japan’s monetary policy is a primary driver of the Yen’s value. The bank has maintained a loose monetary policy for years, including negative interest rates and quantitative easing, to stimulate economic growth. Any shift toward tightening could lead to a stronger Yen, while continued easing may weaken it.
2. Economic Performance
Japan’s economic health is crucial for the Yen’s valuation. Key indicators include:
GDP Growth: Sustained economic growth can bolster the Yen as it attracts foreign investment.
Inflation Rates: Rising inflation may prompt the BOJ to adjust interest rates, impacting the Yen’s strength.
Trade Balance: Japan is a major exporter, and a positive trade balance generally supports the Yen.
3. Global Economic Conditions
Global economic stability significantly impacts the Yen. During times of economic uncertainty, investors often flock to safe-haven assets, leading to Yen appreciation. Conversely, a robust global economy may weaken the Yen as investors seek higher returns in riskier assets.
4. U.S. Dollar Strength
The USD/JPY pair’s performance is directly influenced by the strength of the U.S. Dollar. Factors affecting the Dollar, such as U.S. interest rates and economic data, will also impact the Yen. A strong Dollar often leads to a weaker Yen and vice versa.
Current Economic Landscape
As of late 2023, the global economy is facing various challenges, including inflationary pressures, supply chain disruptions, and geopolitical tensions. The Bank of Japan’s stance on monetary policy remains crucial as it navigates these complexities.
Recent Developments
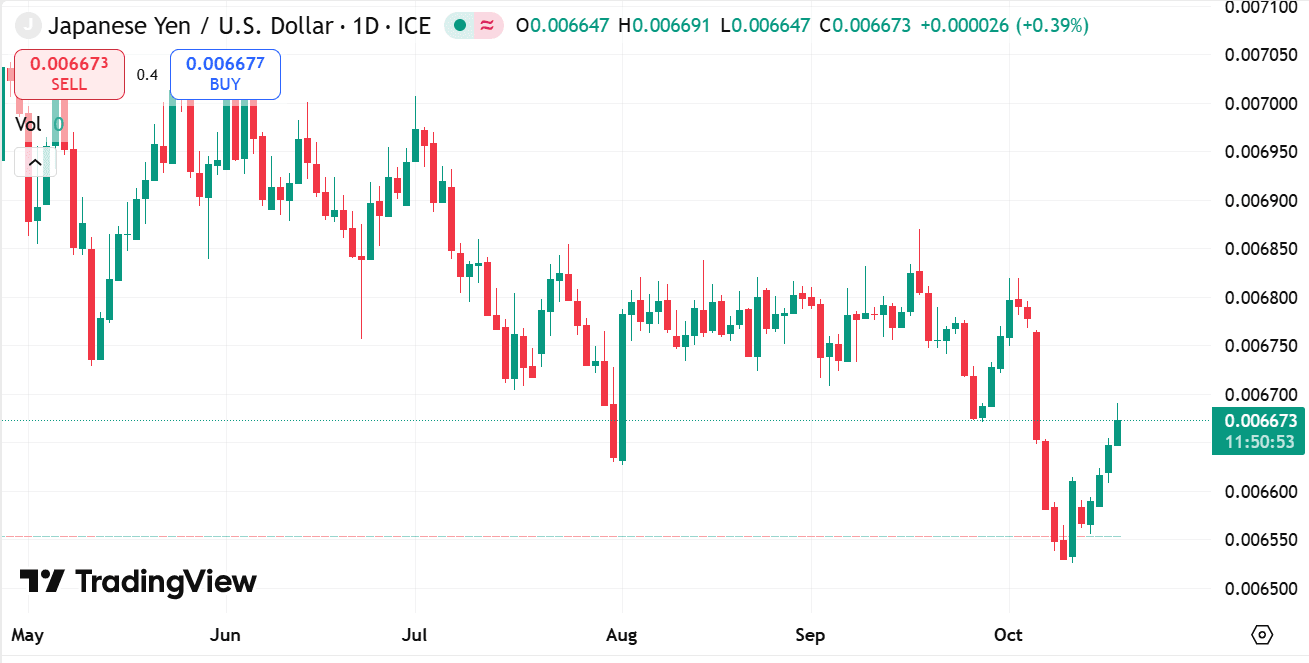
source: tradingview
Interest Rates: The BOJ has maintained its accommodative stance, but there are signs that it may consider tightening in response to rising inflation.
Inflation: Japan has experienced higher inflation rates, prompting discussions about potential policy changes.
Global Uncertainty: Ongoing geopolitical tensions and economic challenges have led to fluctuations in the Yen’s value.
Japanes Yen Forecast for 2025/2026
Economic Projections
Analysts predict that the Japanese economy will continue to recover gradually. Key factors influencing the forecast include:
Monetary Policy Adjustments: If the BOJ shifts towards a tighter monetary policy, it could strengthen the Yen.
Global Economic Conditions: A stable global economy may lead to a weaker Yen as investors seek higher returns elsewhere.
Domestic Economic Growth: Continued growth in Japan’s GDP could provide support for the Yen.
Japanese Yen Technical Analysis
From a technical perspective, the USD/JPY pair has shown significant volatility. Traders should monitor key support and resistance levels to gauge potential price movements.
Support Levels: Key support levels to watch include recent lows that may indicate buying opportunities.
Resistance Levels: Resistance levels can signify potential selling points or areas where the price may struggle to rise.
Is USD/JPY a Good Pair to Trade?
Advantages of Trading USD/JPY
Liquidity: The USD/JPY pair is one of the most liquid currency pairs, making it easy to enter and exit trades.
Volatility: The pair often experiences significant price movements, providing opportunities for traders to capitalize on short-term fluctuations.
Economic Correlation: The close relationship between the U.S. and Japanese economies provides a solid basis for analysis and forecasting.
Considerations for Trading
Market Sentiment: Traders should remain aware of global economic conditions and market sentiment, as these can impact the Yen’s value.
Technical Analysis: Utilizing technical indicators and chart patterns can help traders identify potential entry and exit points.
Risk Management: Implementing effective risk management strategies is crucial when trading the USD/JPY pair, especially given its volatility.

Looking to trade forex CFDs? Choose Markets.com for a user-friendly platform, competitive spreads, and a wide range of assets. Take control of your trading journey today! Sign up now and unlock the tools and resources you need to succeed in the exciting world of CFDs. Start trading!
Conclusion
The Japanese Yen remains a significant currency in the forex market, influenced by various economic factors and global conditions. The USD/JPY pair presents several opportunities for traders, particularly due to its liquidity and volatility.
As we look toward 2025 and 2026, the Yen’s performance will largely depend on the Bank of Japan’s monetary policy decisions, Japan’s economic growth, and global economic stability. Traders should stay informed and employ sound analysis strategies to navigate the complexities of this currency pair effectively.
In summary, while trading USD/JPY can be lucrative, it requires careful consideration of market dynamics, economic indicators, and risk management practices. With the right approach, traders can capitalize on the opportunities presented by this pivotal currency pair.
Gold’s spectacular 2025 ascent momentarily stalled after touching unprecedented levels above $4,378 per ounce, as shifting global risk sentiment and the easing of U.S.–China tariff fears prompted investors to take profits. Spot XAU/USD fell as much as 2.2% to $4,220.10, while December futures on the Comex closed around $4,236.20, down 1.6% intraday. The correction came just hours after the metal had posted its biggest two-day climb since the financial crisis of 2008 and remains roughly 8% higher for the week, up 66% year-to-date, far outpacing other major asset classes.
The pullback coincided with President Donald Trump’s reassurance that the planned 100% tariffs on Chinese imports “will not stand”, a statement that defused a surge of geopolitical anxiety responsible for gold’s latest record run. Earlier panic over escalating trade conflict had driven investors to abandon equities and pile into bullion, pushing spot prices from $4,214 to $4,314 per ounce intraday on October 16 before exhaustion set in. Equity indices rebounded once Trump confirmed that negotiations with Beijing would resume, paring risk-off flows and cooling the safe-haven rush that had characterized the week.
Wall Street’s earlier turbulence—sparked by a sell-off in regional U.S. bank stocks amid credit concerns—had briefly revived memories of 2008 and sent traders scrambling for protection. As sentiment normalized, gold’s defensive bid weakened, revealing just how leveraged speculative positioning had become after months of relentless inflows.
Behind the volatility lies a structural story of global reallocation. According to analysts at Société Générale, central bank accumulation and ETF inflows remain the dominant drivers of gold’s 2025 surge. “Resilient and huge ETF flows are pulling prices up,” said the bank’s commodity head Michael Haigh, whose team projects gold reaching $5,000 per ounce by 2026. HSBC raised its own 2025 average forecast by $100 to $3,455 per ounce, acknowledging that sovereign diversification and de-dollarization trends are accelerating.
The World Gold Council’s latest data shows ETF holdings at record levels, with institutional demand outpacing jewelry and industrial usage by more than 3:1. Investors are also betting on dovish monetary policy: Fed funds futures now imply two 25-basis-point cuts, one expected at the October 29–30 FOMC meeting and another in December, supporting non-yielding assets like gold against the weakening U.S. dollar (DXY 98.22).
Comex contracts settled 2.47% higher at $4,280.20 on October 16, cementing the highest close ever recorded for gold futures. The day’s range—$4,214.50 low to $4,314.50 high—reflected extreme intraday volatility as geopolitical headlines drove algorithmic flows. The year-on-year increase now exceeds 59%, a rally unmatched since the early 1970s gold-standard unraveling. Analysts attribute the rise to synchronized global uncertainty: trade disputes, slowing growth in China, and rising speculation of an end to the Federal Reserve’s tightening cycle.
Market veterans compared the move to the 2006 blow-off top pattern, where gold spiked 36% in two months before retracing 25% in four weeks. This analog has drawn technical warnings that the current advance may be unsustainable without a period of consolidation.
Chart analysis reveals gold trading more than 75% above its 200-week moving average, a threshold historically associated with intermediate peaks. During prior bull cycles — 2006, 2008, and 2011 — similar extensions were followed by corrections of 20%–25% before the longer-term trend resumed. The latest move mirrors that geometry: prices overshooting the upper trendline near $4,400–$4,600 could precede a retracement toward $3,500, where the 200-day moving average now sits.
FXEmpire’s technical strategist A.G. Thorson notes that the parabolic nature of recent gains fits the textbook definition of a “blow-off top,” in which speculative euphoria and leverage push markets far beyond equilibrium. Still, he emphasizes that such corrections often mark healthy resets inside enduring secular uptrends. Should history rhyme with 2006, the next multi-month consolidation could set the stage for a longer-term rally toward $6,500 by 2027 and potentially $10,000 by 2030, consistent with expanding monetary debasement and record fiscal deficits.
Gold’s vertical climb has dragged the entire precious-metals complex higher. Silver (XAG/USD) broke through its 45-year cup-and-handle formation, touching $54.14 before pulling back. Adjusted for inflation, analysts see long-term fair value near $200, underpinned by solar-panel and AI-chip demand. Platinum (PL=F) hit a new peak above $1,800 and could retrace to $1,300 if gold corrects 20%.
Mining equities mirrored the metal’s advance. The VanEck Gold Miners ETF (NYSE: GDX) reached $85, fulfilling a four-year rounded-bottom target, while the Junior Miners ETF (NYSE: GDXJ) remains in a strong uptrend with an additional 5–10% upside possible if spot gold retests $4,400–$4,600. Silver-focused miners (NYSEARCA: SILJ) hit fresh highs as speculative capital flooded the sector. These valuations, however, are now tightly coupled to gold’s short-term path; any bullion retracement is likely to produce amplified percentage declines across mining shares.
In Asia, physical demand has re-emerged despite record prices. Philippine gold rose from ₱8,086.72 to ₱8,147.66 per gram on October 17, equivalent to ₱253,420.80 per troy ounce, illustrating how local markets are adjusting rapidly to global benchmarks. Similar strength is observed in India and Thailand, where jewelry purchases continue even at historically high levels due to cultural affinity and currency depreciation.
Meanwhile, Amaroq Minerals (CVE: AMRQ) announced the first sales of traceable Greenlandic gold, a milestone for ethical sourcing. Regional miners from Endeavour Silver (NYSE: EXK) to BHP Group (NYSE: BHP) are expanding exploration budgets in response to sustained profitability at current price levels. The Northern Miner Top-50 Index reported aggregate miner valuations surging $450 billion in a quarter, lifting the group’s combined capitalization near $2 trillion—the highest ever.
The macro backdrop continues to favor bullion structurally. The U.S. economy’s deceleration, coupled with a government shutdown and rising Treasury yields around 4.0%, has pushed investors toward real-asset hedges. Simultaneously, global central banks led by China, Turkey, and India have added more than 140 tons of gold to reserves in the last quarter, diversifying away from the dollar.
Traders increasingly view gold not merely as a crisis hedge but as a strategic allocation amid de-globalization and the fracturing of trade systems. Trump’s easing rhetoric provided short-term relief to risk assets, yet the longer-term implications—volatile trade policy and potential sanctions cycles—continue to underpin the metal’s appeal.
The near-term landscape points to heightened volatility. RSI readings above 80 on weekly charts confirm overbought conditions, while futures open interest suggests crowded speculative longs. Analysts expect consolidation between $4,100 and $4,400 before directionality returns. A failure to hold $4,200 could expose $3,850, followed by $3,500, while sustained closes above $4,450 would resume the parabolic extension.
Despite the risk of a 20% pullback, macro models built on real yields, Fed expectations, and liquidity trends maintain a bullish long-term slope. With global debt surpassing $340 trillion and fiscal policy increasingly expansionary, gold’s historical inverse correlation with real rates remains intact.
XAU/USD – Rating: Hold / Long-Term Bullish.
The metal’s short-term tone is overextended, vulnerable to profit-taking toward $3,800–$3,500, but the structural forces of central-bank demand, ETF inflows, and geopolitical fragmentation justify higher medium-term targets. The market has likely entered a late-stage blow-off phase within a secular bull run that still points toward $5,000–$6,000 by 2026–2027. For disciplined investors, weakness remains an opportunity to accumulate, not capitulate.
The US dollar has fallen against the Japanese yen only to turn around and show signs of life in what is an area that I think you need to look at the top of the ascending triangle as a potential entry. And with that being said, if we can break above the 152 yen level, then I think it opens up the possibility of a much bigger move. A breakdown below the bottom of the trading session for the week could open up a move down to 149 yen, which is an area that’s been support as well. Either way, keep in mind that you get the interest rate differential working in your favor here. And I do think that will be one of those things that people continue to pay close attention to in what has been a very strong move.
The Australian dollar initially pulled back just a bit during the trading session here on Thursday, but it looks like the 200 day EMA is going to continue to offer a little bit of support. If we can rally from here, then the 0.6550 level is an area that I think a lot of people will be watching closely. It also features a 50 day EMA. So that is a scenario where we are probably going to test that and then possibly go looking at the 0.66 level.
Signs of exhaustion, I think, show selling opportunities. This is a market that has underperformed against the US dollar, and I think that continues to be the case. So, if the US dollar strengthens, then it’s likely that the Aussie really takes a bit of a beating.
For a look at all of today’s economic events, check out our economic calendar.

Silver price prediction shows XAG/USD easing on Friday after hitting a new all-time high near $54.86 on Thursday. At the time of writing, Silver trades around $53.20, down over 1.80% on the day and below the intraday high of $53.68. Traders booked partial profits, but ongoing physical demand and institutional interest limit further downside.
The broader uptrend in Silver remains intact. On the 4-hour chart, the market shows a series of higher highs and higher lows. Bulls are defending the $53.00 psychological level, which aligns closely with the 21-period Simple Moving Average (SMA) at $52.93. A decisive break below this mark could lead to a deeper correction. Strong support exists near the $51.00-$51.20 zone, reinforced by the 50-SMA at $51.18. Buyers are likely to enter at this level, maintaining the bullish structure.
Momentum indicators indicate a mild pause after the recent rally. The Relative Strength Index (RSI) eased to around 56, suggesting waning momentum and a mild bearish divergence from the recent price highs. This points to a potential consolidation phase before Silver attempts another upward move.
Meanwhile, the Moving Average Convergence Divergence (MACD) shows a bearish crossover. The MACD line has slipped below the signal line, and the histogram turned negative. This indicates a short-term loss of bullish momentum and suggests a temporary pause or pullback before the broader uptrend resumes.
The Average Directional Index (ADX) remains near 31, confirming that the prevailing uptrend is still strong. As long as Silver holds above $53.00, the path of least resistance is upward. A break above $54.86 could lead to further gains toward the next resistance levels at $55.50 and $56.00.
Silver price prediction shows that traders are closely watching technical levels. Support at $53.00 is critical for short-term stability. If prices fall below this, $51.00-$51.20 becomes the next key support. Resistance exists at $54.86, with further levels at $55.50 and $56.00. Momentum indicators like RSI and MACD provide early signals of potential short-term pauses or pullbacks.
Silver prices react to multiple factors. Geopolitical risks or fears of recession often increase demand for safe-haven assets like Silver, though less than Gold. Interest rates also influence prices. Lower rates generally support higher Silver prices, while a stronger US Dollar may reduce XAG/USD levels. Investment demand, mining supply, and recycling rates also affect the price.
Industrial use of Silver impacts its market price. Electronics, solar panels, and other industries require Silver due to its high conductivity. Changes in industrial demand in the US, China, and India can influence prices.
Silver prices also move in relation to Gold. When Gold rises, Silver often follows. The Gold/Silver ratio helps investors understand relative valuation. A high ratio may indicate undervalued Silver, while a low ratio may indicate undervalued Gold relative to Silver.
Silver serves as a store of value and investment hedge. Investors buy physical Silver or trade through ETFs to diversify portfolios and protect against inflation.
Industrial demand in electronics, solar energy, and other sectors can raise or lower Silver prices. Large markets like China, the US, and India significantly influence these movements.
")
 Targets ,500 After T Rout and Record Rally")

 Price Forecast: Gold Posts Reversal Top After Trump–China Trade Shift")

