The main category of Forex News.
You can use the search box below to find what you need.
[wd_asp id=1]
The main category of Forex News.
You can use the search box below to find what you need.
[wd_asp id=1]
The technical analysis is obviously bullish for this market after the Japanese election, and of course the massive gap higher that jumped over the ¥200 level is a significant area of importance, and I think that’s an area where a lot of people would be looking at as a massive support level. The shooting star for the trading session, assuming that’s exactly how we close, will end up being assigned that perhaps we are finally seeing some profit-taking, and quite frankly it makes quite a bit of sense considering that many traders out there might have a 400 pip gain in just the last couple of trading sessions.
Ultimately, if we were to break out above the top of the shooting star, then the ¥206 level could be a resistance barrier, but at this point in time I think this is essentially going to be a “buy on the dips” type of scenario, and over the next couple of days we may actually have a chance to do just that. However, extreme patience will be needed because a trade will need to be confirmed via a bounce, and of course chasing the market all the way up here is a great way to lose money. Unfortunately, there are probably traders who bought this at ¥205, and may find themselves in serious trouble. By being a little bit patient, you can take advantage of what is clearly a shift to the bullish side.

Begin trading our daily forecasts and analysis. Here is a list of Forex brokers in Japan to work with.
Christopher Lewis has been trading Forex and has over 20 years experience in financial markets. Chris has been a regular contributor to Daily Forex since the early days of the site. He writes about Forex for several online publications, including FX Empire, Investing.com, and his own site, aptly named The Trader Guy. Chris favours technical analysis methods to identify his trades and likes to trade equity indices and commodities as well as Forex. He favours a longer-term trading style, and his trades often last for days or weeks.
Thursday, October 09, 2025: Gold Forecast and Analysis of the price of gold XAU/USD today
Today’s Gold Analysis Overview:
Today’s Gold Trading Signals:
Amid moves that have amazed investors, gold futures are already heading towards a new milestone in the middle of the trading week. Just one day after surpassing $4000 per ounce for the first time, the gold price index is looking to reach $4100 per ounce. According to gold trading platforms, the yellow metal’s index has risen to the resistance level of $4060 per ounce, the highest in the history of the gold trading market. Overall, the price of gold has risen by more than 4% this week, bringing its year-to-date increase to about 54%.
In a similar performance, silver, gold’s sister commodity, is attempting to reach $49 per ounce. According to trades, the price of the white metal has risen by 3% this week, boosting its year-to-date gain to about 67%. Silver prices are closing near their all-time high from 1980.
According to the monitoring and expectations of gold analysts, gold prices have continued their meteoric rise amid a weak US dollar, lower interest rates, and massive demand from central banks. This is compounded by increasing global geopolitical tensions led by the ongoing US government shutdown and European political anxiety, most notably the situation in France.
According to forex market trading, the US Dollar Index (DXY), a measure of the greenback’s strength against a basket of other major currencies, has fallen by 9% this year, although it is expected to post consecutive gains. A weak US dollar is beneficial for dollar-priced commodities because it makes them cheaper for foreign investors to buy. Another influential factor in the gold market is that US Treasury yields have mostly declined, with the benchmark 10-year yield falling below 4.1%. Lower interest rates help reduce the opportunity cost of holding non-yielding bullion.
Meanwhile, data indicates that central banks and retail traders are buying gold at a rapid pace. In fact, figures show that central banks now hold an amount of gold equivalent to their holdings of US Treasury bonds, with many pointing to countries diversifying their investments away from the US dollar. Overall, the demand for gold also reflects the growing size of US holdings. Recent data shows that the value of US gold reserves has now surpassed $1 trillion for the first time, driven by price appreciation rather than new acquisitions. Globally, across reliable platforms, precious metals markets have seen a comprehensive recovery as investors hedge against inflation, currency risks, and geopolitical uncertainty, with silver and platinum prices reaching multi-year highs.
Looking ahead, investors remain optimistic about gold trading as the Federal Reserve and other global central banks are engaged in an interest rate-cutting cycle. According to the CME FedWatch Tool, the futures market is betting on two additional quarter-point rate cuts this year. Despite investors buying gold at record levels, conditions indicate that the metal is in a severely overbought state. The Relative Strength Index (RSI) for gold has reached approximately 89.72 on the monthly chart – its highest level since at least 1980.
Dear TradersUp trader, we advise against buying gold at its all-time highs and suggest waiting for a strong price pullback to consider buying again. According to a Morgan Stanley announcement, gold is their top pick among commodities, and they expect the metal to reach a higher-than-expected price of $4,400 next year.
Ready to trade our Gold price forecast? We’ve made a list of the best Gold trading platforms worth trading with.

Image © Adobe Images
The pound to dollar exchange rate has behaved exactly as we said it would in a short-term forecast set out ten days ago.
Our Week Ahead Forecast issued on Monday, September 29, looked for a slight GBP rebound, followed by a more concerted decline to a noted support area. Here is the chart overlay from that day:
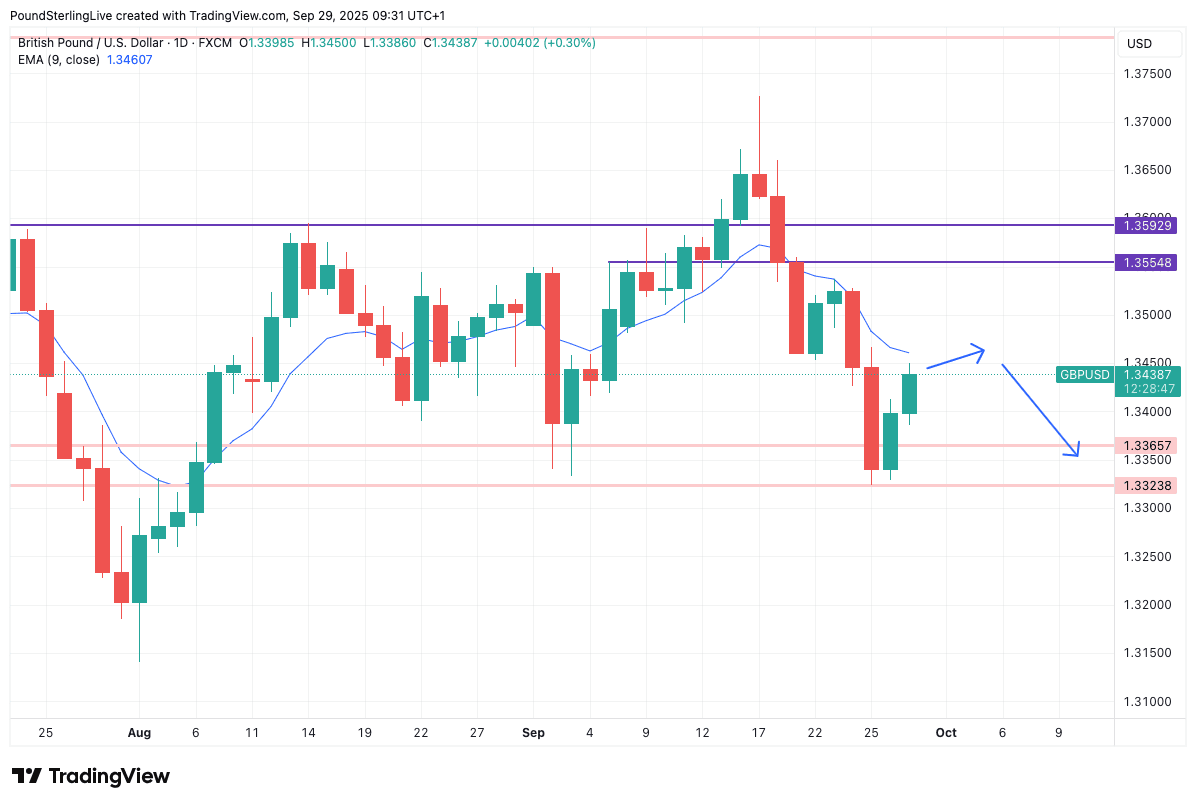
Now, keeping that overlay and fast forwarding to today, here is where we are:
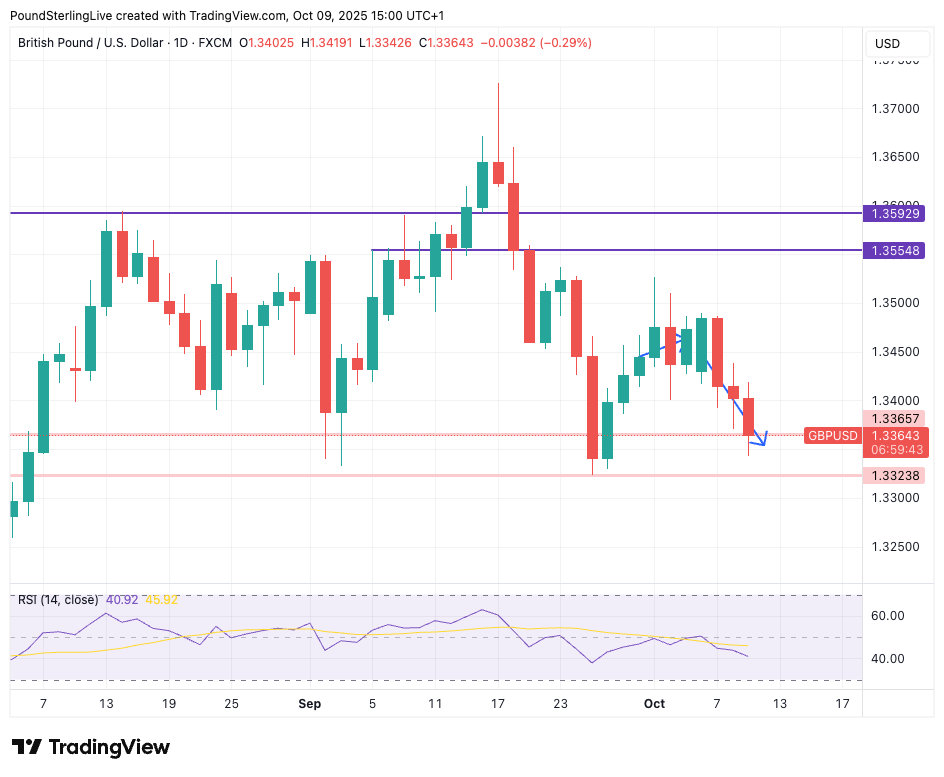

The call proved to be unusually accurate. Typically, the arrows are supposed to give an approximation of directionality, but this time, the target levels were also correct.
So, where to next? Clearly we are in a bullish setup for the dollar, even with the U.S. government shutdown underway.
Past shutdowns have tended to weigh on the dollar, but this time around, the currency is giving it a nonchalant shrug.

Pound Sterling Live consistently delivers stronger rates than major UK banks.
In July, you could have saved up to $1,515 on a £50,000 transfer thanks to our competitive pricing.
i – Based on average GBP/USD rates observed in July.
The shutdown also brings a dearth of official data, and the Greenback looks to be treating this as a classic ‘no news is good news’ environment.
But, it’s also worth pointing out that ex-USD, there is a lot going on, and for some key currencies, the news is clearly not great:
The JPY is the big faller as new Prime Minister Sanae Takaichi is elected. She is a devout follower of the Abenomics faith: i.e. get the central bank to keep interest rates low and then buy up all the government debt you can issue. This kills expectations for further rate hikes and flattens the yen. As USD/JPY rises, all the other USD- crosses rise too.
The EUR rally has hit the buffers on the reality that France’s domestic political setup is an intractable mess. Sure, the government can muddle on, but in the big picture, it becomes more likely the ECB will have to step in to support French government bonds at some point.
This will effectively mean the ECB rescues a fiscally irresponsible country, and the rest of the Eurozone will ask why they have to behave and France gets away with whatever it likes. This isn’t good for Eurozone fiscal integration and points to the perennial weaknesses of the bloc.
Also, Germany’s economic data has really disappointed of late, indicating another poor quarter is underway.
The GBP is facing significant fiscal challenges too. Unlike France, the UK does not live in a big monetary union underpinned by Germany and where the ECB is poised to lend assistance. The bond market will come knocking on Number 11’s door before it does at the Bercy building in Paris. With Labour unwilling to cut spending, higher taxes are coming. Businesses are starting to struggle under the weight of the tax increases implemented this year, and anxiety is growing ahead of another big-tax budget in November.
So, with some big currencies under pressure, the USD has little choice but to rise.
Gains can continue into year-end, further pressuring GBP/USD, but come 2026, some fundamental weaknesses in the U.S. can come to the fore again, and the bigger USD selloff can resume.
The EURJPY pair succeeded in resuming its bullish attempts yesterday, to hit the extra target at 177.80, to settle below it announces its confinement within tight track that is represented by the initial support at 176.95, and 177.80 level forms a key barrier against the bullish trading.
We remain neutral due to the instability of the price, until surpassing the previously- mentioned levels, to confirm the suggested targets in the near trading, the price success in breaching the barrier and holding above it will increase the chances for resuming the main bullish trend, attempting to reach 178.45 followed by the trading towards the bullish channel’s resistance at 179.60 level, while the decline below the extra support will support activating the attempts of gathering the gains, to reach 176.20 directly, then testing the next support near 175.20.
The expected trading range for today is between 176.90 and 177.80
Trend forecast: Neutral
A breakdown below the 1.39 level opens up a potential move down to the 200 day EMA. But in general, I think you’ve got a situation where you’re still looking to buy dips. The interest rate differential still favors the uh US dollar over the Canadian dollar. And I think with this being the case, we look at any opportunity to buy on a dip as a gift. Now, keep in mind that Friday we have the Canadian employment numbers coming out. And that of course has a major influence on this pair and will continue to be important to keep in the back of our mind. With this, I like the idea of buying this pair. I do think eventually we will go much higher. But really at this point in time, we’re just looking for the next catalyst. And again, that catalyst could very well be the Friday session with that jobs number. Also, keep in mind that the US government is still shut down, and therefore we are without any significant US data at the moment, but this could change suddenly.
Want to trade our USD/JPY forex analysis and predictions? Here’s a list of forex brokers in Japan to check out.
Christopher Lewis has been trading Forex and has over 20 years experience in financial markets. Chris has been a regular contributor to Daily Forex since the early days of the site. He writes about Forex for several online publications, including FX Empire, Investing.com, and his own site, aptly named The Trader Guy. Chris favours technical analysis methods to identify his trades and likes to trade equity indices and commodities as well as Forex. He favours a longer-term trading style, and his trades often last for days or weeks.
Copper price began today’s trading with a new positivity, attempting to breach the barrier at $5.0600 level, to confirm its surrender to the suggested bullish scenario.
We recommend waiting for confirming the activation of the price with the positivity of the main indicators by its rally towards $5.200 level, then attempt to press on the barrier at $5.3200, forming the initial main target of the current bullish track.
The expected trading range for today is between $4,988 and $5.2000
Trend forecast: Bullish
Remember, we were told that the US dollar was going to lose its world’s reserve currency status and that it was going basically to zero. And just about any time you start hearing talk like that, you’ve hit the bottom. I don’t know if the US dollar has bottom yet, but it’s definitely in the process of making that argument. The circled candlestick is from the FOMC press conference and that clearly did not weaken the US dollar. We are seeing gold shoot straight up in the air and seeing people talk about de-dollarization because of gold, but both are strengthening. The 1980s had both strengthening, so it doesn’t necessarily mean anything at this point in time. If we were to rally from here, the 1.18 level will offer significant resistance, and that’s assuming that we can even get there, because we’ve tried multiple times over the last two weeks and just haven’t been able to do that. So, with that being said, I think you’ve got a situation where you’re fading rallies at the first signs of exhaustion still.
Ready to trade our daily Forex forecast? Here’s a list of some of the best regulated forex brokers to check out.
Christopher Lewis has been trading Forex and has over 20 years experience in financial markets. Chris has been a regular contributor to Daily Forex since the early days of the site. He writes about Forex for several online publications, including FX Empire, Investing.com, and his own site, aptly named The Trader Guy. Chris favours technical analysis methods to identify his trades and likes to trade equity indices and commodities as well as Forex. He favours a longer-term trading style, and his trades often last for days or weeks.
Platinum price repeated providing positive closes in the last period by its stability above $1600.00 level, forming an extra support against the bullish attempts, attempting to settle within the minor bullish channel’s levels by its fluctuating near $1655.00.
Note that stochastic attempt to settle within the overbought level might provide extra positive momentum, reinforcing the mission of recording positive stations, which might begin at $1690.00 and $1727.00, while the price decline below the mentioned extra support might force it to provide mixed trading, and there is a chance to decline towards $1665.00 before recording any of the suggested extra targets.
The expected trading range for today is between $1600.00 and $1690.00
Trend forecast: Bullish
The British Pound appreciated nearly 3% this week, but the rally seems to be losing momentum on Thursday. The pair has failed to consolidate above 20500 and technical indicators are turning lower, suggesting a potential correction.
The Pound surged on Yen weakness as the victory of Sanae Takaichi in the ruling party’s elections over the weekend, boosted speculation of a looser fiscal policy and dampened expectations of immediate BoJ tightening
The technical picture shows all the ingredients for a bearish correction. The pair has reached strongly overbought levels at most timeframes, and the 4-Hour Moving Average Convergence Divergence (MACD) has crossed below the signal line, suggesting an increasing bearish pressure.
Bears are pushing against the intraday highs of 204.34 at the time of writing. Further down, the intra-day high at the 203.00 area, and the October 7 low, near 202.10, emerge as the next bearish targets.
To the upside, immediate resistance is at Wednesday’s high of 205.35. Trendline resistance is at 206.15, and the 161.8% Fibonacci retracement of the October 7 – 8 rally is at 207.56.
The table below shows the percentage change of Japanese Yen (JPY) against listed major currencies today. Japanese Yen was the strongest against the British Pound.
| USD | EUR | GBP | JPY | CAD | AUD | NZD | CHF | |
|---|---|---|---|---|---|---|---|---|
| USD | 0.23% | 0.44% | 0.28% | 0.06% | 0.12% | 0.45% | 0.29% | |
| EUR | -0.23% | 0.22% | 0.07% | -0.20% | 0.03% | 0.24% | -0.07% | |
| GBP | -0.44% | -0.22% | -0.18% | -0.38% | -0.20% | 0.06% | -0.23% | |
| JPY | -0.28% | -0.07% | 0.18% | -0.31% | -0.06% | 0.13% | -0.05% | |
| CAD | -0.06% | 0.20% | 0.38% | 0.31% | 0.14% | 0.41% | 0.11% | |
| AUD | -0.12% | -0.03% | 0.20% | 0.06% | -0.14% | 0.29% | -0.11% | |
| NZD | -0.45% | -0.24% | -0.06% | -0.13% | -0.41% | -0.29% | -0.29% | |
| CHF | -0.29% | 0.07% | 0.23% | 0.05% | -0.11% | 0.11% | 0.29% |
The heat map shows percentage changes of major currencies against each other. The base currency is picked from the left column, while the quote currency is picked from the top row. For example, if you pick the Japanese Yen from the left column and move along the horizontal line to the US Dollar, the percentage change displayed in the box will represent JPY (base)/USD (quote).
West Texas Intermediate (WTI) Oil price falls on Thursday, early in the European session. WTI trades at $64.60 per barrel, down from Wednesday’s close at $64.68.
Brent Oil Exchange Rate (Brent crude) is also shedding ground, trading at $68.28 after its previous daily close at $68.37.
WTI Oil is a type of Crude Oil sold on international markets. The WTI stands for West Texas Intermediate, one of three major types including Brent and Dubai Crude. WTI is also referred to as “light” and “sweet” because of its relatively low gravity and sulfur content respectively. It is considered a high quality Oil that is easily refined. It is sourced in the United States and distributed via the Cushing hub, which is considered “The Pipeline Crossroads of the World”. It is a benchmark for the Oil market and WTI price is frequently quoted in the media.
Like all assets, supply and demand are the key drivers of WTI Oil price. As such, global growth can be a driver of increased demand and vice versa for weak global growth. Political instability, wars, and sanctions can disrupt supply and impact prices. The decisions of OPEC, a group of major Oil-producing countries, is another key driver of price. The value of the US Dollar influences the price of WTI Crude Oil, since Oil is predominantly traded in US Dollars, thus a weaker US Dollar can make Oil more affordable and vice versa.
The weekly Oil inventory reports published by the American Petroleum Institute (API) and the Energy Information Agency (EIA) impact the price of WTI Oil. Changes in inventories reflect fluctuating supply and demand. If the data shows a drop in inventories it can indicate increased demand, pushing up Oil price. Higher inventories can reflect increased supply, pushing down prices. API’s report is published every Tuesday and EIA’s the day after. Their results are usually similar, falling within 1% of each other 75% of the time. The EIA data is considered more reliable, since it is a government agency.
OPEC (Organization of the Petroleum Exporting Countries) is a group of 12 Oil-producing nations who collectively decide production quotas for member countries at twice-yearly meetings. Their decisions often impact WTI Oil prices. When OPEC decides to lower quotas, it can tighten supply, pushing up Oil prices. When OPEC increases production, it has the opposite effect. OPEC+ refers to an expanded group that includes ten extra non-OPEC members, the most notable of which is Russia.