The main category of Forex News.
You can use the search box below to find what you need.
[wd_asp id=1]
The main category of Forex News.
You can use the search box below to find what you need.
[wd_asp id=1]
Gold (XAU/USD) continues its historic 2025 surge, climbing 43% year-to-date and trading near $3,760 per ounce, putting bullion on track for its strongest year since 1979. Futures briefly tested $3,791.26, just shy of a fresh record, while intraday support remains firm at $3,709.61. Momentum has been relentless, with inflows into global ETFs surpassing $10.5 billion in September alone, and cumulative allocations exceeding $50 billion year-to-date. On a structural level, central bank demand has created a durable price floor, with official sector buying estimated at 1,000 metric tons in 2025, following a record 1,086 tons in 2024.
Global monetary authorities are reshaping the gold market. China has now expanded reserves for the 10th consecutive month, bringing holdings to nearly 74 million ounces, while Russia, India, and Turkey remain consistent buyers. Central banks account for 25% of annual demand, a level unseen in modern history, transforming gold from a tactical hedge into a strategic reserve asset. This “de-dollarization” trend reflects a shift away from U.S. Treasuries, with countries seeking sanction-resistant stores of value. Strategically, this behavior cements $3,600–$3,700 as a structural floor, as central banks repeatedly intervene during corrections.
The Fed’s September 25 bps rate cut provided a fresh impulse to bullion. According to CME FedWatch, traders price in an 88% probability of another cut in October and 65% odds in December. Even with August core PCE inflation at 2.9% year-over-year and GDP growth at 3.8%, investors are betting on further easing. The U.S. Dollar Index (DXY) remains resilient at 98.18, but real yields are sliding, with the 10-year Treasury holding at 4.18% and real yields at 1.80%. This macro backdrop bolsters gold, as the opportunity cost of holding non-yielding assets declines.
Alongside central bank support, investment flows have reached historic levels. Global ETF holdings climbed above 3,615 tons this year, while silver ETFs added 95 million ounces in H1 2025. Retail appetite is just as aggressive: India’s domestic gold price surged to a record ₹110,666 per 10g (approx. $3,800/oz), while imports jumped 37% in August to $5.4 billion. Local jewelers report a drying scrap supply as households refuse to sell, anticipating higher prices. In the U.S., Costco’s gold bars sell out in hours, and physical coin demand remains elevated. These signals reflect a broad, sticky bid across investor segments.
Gold’s advance is further reinforced by geopolitics. The Russia-Ukraine war continues to disrupt energy markets, while fresh U.S. tariffs — including 100% on pharmaceuticals and 40% on furniture imports — add to uncertainty. China’s green energy commitments are also reshaping demand: silver surged 14% YTD, reaching $46 per ounce, as solar manufacturing intensified. Platinum gained 50% in 2025, climbing above $1,568, its highest in 12 years, while palladium rose above $1,280. Investors are now treating bullion and its peers as systemic hedges, with analysts noting that each new conflict or tariff shock sends fresh inflows into gold.
From a charting perspective, gold remains in a strong bullish channel. A breakout above $3,791.26 would open the path to $3,879.64, while failure to hold $3,709.61 support risks a pullback toward $3,627.96. Momentum oscillators remain stretched: RSI sits near 78, signaling overbought conditions, but price action has repeatedly consolidated in bullish flags rather than topping patterns. The 200-day SMA at $3,648 reinforces a rising long-term floor, while sentiment remains far from euphoric, suggesting further upside before speculative exhaustion sets in.
Wall Street remains broadly bullish. Goldman Sachs targets $3,700 for 2025 year-end and $4,000+ in 2026, while OCBC Bank expects $3,900 by year-end. RBC strategist Nicholas Frappell and Metals Focus’s Philip Newman both highlight $3,800 as a base case with upside toward $4,000 in 2026. Longer-dated calls stretch further: forecasts for 2029–2030 range from $5,000 to $7,000 per ounce, premised on sustained central bank buying, weaker fiat credibility, and geopolitical fragmentation.
The convergence of record central bank buying, ETF inflows, persistent inflation above 2.5%, and structural supply stagnation at ~4,000 tons annually creates a rare alignment for gold. With spot gold at $3,760 and technicals pointing toward $3,879–$4,000, the market retains strong bullish momentum. Risks of corrective dips remain, but structural demand support from sovereigns and institutions suggests these dips will be shallow. Based on current evidence, gold (XAU/USD) is firmly a Buy, with year-end targets clustered between $3,850–$3,950, and potential overshoots above $4,000 if U.S. jobs data and Fed cuts align in October–December.
Important DisclaimersThe content provided on the website includes general news and publications, our personal analysis and opinions, and contents provided by third parties, which are intended for educational and research purposes only. It does not constitute, and should not be read as, any recommendation or advice to take any action whatsoever, including to make any investment or buy any product. When making any financial decision, you should perform your own due diligence checks, apply your own discretion and consult your competent advisors. The content of the website is not personally directed to you, and we does not take into account your financial situation or needs.The information contained in this website is not necessarily provided in real-time nor is it necessarily accurate. Prices provided herein may be provided by market makers and not by exchanges.Any trading or other financial decision you make shall be at your full responsibility, and you must not rely on any information provided through the website. FX Empire does not provide any warranty regarding any of the information contained in the website, and shall bear no responsibility for any trading losses you might incur as a result of using any information contained in the website.The website may include advertisements and other promotional contents, and FX Empire may receive compensation from third parties in connection with the content. FX Empire does not endorse any third party or recommends using any third party’s services, and does not assume responsibility for your use of any such third party’s website or services.FX Empire and its employees, officers, subsidiaries and associates, are not liable nor shall they be held liable for any loss or damage resulting from your use of the website or reliance on the information provided on this website.Risk DisclaimersThis website includes information about cryptocurrencies, contracts for difference (CFDs) and other financial instruments, and about brokers, exchanges and other entities trading in such instruments. Both cryptocurrencies and CFDs are complex instruments and come with a high risk of losing money. You should carefully consider whether you understand how these instruments work and whether you can afford to take the high risk of losing your money.FX Empire encourages you to perform your own research before making any investment decision, and to avoid investing in any financial instrument which you do not fully understand how it works and what are the risks involved.
Gold prices continued their advance this week with spot bullion settling at $3,778.62 per ounce, up nearly 0.8% on Friday and closing just shy of the record intraday high of $3,791.26 earlier in the week. December gold futures also climbed 1% to $3,809, extending weekly gains of 2.1%. The strength came as the U.S. PCE index rose 2.7% year-over-year in August, in line with expectations, cementing investor conviction that the Federal Reserve will proceed with at least one rate cut before year-end. The CME FedWatch tool now implies an 88% probability of a cut in October and 65% odds of a second in December, keeping bullion well bid against a backdrop of steady inflation and moderate income growth.
The latest macro data left the Fed with optionality but not urgency. Core PCE increased 0.2% month-on-month and 2.9% annually, providing enough justification for easing while confirming inflation’s stickiness above target. Bond markets stayed muted, with the 10-year Treasury yield at 4.16% and the 30-year at 4.74%, showing that fixed income investors are awaiting labor market confirmation. As long as yields remain capped and rate cuts stay in play, the environment remains supportive for gold, allowing XAU/USD to defend elevated levels near $3,770 despite a stronger U.S. dollar earlier in the week.
While ETF inflows remain strong, physical buying has weakened. China’s gold imports dropped 34% in August compared to the prior month, while Hong Kong’s net imports collapsed 39% to just 27 tons. Dealers in Shanghai and Hong Kong are now offering discounts ranging from $21 to $36 per ounce, the steepest since May 2020, as local buyers balk at near-$3,800 pricing. This softening in Asian demand is creating a stark divergence between Western financial flows into ETFs and real-world jewelry and retail consumption in Asia, historically the backbone of the gold market. If prices remain pinned near all-time highs, the risk of further erosion in physical demand looms.
On the technical front, gold remains trapped in a narrow band between support and record resistance. Spot XAU/USD has tested $3,791.26 multiple times without a confirmed breakout. A sustained push above that level opens the door toward $3,879.64, the next Fibonacci extension, and potentially $3,915. Conversely, immediate downside support sits at $3,730, with a deeper safety net near $3,712 tied to the 50% retracement of the September leg higher. A close below $3,712 risks a correction toward $3,693, unwinding nearly two weeks of bullish momentum. The RSI at 57 signals neutral positioning, while candlestick rejection at highs indicates fading conviction from momentum traders.
Despite softness in Asia, Western demand remains resilient. Global ETFs linked to gold continue to see inflows, positioning bullion as both a hedge against dollar volatility and a store of value amid tariff uncertainty. Revised U.S. GDP growth at 3.8% annualized in Q2 and the Atlanta Fed’s Q3 tracker at 3.9% show that economic expansion is holding, complicating the Fed’s rate path. Still, investors have poured into gold as a counterweight to equities trading at stretched 22.5x forward earnings, above both the five- and ten-year averages. With central banks maintaining net purchases and M2 money supply growth re-accelerating to 6% globally, gold retains structural support from liquidity-driven flows.
The immediate battle sits between $3,730 and $3,791. Holding above $3,730 keeps gold in a consolidation phase with breakout potential, while a decisive push through $3,791 sets up acceleration to $3,879 and beyond. The physical demand drop in China is a near-term drag, but institutional ETF inflows and dovish Fed expectations outweigh retail softness. For now, XAU/USD is a Hold in the short-term range, but with structural liquidity, Fed easing, and central bank buying as backstops, the long-term outlook remains bullish, targeting $3,900+ into 2026.
Technically, USD/JPY’s reclaim of the 200DMA has reset the bullish outlook, but caution lingers given past failures above this level. RSI (14) remains in overbought territory, while MACD momentum continues to slope upward. Immediate support is reinforced at 149.00, followed by a cluster near 148.80. On the upside, a daily close beyond 150.90 would open 151.22 before setting the stage for 152.40. If buyers fail to sustain momentum, pullbacks could target 148.00 or deeper retracements toward 145.50, the September low.
From a structural perspective, USD/JPY’s multi-year trend from the 2021 low at 102.58 remains intact. The correction from last year’s 161.94 high may have already bottomed at 139.87, with the breakout through 149.12 reinforcing that interpretation. As long as 139.00–139.20 holds, the bullish bias for a retest of 161.94 is preserved. A failure back below 139.00 would suggest the corrective wave is not yet complete, but that scenario looks less likely given current U.S. economic resilience.
The EURJPY pair failed to resume the bullish attack, due to its stability below %1.809 Fibonacci extension level, forming an extra barrier at 175.20, providing sideways trading since yesterday by its stability near 174.85.
Reminding you that the bullish scenario will remain valid, due to the stability within the bullish channel’s levels besides the continuation of forming an initial support at 173.40 level, which makes us wait for breaching the current barrier to ease the mission of recording extra gains that might begin at 176.00 and 176.95.
The expected trading range for today is between 174.20 and 175.20
Trend forecast: Sideways until achieving the breach
The GBP/USD weekly forecast has turned bearish after the price significantly declined last week, reaching 7-week lows near 1.3320. The move was attributed to a stronger dollar after a cautious Fed and upbeat data.
–Are you interested to learn more about ECN brokers? Check our detailed guide-
A broad US dollar resurgence followed stronger-than-expected US GDP growth, a recovery in durable goods orders, and a decline in jobless claims. This reinforced the view that the Federal Reserve may not deliver aggressive rate cuts this year. The Fed’s cautious tone was echoed by Fed Chair Powell and other policymakers, which further pushed the greenback up.
On the other hand, softer UK PMI data revealed slower growth momentum, further weighing on the demand for the pound. The Composite PMI fell to 51.0 in September from 53.5 in August, underscoring the fragility of the UK economy. Weaker gilt demand and political uncertainty also kept the sterling subdued.
The Friday’s Core PCE Inflation data came as expected at 2.9% y/y; the lack of upside surprise and a mildly better risk mode helped the GBP/USD stabilize into the weekend. However, the broader sentiment remains favorable for the US dollar as markets scale back bets for quicker Fed easing, while the Bank of England retains its cautious stance.

Moving to the last week of the month, the focus now shifts to the US labor market and the UK growth data, with the following significant events:
Another round of strong US data could further undermine the GBP/USD, while cooling labor market signs could dampen the dollar’s recovery. Traders will also monitor speeches by the Fed and BOE for fresh policy cues, along with tariff-related developments from the US.
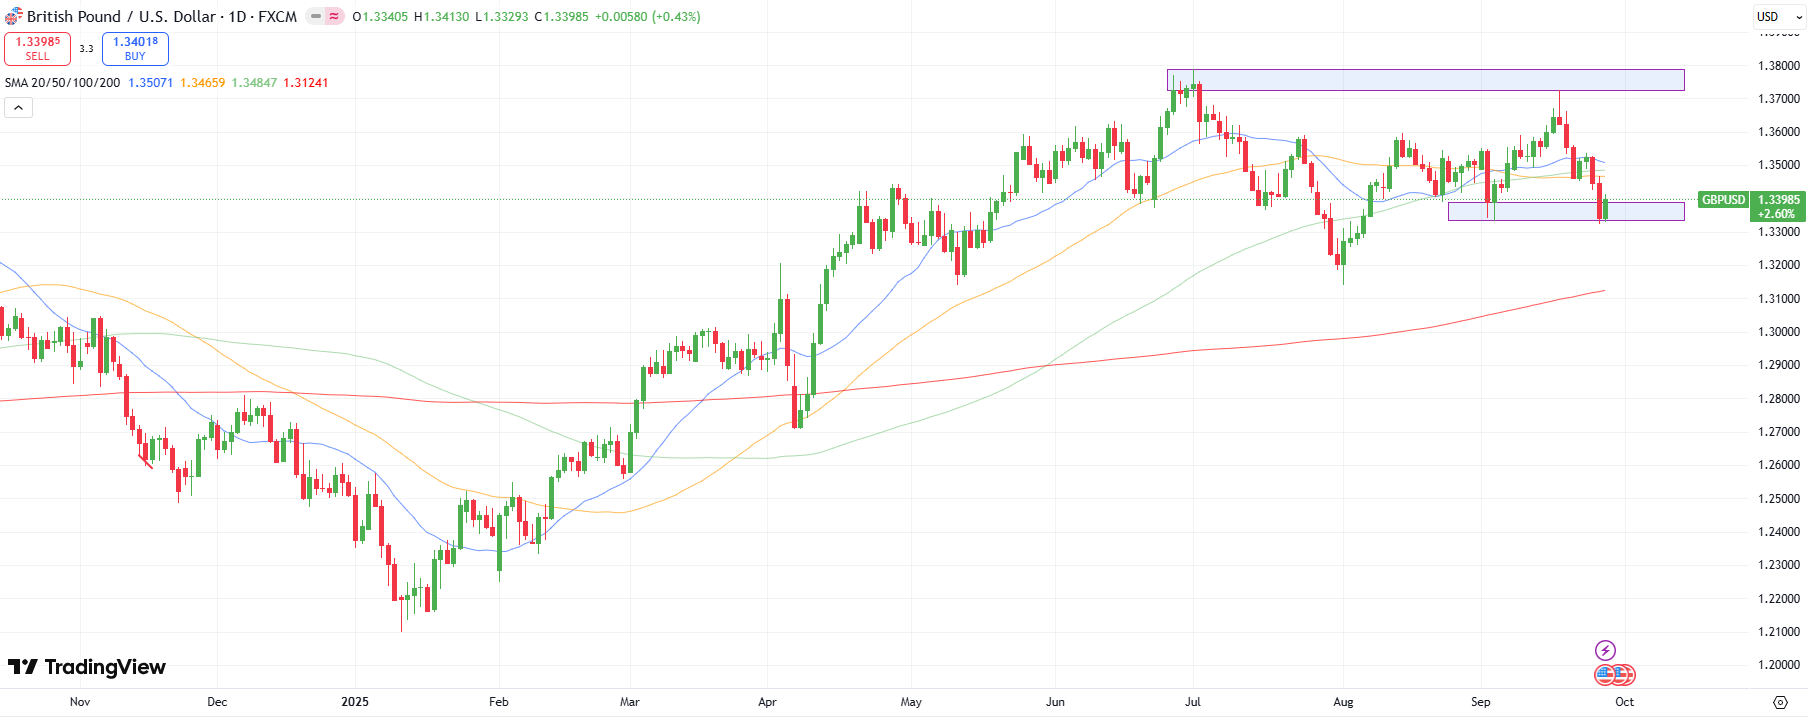
The daily chart for the GBP/USD reveals a neutral to bearish bias, as the downside meets solid support at 1.3340, with the price jumping to the 1.3400 mark while closing the week. However, the prices are lying well below the key moving averages, which could gather selling traction, pushing towards the 200-day MA at 1.3125. This needs a clear breakout of the demand zone.
–Are you interested to learn more about making money in forex? Check our detailed guide-
On the other hand, if the prices remain supported by the demand zone, the pound could further gain and test the MA confluence zone at 1.3480–1.3500. The markets are likely to consolidate, awaiting fresh impetus.
Looking to trade forex now? Invest at eToro!
67% of retail investor accounts lose money when trading CFDs with this provider. You should consider whether you can afford to take the high risk of losing your money.
USD/JPY surged into Friday’s European session, trading as high as ¥149.96 before easing to ¥149.52 by 17:00 GMT, marking a weekly gain of 1.3%. The move was powered by a sharp reduction in expectations for aggressive Federal Reserve rate cuts after a combination of stronger-than-expected U.S. macroeconomic releases. Second-quarter GDP was revised up to 3.8% from 3.2%, while weekly jobless claims fell to 218,000, the lowest since July, countering fears of a softening labor market. The dollar index simultaneously climbed to 97.85 before easing back to 97.50, underlining broad greenback strength that lifted USD/JPY from its early-September lows of 146.90.
The Japanese yen’s weakness was exacerbated by softer-than-expected inflation data in Tokyo, where September headline CPI slowed to 2.5% year-on-year from 2.6% in August. The core measure held at 2.5% rather than accelerating to 2.6% as economists had forecast. Markets immediately trimmed the probability of an October Bank of Japan rate hike from 50% to just 35%. The moderation in Japan’s inflation gives policymakers at the BoJ further cover to maintain ultra-accommodative policy, reinforcing the divergence between U.S. and Japanese yields. The move has pushed the yen to its weakest level in eight weeks, with USD/JPY now retesting levels last seen on August 1, when the pair briefly reached 150.00.
Correlation studies show USD/JPY tracking short-end U.S. yields and Fed funds futures with a coefficient near -0.94 over the past two weeks, a near-lockstep relationship. Futures markets now discount fewer than 50 basis points of additional easing in 2025, compared to nearly 100 basis points just a month earlier. This repricing, tied closely to resilient consumer spending and income growth in the U.S., has made USD/JPY extremely sensitive to U.S. data surprises. Traders note that while the Fed’s preferred inflation measure—the PCE deflator—rarely shocks, today’s release of spending and income details could prove more consequential for expectations and price action in USD/JPY.
USD/JPY’s technical picture has turned decisively bullish. The pair has broken above its 200-day moving average for the first time since June, now holding support near the ¥149.00 level. Momentum gauges confirm the strength of the move: the 14-day RSI is trending higher, and MACD remains firmly in positive territory. Bulls are eyeing resistance at ¥151.00, the October 2022 swing high, and further at ¥152.40, a level tested in late 2023. On the downside, any slip below ¥149.00 could expose the 20-day moving average near ¥148.25, while deeper pullbacks might target ¥147.50 where demand has previously emerged. Still, with Japan’s inflation losing steam and U.S. data consistently surprising to the upside, the bias remains skewed to the upside for now.
Institutional accounts in Tokyo and New York have been adding to long USD/JPY positions on the break above 149.00, according to traders familiar with the flows. Options markets have shown heavy demand for 150.00 strike calls expiring next week, indicating positioning for a breakout. Meanwhile, volatility remains subdued, with one-month implied vol hovering at 9.2%, well below levels seen during past interventions by Japanese authorities. This signals that while risk of official action exists if USD/JPY sustains above 150.00, the market is not yet pricing imminent intervention.
Given the dovish backdrop in Tokyo, the resilience of U.S. growth, and the repricing of Fed cuts, USD/JPY remains tilted toward further upside. Support at ¥149.00 is critical, and as long as the pair holds above it, the path toward ¥151.00 appears open. Short-term traders should remain alert around today’s U.S. PCE data and subsequent Fed speakers, but the balance of risks suggests dips are likely to be bought. The current structure supports a Buy rating on USD/JPY with targets at ¥151.00 and ¥152.40, while acknowledging the risk of verbal or direct intervention should yen weakness accelerate beyond policymakers’ comfort zone.
The price of gold (XAU/USD) has stormed to unprecedented levels, with futures trading at $3,809.60 per ounce, up 1.02% intraday, after opening at $3,781.50. That marks a 45% gain since January, making gold the best-performing asset of 2025, ahead of both the Magnificent 7 tech stocks and Bitcoin (BTC-USD). For the first time in modern history, gold has surpassed its 1980 inflation-adjusted peak, a landmark that underscores just how intense the rush for safety has become amid wars, tariffs, and sticky inflation. Over the past year alone, prices have soared 42% from $2,662 per ounce. On a monthly horizon, gold is up nearly 12% since late August, when it traded near $3,379.
The primary driver of the rally has been sovereign demand. Central banks now hold more gold than Treasuries for the first time since 1996, and gold has overtaken the euro as the world’s second-most held reserve asset. Purchases have more than doubled compared to the previous decade. Russia, China, and India continue to accumulate as hedges against dollar dominance, but the standout in 2025 is Poland, which has added 67 tonnes this year, nearly doubling its reserves in three years. This leaves Warsaw holding more bullion than the European Central Bank itself. Unlike previous cycles, many emerging markets are buying directly from domestic miners instead of the OTC market, reducing reliance on U.S. dollars. This structural shift shows governments are determined to build resilience after sanctions on Russia’s reserves in 2022 reshaped attitudes toward financial sovereignty.
Geopolitical catalysts amplified gold’s surge this week. President Trump unveiled fresh tariffs ranging from 25% to 100% on pharmaceuticals, heavy trucks, and furniture imports, effective October 1. Branded pharma drugs face the harshest treatment with a full 100% levy unless manufacturing shifts to U.S. plants. Trucks and furniture will be taxed at 25–50%, while reports suggest chipmakers may also face penalties if production remains offshore. These measures rattled equity markets and underscored gold’s safe-haven status, driving prices from Thursday’s $3,736.90 close to Friday’s intraday high of $3,819.60.
The rally has coincided with the release of the Fed’s preferred inflation gauge, the PCE index, which came in at 2.7% annually and 2.9% core — right on target but the highest in seven months. Monthly gains of 0.3% suggest inflation is not collapsing, but investors still expect rate cuts later this year. The Fed has already priced in at least one more 25 bps reduction, though Danske Bank warned that sticky inflation could pressure policymakers. Yields on the 10-year Treasury sit near 4.18%, while the dollar index is weakening, adding to the bullish environment for gold.
Despite gold’s record-setting run, ETF flows remain muted compared to crypto. U.S. Bitcoin ETFs account for about 7% of BTC’s total market cap, while gold ETFs represent less than 1% of bullion’s market capitalization. North American gold ETFs just posted their strongest inflows since March 26, but the comparison with crypto suggests room for more institutional adoption. Commodity strategists argue that if ETF allocations to gold rise to even half of Bitcoin’s ratio, another surge beyond $4,000 per ounce becomes plausible.
Technically, December gold futures show strong momentum, with Wyckoff’s Market Rating at 8.5 out of 10. Resistance is set at $3,824.60 and then $3,900, while immediate support lies at $3,749.70 and $3,718.10. A sustained close above $3,800 unlocks the path to retest $3,900, with upside momentum potentially extending to $4,000. On the downside, bears would need to drag futures under $3,650 to regain control, a scenario that currently looks unlikely given both macro support and sovereign demand. Silver (SI=F) is also confirming the metals rally, climbing to $45.35 with a Wyckoff rating of 9.0, and eyeing resistance at $47.50.
Alongside central bank accumulation, private demand is expanding rapidly. Inflows into gold-backed ETFs have accelerated, and retail access points are broadening. Costco (NASDAQ: COST) now sells not just gold bars but also silver and platinum coins, attracting mainstream investors who want convenient exposure. The club retailer’s sales mirror broader sentiment: headlines about record prices are pulling in new buyers, reinforcing the feedback loop that drives gold higher.
Some analysts note that even at $3,800, gold may be undervalued relative to Bitcoin when comparing reserve ratios and ETF penetration. Gold remains under-owned by retail compared to crypto, suggesting that mainstream FOMO has not yet fully arrived. Bank of America’s survey ranks gold the second most crowded trade after the Mag 7, but whether this represents the first inning of institutional participation or the ninth remains contested.
With gold futures at $3,809.60 and spot levels near $3,800, the metal has cemented itself as the best-performing major asset of 2025. Central banks are stockpiling, tariffs are escalating, inflation remains elevated, and retail access is broadening. Support zones around $3,750 are holding firm, while technical upside targets point toward $3,900–$4,000. Despite talk of crowded positioning, ETF inflows remain far below crypto’s scale, leaving scope for more buying pressure. Based on the breadth of these catalysts, XAU/USD is a Buy, though traders should expect turbulence around resistance as profit-taking collides with sovereign and institutional demand.
The rally continues to confront resistance between $3,782 and $3,812, where at least five indicators converge. While Friday’s move suggests a continuation of the broader uptrend, momentum is visibly slowing. Price could still extend toward the upper boundary of the zone, but traders are closely watching how gold reacts within this cluster of resistance levels.
A decisive breakout above $3,812 would open the door to higher projections. The most notable is a 261.8% extension of the large ABCD pattern at $3,896, derived from a harmonic relationship of two rising measured moves. Further up is a confluence zone from $3,982 to $3,998. That would be the next next key target zone, though it remains distant unless bullish momentum strengthens meaningfully.
Despite price strength, momentum indicators flash caution. The Relative Strength Index (RSI) shows a bearish divergence, with price at new highs but momentum failing to confirm. This divergence, alongside current resistance near the top boundary of a rising trend channel, suggests upside breakouts may struggle to sustain without consolidation.
Initial support rests at today’s low of $3,734, followed by the 10-Day moving average at $3,712. More significant is the 20-Day line at $3,650, reinforced by the broader structure of the channel. A drop below these levels would increase the likelihood of a deeper retracement, potentially signaling that gold’s rally has overextended in the short run.
For now, the trend remains bullish with buyers holding the upper hand, and the record close this week reflects robust demand. Yet weakening momentum and proximity to key resistance levels warrant caution. Until price either breaks decisively above $3,812 or drops under $3,712, gold’s next directional move remains a contest between sustained buying and the risk of correction.
For a look at all of today’s economic events, check out our economic calendar.
The $3.35 price level carries added weight given that it coincides with the intersection of two significant trendlines — one rising and one falling. Should the market sustain strength through this zone, attention will naturally shift to the next confluence zone, around the 200-Day moving average at $3.49 and the 127.2% Fibonacci projection of the ABCD pattern at $3.51. The alignment of these levels suggests that if buyers can maintain momentum above $3.35, the path toward $3.49–$3.51 will become increasingly viable.
Another bullish development was the 20-Day moving average crossing above the 50-Day line, strengthening the short-term trend outlook. A daily close above either the rising or falling trendline near $3.35 would further validate this momentum shift, likely followed by additional signs of growing demand. On the downside, a healthy pullback could see price revisit the cluster of moving averages between $2.98 and $3.00, where the 10-Day, 20-Day, and 50-Day averages converge. That zone now represents a significant support area and could offer the foundation for a renewed leg higher once buyers return.
On the weekly timeframe, natural gas is on track to close above last week’s high of $3.17, establishing a bullish outside week reversal. Importantly, this week’s price range also encompasses the ranges of the prior three weeks, emphasizing the strength of the move and signaling a clear shift in momentum. This type of price action often precedes sustained advances, particularly when accompanied by improving moving average alignment and strengthening channel dynamics.
Overall, natural gas is showing early signs of turning the corner. A sustained breakout above $3.35 would not only confirm the rising ABCD pattern but also set the stage for a test of the longer-term resistance zone around $3.49–$3.51. Until then, traders will watch for whether the higher swing low established earlier this week holds, as that would further solidify the bullish reversal narrative.
For a look at all of today’s economic events, check out our economic calendar.

 Price Forecast: Will Bulls Clear 91.26 or Fade Before Jobs Data?")

 Price Forecast: Eyes Record Close as Bulls Confront Resistance")
