The main category of Forex News.
You can use the search box below to find what you need.
[wd_asp id=1]
The main category of Forex News.
You can use the search box below to find what you need.
[wd_asp id=1]
The EUR/USD continues to trade within a rebound zone despite recent selling pressure. The pair closed last week stable around the 1.1707 level after bulls failed to capitalize on a test of the 1.1800 psychological resistance. This followed market reactions to policy announcements from both the European Central Bank (ECB) and the Federal Reserve, alongside a batch of US economic releases that had been delayed by the longest government shutdown in US history.

According to reliable trading platforms, the EUR/USD will remain supported as long as bulls can push toward the 1.1800 resistance again. The RSI (Relative Strength Index) is currently reading around 59, supporting a bullish outlook while awaiting strong positive momentum to confirm the upward trend. Quiet and limited movement is expected as the annual holiday season approaches. Conversely, a bearish scenario on the daily chart would require a return to the 1.1500 support area. No major economic data is expected today from either the Eurozone or the US; therefore, the pair will move based on recent drivers amid low liquidity and reduced risk appetite ahead of the holidays.
According to recent Forex market data, the US Dollar retreated after US inflation was announced at 2.7% year-on-year for November, down from 3% in October. this decline contradicted analyst expectations, which had predicted an increase to 3.1%. This suggests the Federal Reserve will feel more comfortable cutting US interest rates again in the coming months.
Influenced by the data release, the US dollar index, which measures the dollar’s performance against other major currencies, fell to 98.20. The euro rose against the dollar to a high of 1.1750, while the British pound also reached a high of 1.3440.
According to the official announcement, the core inflation rate of the US Consumer Price Index (CPI) fell to 2.6% from 3.0% in October, a level that was expected to remain unchanged last month. Economists are treating lower-than-expected inflation with some skepticism, which may explain the dollar’s recovery from some of its earlier losses. Fawad Razaqzadeh, an analyst at City Index, commented that there was some skepticism surrounding this particular inflation report, given the impact of the government shutdown on data collection. He added, “Therefore, it might be best for markets not to overreact to one month’s data and to wait for the December report, which is due in January.” However, markets are accepting today’s figures as they are, buying stocks and selling “safe havens” as investors grow more confident that the Federal Reserve will cut interest rates further.
Meanhwile, the Federal Reserve remains committed to a sustainable 2.0% inflation target while protecting the labor market. If the Fed believes inflation is under control, it will lower rates to support businesses and households. Typically, Expectations of lower rates lead to a weaker US Dollar.
Traders advise monitoring the EUR/USD’s rise toward the 1.18 resistance to consider potential sell positions, provided risk management is strictly applied.
Ready to trade our EUR/USD daily forecast? Here’s a list of some of the top forex brokers in Europe to check out.
Gold is back in focus as price hold near record territory. On December 22, 2025, XAU/USD was trading close to $4,350, a level that would have sounded unrealistic just a few years ago. Yet today, it feels almost normal. Global investors are no longer asking if gold belongs in portfolios. They are asking how much exposure makes sense.
Several forces are shaping this moment. Interest rate expectations are shifting. Inflation fears have not fully faded. Central banks are still buying gold at a steady pace. At the same time, long-term forecasts are turning bolder. Some analysts now see a path toward $5,000 gold by 2026.
This price action is not driven by panic. It reflects deeper changes in how gold is viewed. Not just as a hedge. But as a strategic asset. The current consolidation near $4,350 shows caution, not weakness. Markets are pausing. Watching data. Waiting for the next trigger. And gold is quietly holding its ground.
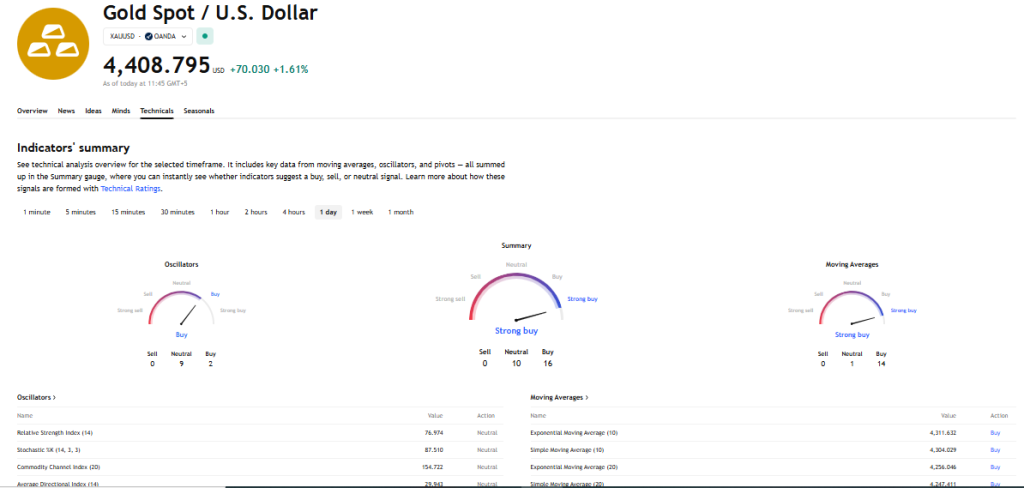
As of December 22, 2025, gold hit a record high above $4,383 per ounce, and briefly pushed past $4,400, driven by hopes for more U.S. interest rate cuts and strong demand for safe assets like bullion.
Gold has climbed sharply this year. Prices are up about 67% in 2025, making this one of the strongest annual gains in decades.Even at levels near $4,350, buyers remain active. This shows the market is waiting for strong signals before moving higher. A weaker U.S. dollar and expectations that the Federal Reserve will cut rates next year are adding to the pressure.

Instead of falling back, gold keeps finding support at these high prices. Traders see this as a sign that demand is real, not just short-term speculation. More data will soon show whether this trend continues into 2026 or cools off after a huge rally.
Gold’s role in markets has changed dramatically over the past year. In early 2025, the rally began on safe-haven flows. Now, broad macro trends are backing price strength. This includes investor demand, central bank buying, and fears linked to global instability.
Unlike past cycles where gold only moved during crises, the current environment shows structural drivers pushing prices higher. Central banks have been big buyers of gold for years, and they continue to add reserves. This demand adds a firm base under prices.
Economic uncertainty, persistent inflation fears, and ongoing geopolitical risks have made gold a core part of many portfolios. This has turned gold from a trading asset into a strategic hedge for 2025 and beyond.
Several major financial institutions now see gold rising toward or above $5,000 per ounce by 2026. Reports show that banks like Bank of America and Société Générale have forecasts in this range.
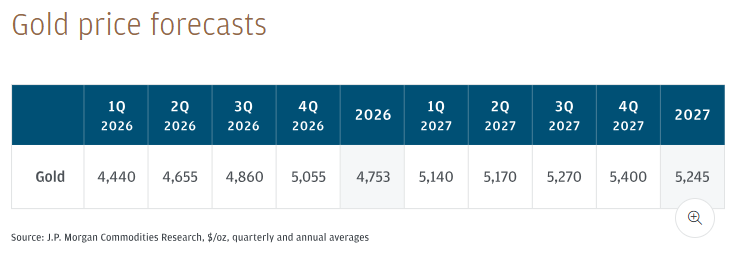
JP Morgan has forecast that gold could average over $5,000 per ounce by the fourth quarter of 2026, citing strong investor interest and central bank buying. Goldman Sachs projects a target near $4,900 by the end of 2026, backed by heavy official gold purchases.
These forecasts are not random guesses. They are based on models that assume continued demand, declining real yields, and broader geopolitical and economic risks remaining elevated. A path toward $5,000 is seen by some analysts as the natural next step if current trends persist.
Gold prices are highly sensitive to U.S. monetary policy expectations. When traders expect the Federal Reserve to cut interest rates, gold usually rises. This is because lower rates reduce the opportunity cost of holding non-yielding assets like gold.
In late 2025, markets priced in multiple rate-cut expectations for 2026. This has weakened the U.S. dollar and boosted gold. Even if rate cuts are gradual, a shift toward easier policy tends to support gold prices. The market is now watching incoming economic data closely for stronger clues on the Fed’s next moves.
Central banks around the world have been buying gold at a fast pace in recent years. This steady demand is not driven by short-term traders. It is structural. Countries diversify reserves to reduce reliance on the U.S. dollar, and gold becomes a key part of that strategy.
The pace of official gold purchases has stayed high through 2025, and projections suggest this trend will continue into 2026. Many banks now see this steady demand as a significant factor in pushing gold prices higher.
Three broad pressures are reinforcing gold’s appeal. First, inflation remains a concern globally, even as some inflation measures soften. Second, high public debt levels in major economies create uncertainty about future policy responses. Third, geopolitical risks continue to drive safe-haven buying.
When these pressures exist together, investors tend to seek assets that protect purchasing power and offer stability. Gold fits both roles. This mix of forces helps explain why prices are not falling back despite already high levels.
Technically, gold has been trading in a high range near $4,350. Analysts watch key support and resistance levels to judge whether the trend will extend or stall. Recent trading has shown gold holding above major support zones, signaling that buyers are active even after a big rally.
Short-term indicators show possible minor pullbacks, but the broader trend remains constructive unless critical levels break to the downside. Trading near these high levels is part of a normal consolidation after strong gains.
Simply calling gold “overvalued” at these levels misses the bigger picture. When adjusted for inflation and other factors, gold’s purchasing power remains strong. Historic comparisons show that current prices reflect long-term structural shifts rather than just short-term bubbles.
Even if price moves slow for a period, the fundamental drivers suggest that higher levels could still be justified over time.
Several risks could slow gold’s rise. A stronger-than-expected U.S. economy might delay rate cuts, boosting the dollar and pressuring gold. Geopolitical risks could ease, reducing safe-haven demand. Or central banks could slow their buying pace if prices rise too fast.
These risks do not make gold bearish. They simply show that the path to potential $5,000 levels is not guaranteed and depends on how key macro factors evolve.
Looking ahead, gold remains an important asset for diversification. Short-term moves may be volatile, but the broader trend shows strong support. Expert forecasts vary, but many see room for further gains. Central bank demand, monetary policy shifts, and ongoing uncertainty all feed into this outlook.
Even if gold does not hit exactly $5,000 in 2026, the trend toward higher ranges suggests it will remain a key part of global markets in the near future.
Many analysts see gold staying strong in 2026. Some forecasts put averages near $4,000-$4,900 per ounce by year‑end, backed by demand and macro trends.
Some major banks like Bank of America and HSBC say gold could hit or approach $5,000 in 2026 if rate cuts and safe‑haven flows persist.
Gold moves with factors like interest rates, U.S. dollar strength, central bank buying, and global risks, making it sensitive to macroeconomic shifts.
Disclaimer
The content shared by Meyka AI PTY LTD is solely for research and informational purposes. Meyka is not a financial advisory service, and the information provided should not be considered investment or trading advice.
The GBPJPY pair took advantage of the repeated positive pressures to confirm the continuation of the bullish scenario, surpassing the target at 209.85 on Friday forming 261%Fibonacc extension level, to open the way for recording big extra gains by hitting 211.05 level.
Noticing that stochastic reaches the overbought level, which allows it to settle within the minor bullish channel levels, depending on forming extra support at 209.80 level, to expect forming new gains by its rally towards 211.60 reaching the resistance of the bullish channel at 212.25.
The expected trading range for today is between 210.00 and 211.60.
Trend forecast: Bullish
Natural gas price failed by breaking the bullish channel’s support, affected by the continuation of the main indicators’ contradiction until this moment, which forces it to provide new sideways trading by its stability near $4.060.
The price confinement between the main support at $3.900 while $4.200 level is expected by forming strong barrier against the current trading, therefore, we recommend the neutrality for today, waiting for surpassing one of the main levels, to detect the expected trend in the near and medium period trading.
The expected trading range for today is between $3.900 and $4.200.
Trend forecast: Neutral
The GBPJPY pair took advantage of the repeated positive pressures to confirm the continuation of the bullish scenario, surpassing the target at 209.85 on Friday forming 261%Fibonacc extension level, to open the way for recording big extra gains by hitting 211.05 level.
Noticing that stochastic reaches the overbought level, which allows it to settle within the minor bullish channel levels, depending on forming extra support at 209.80 level, to expect forming new gains by its rally towards 211.60 reaching the resistance of the bullish channel at 212.25.
The expected trading range for today is between 210.00 and 211.60.
Trend forecast: Bullish
Platinum price did not get enough by its recent gains, activating with the main indicators positivity by forming strong bullish waves, to settle above the psychological barrier at $2000.00 level, recording extra historical gains by hitting $2071.00 level.
Which confirms the stability of the bullish scenario, and its stability above $2000.00 makes us expect to form new bullish waves, to attempt to reach $2085.00 and $2125.00.
The expected trading range for today is between $1970.00 and $2085.00.
Trend forecast: Bullish
– Written by
Frank Davies
STORY LINK Pound to Dollar Price Forecast: GBP Near 1.34 as Markets Bet on BoE Path
The Pound to Dollar exchange rate (GBP/USD) settled just below 1.34 after failing to hold two-month highs, with markets now focused on how the Bank of England’s easing cycle unfolds.
A narrow 5–4 vote for last week’s rate cut has left uncertainty over the pace of further moves in 2026.
Direction will hinge on whether BoE caution or renewed dollar weakness proves the dominant force.
Nordea forecasts that the Pound to Dollar (GBP/USD) exchange rate will strengthen to 1.41 by the end of 2026 as the dollar loses ground.
CIBC, however, expects GBP/USD will be held to 1.34 in 12 months from a 1.36 peak as the US currency secures a limited second-half recovery.
GBP/USD settled just below 1.34 this week after failing to hold 2-month highs just above 1.3450.
Get better rates and lower fees on your next international money transfer.
Compare TorFX with top UK banks in seconds and see how much you could save.
Monetary policy will be a crucial element throughout the next few months.
The Bank of England (BoE) cut interest rates by 25 basis points to 3.75% at the latest policy meeting, in line with strong consensus forecasts.
There was a 5-4 vote for the move with Governor Bailey switching sides from the November vote and the BoE expects further gradual cuts.
ING commented; “today’s news is helping GBP/USD towards our 2025 year-end target of 1.34, and we are mildly positive here in 2026, looking for 1.36 as the weaker dollar and stronger euro trend start to dominate.”
HSBC expects overall Pound losses with GBP/USD dependent on a US retreat to make gains; “With further rate cuts expected, we think GBP will weaken modestly against G10 currencies in 2026 that have already completed monetary easing cycles or are in the frame to start tightening.”
Yael Selfin, chief economist at KPMG, expects it will be difficult to reach a consensus on rates next year. She expects only two interest rate cuts in 2026, taking rates down to 3.25%.
Federal Reserve policy will also be a key element.

Nordea notes potential threats to US Fed independence; “These institutional risks on the horizon will be key for the dollar’s performance in the coming quarters. Importantly, risks do not need to become a reality to hurt the dollar. The mere prospect of political influence over the Fed can be enough to erode confidence.”
It added; “If markets begin to doubt the Fed’s independence or anticipate more aggressive easing under a reshaped committee, the dollar could face renewed periods of selling as investors demand a higher risk premium to hold the currency.”
CIBC is wary over UK fundamentals; “Uncertainty over the UK budget has also stymied investment in recent quarters with the UK economic surprise Index recently plummeting to levels not seen since the start of 2025. The Misery Index has risen again, exceeding levels seen at the start of 2024.”
The bank does, however, see scope for improvement; “Into the year ahead, we think the big risk is an economy that could see growth outperform a very low base. This could be spurred on by lower interest rates, or a less turbulent political climate relative to this year.
International Money Transfer? Ask our resident FX expert a money transfer question or try John’s new, free, no-obligation personal service! ,where he helps every step of the way,
ensuring you get the best exchange rates on your currency requirements.
TAGS: Pound Dollar Forecasts
Silver price (XAG/USD) trades 2.5% higher to near $69.00 during the Asian trading session on Monday, the highest level ever seen. The white metal strengthens as investors shift to a safe-haven fleet on renewed tensions between Israel and Iran.
According to a report from NBC News, Israeli officials have grown increasingly concerned that Iran is expanding production of its ballistic missile program and reconstituting its nuclear facilities, which were damaged by Israeli military strikes earlier this year, and are preparing to brief United States (US) President Donald Trump about options for attacking it again.
The scenario of geopolitical tensions increases demand for safe-haven assets, such as Silver.
On the Federal Reserve’s (Fed) monetary policy front, investors remain confident that the central bank will not reduce interest rates in the January policy meeting. Fed dovish expectations for the January meeting have not accelerated, despite the release of the soft US inflation data for November.
On Thursday, the US Consumer Price Index (CPI) data for November showed that the headline inflation cooled down to 2.7% year-on-year (YoY) from 3% in October. Economists expected the inflation data to come in higher at 3.1%. The so-called core reading, which strips out volatile food and energy items, dropped to 2.6% from estimates and the prior reading of 3%.
XAG/USD trades higher around $69.02 at the start of the week. The 20-period Exponential Moving Average at $61.14 rises firmly and sits well below the price. The wide positive spread underscores a strong uptrend but also stretched conditions.
The 14-day Relative Strength Index (RSI) at 77.44 is overbought, and a cooling phase could follow. A rising trend line from $49.96 underpins the bullish bias.
With price extended above the 20-EMA, pullbacks could find support at $61.14, preserving the advance. Momentum remains robust, yet the overbought RSI may cap near-term gains; a break below the trend line near $65 would weaken the bias and open the door for a deeper retracement toward the December 3 high near $59.00. Looking up, the psychological level of $60.00 would act as major barrier.
(The technical analysis of this story was written with the help of an AI tool.)
Silver is a precious metal highly traded among investors. It has been historically used as a store of value and a medium of exchange. Although less popular than Gold, traders may turn to Silver to diversify their investment portfolio, for its intrinsic value or as a potential hedge during high-inflation periods. Investors can buy physical Silver, in coins or in bars, or trade it through vehicles such as Exchange Traded Funds, which track its price on international markets.
Silver prices can move due to a wide range of factors. Geopolitical instability or fears of a deep recession can make Silver price escalate due to its safe-haven status, although to a lesser extent than Gold’s. As a yieldless asset, Silver tends to rise with lower interest rates. Its moves also depend on how the US Dollar (USD) behaves as the asset is priced in dollars (XAG/USD). A strong Dollar tends to keep the price of Silver at bay, whereas a weaker Dollar is likely to propel prices up. Other factors such as investment demand, mining supply – Silver is much more abundant than Gold – and recycling rates can also affect prices.
Silver is widely used in industry, particularly in sectors such as electronics or solar energy, as it has one of the highest electric conductivity of all metals – more than Copper and Gold. A surge in demand can increase prices, while a decline tends to lower them. Dynamics in the US, Chinese and Indian economies can also contribute to price swings: for the US and particularly China, their big industrial sectors use Silver in various processes; in India, consumers’ demand for the precious metal for jewellery also plays a key role in setting prices.
Silver prices tend to follow Gold’s moves. When Gold prices rise, Silver typically follows suit, as their status as safe-haven assets is similar. The Gold/Silver ratio, which shows the number of ounces of Silver needed to equal the value of one ounce of Gold, may help to determine the relative valuation between both metals. Some investors may consider a high ratio as an indicator that Silver is undervalued, or Gold is overvalued. On the contrary, a low ratio might suggest that Gold is undervalued relative to Silver.
Summary:
Japan’s intervention warning gave the yen a modest lift
USD/JPY slipped toward 157.25 from highs near 157.75
Officials flagged concern over “one-sided and sharp” moves
Verbal intervention slowing momentum, not reversing trend
AUD/JPY still supported by yield differentials
—
A renewed warning from Japanese officials about the risk of currency intervention has given the yen a modest lift at the start of the week. The move followed comments from Japan’s top currency diplomat, Atsushi Mimura, which pushed USD/JPY about half a big figure lower from earlier highs near 157.75 as I update, to around 157.25.
Mimura said on Monday that authorities are “concerned” about recent foreign-exchange moves, describing them as “one-sided and sharp,” and warned that officials would take “appropriate actions” against excessive volatility. The language was familiar, but the timing — coming so soon after last week’s central bank meeting — has been enough to nudge the market toward trimming short-yen positions.
The remarks followed similar comments late last week from Finance Minister Satsuki Katayama, who also warned that Tokyo would respond appropriately to excessive and speculative yen moves. Together, the statements underline growing discomfort in Tokyo over the pace of yen weakness, particularly given the impact on import prices and household living costs.
While the move in USD/JPY has so far been measured rather than dramatic, it reinforces the sense that official tolerance for renewed yen declines is limited, especially when moves appear disorderly. For now, verbal intervention appears to be doing just enough to slow momentum, even if it has not yet triggered a broader reversal.
Elsewhere in FX, I note earlier commentary from Commonwealth Bank of Australia on AUD/JPY, which continues to find fundamental support from solid risk sentiment and, more importantly, widening interest-rate differentials between Australian and Japanese 10-year government bond yields. That yield gap remains a powerful structural driver for the cross.
CBA’s forecast has AUD/JPY rising to 109 by March 2026, highlighting that while intervention risk may periodically cap yen weakness, broader yield dynamics continue to favour higher AUD/JPY levels over the medium term.
—
Atsushi Mimura is Japan’s vice finance minister for international affairs — the country’s top currency diplomat — and the official with day-to-day responsibility for overseeing foreign-exchange policy. In practice, Mimura is the key decision-maker on whether Japan intervenes in the FX market, acting under the authority of the finance minister and in coordination with the Bank of Japan, which executes intervention operations on his instruction. He monitors market conditions closely, assesses whether yen moves are excessive, disorderly or driven by speculation, and delivers the government’s verbal warnings that often precede action. When intervention is authorised, Mimura formally directs the BOJ to enter the market, typically through yen-buying operations aimed at stabilising sharp or one-sided moves rather than targeting specific exchange-rate levels.
Atsushi Mimura
Silver is closing out 2025 with the kind of momentum that forces both bulls and bears to pay attention. As of Sunday, December 21, 2025, the silver price (XAG/USD) is hovering around the $67-per-ounce area after a record-setting surge late last week—powered by a mix of investment flows, tight supply conditions, and an industrial demand narrative that keeps getting louder. [1]
But this is also the point in a parabolic move where markets tend to change character: liquidity thins into the holidays, positioning gets crowded, and even small headlines can trigger outsized swings. Several analysts publishing today warn that a “breather” week is possible, even if the broader trend remains bullish into 2026. [2]
Below is a complete, publication-ready roundup of today’s (21.12.2025) silver price news, forecasts, and analyses, plus the macro and technical signals traders are watching right now.
Because it’s a weekend, most “live” silver quotes are effectively tracking Friday’s U.S. session close and subsequent thin, OTC price discovery. Reuters reported that spot silver rose to about $67.14/oz on Friday (Dec. 19) after hitting a fresh record intraday high near $67.45/oz, capping a powerful weekly move. [3]
The bigger headline is the scale of the run: Reuters also noted silver has surged roughly triple-digit percentage points in 2025 (around the 120%–130% range depending on measurement), dramatically outperforming gold this year. [4]
Why this matters for today (Dec. 21):
The silver story right now is not one single catalyst—it’s a cluster of reinforcing forces.
Reuters explicitly framed the rally as heavily investment-driven, quoting market participants who emphasized that speculation is playing a major role even though fundamentals are supportive. [6]
On Friday, Reuters also pointed to ETF flows and retail speculation as a continuing theme in silver’s latest leg higher. [7]
Silver (like gold) is highly sensitive to the path of real yields and the U.S. dollar. Reuters highlighted that:
Reuters described silver’s persistent supply deficit and tightening conditions outside the U.S. as part of the bullish backdrop, adding that earlier tariff-related concerns helped pull metal toward the U.S., tightening liquidity in the London spot market. [9]
Silver’s unique twist versus gold is that it’s not just a hedge or store of value; it’s also an industrial input. Reuters cited demand prospects tied to AI data centers, solar cells, and electric vehicles as part of the “perfect storm.” [10]
One of the more interesting 2025 developments: Reuters reported that silver’s inclusion on the U.S. critical minerals list has supported prices. [11]
Here’s what the major silver-related commentary dated Sunday, December 21, 2025 is saying.
FXLeaders’ weekly outlook says silver closed at about $67.17 last Friday, framing it as a decisive post-breakout hold. Their technical roadmap is clear:
DailyForex’s weekly forecast (created Dec. 21) emphasizes the strength of the breakout while warning that moves are “messy” and volatility is elevated. The analyst’s stance: being long can still make sense, but with smaller position sizing because silver is leading the whole precious-metals complex and can whip around quickly. [13]
A PTI wire carried by The Week warns that gold and silver may take a breather next week due to year-end thin volumes, while traders focus on U.S. macro releases (GDP, housing data, durable goods, consumer confidence). [14]
It also notes that on India’s MCX:
Moneycontrol’s Dec. 21 commodities note (from Kotak Securities’ research head) presents a clean technical framework for MCX silver:
The Times of India also flags the same holiday dynamic: lower participation into Christmas and New Year can create higher sensitivity to economic releases, potentially producing sudden dips or sharp squeezes even if the longer-term trend remains constructive. [17]
With silver trading in “price discovery” territory after repeated all-time highs, forecasts are converging around a simple question:
Bull case (continuation):
Base case (pause / churn):
Bear case (profit-taking / air pocket):
Even among analysts warning about short-term volatility, the medium-term narrative remains bullish in much of today’s commentary—because the same forces that drove the 2025 surge aren’t clearly fading yet.
The important nuance: those upside projections don’t imply a smooth path. Silver is notorious for sharp corrections inside bull markets, and multiple analysts publishing this week have highlighted how quickly “stretched” conditions can unwind.
Silver’s appeal is also its danger: it often behaves like “gold with a turbocharger.” That’s great on the way up—until it isn’t.
One widely circulated warning in recent coverage: Barron’s highlighted research suggesting silver has reached historically extreme deviations versus major moving averages, conditions that in past cycles (like 2011 and 2020) were followed by steep pullbacks exceeding 20%. [25]
That doesn’t invalidate the bullish thesis—it simply reframes timing and risk. In practical terms, it means the next big move could be either:
Even in a holiday-shortened week, silver traders are watching a tight set of macro inputs because they feed directly into the dollar-rate-real-yield equation.
Across today’s Dec. 21 outlook pieces, the most-cited catalysts are:
And the most important market-structure point: because of the holidays, price action may be “subdued” at times—but paradoxically swings can be larger when participation is thin. That’s exactly why multiple analysts are warning about volatility even while staying constructive on trend. [30]
Silver is ending 2025 near record highs around $67/oz, backed by a narrative that blends Fed-cut expectations, strong industrial demand, and supply tightness with heavy investment flows. [31]
For the week ahead, the market is essentially split into two camps:
1. www.reuters.com, 2. www.theweek.in, 3. www.reuters.com, 4. www.reuters.com, 5. www.theweek.in, 6. www.reuters.com, 7. www.reuters.com, 8. www.reuters.com, 9. www.reuters.com, 10. www.reuters.com, 11. www.reuters.com, 12. www.fxleaders.com, 13. www.dailyforex.com, 14. www.theweek.in, 15. www.theweek.in, 16. www.moneycontrol.com, 17. timesofindia.indiatimes.com, 18. www.fxleaders.com, 19. www.theweek.in, 20. www.fxleaders.com, 21. www.marketpulse.com, 22. www.livemint.com, 23. www.reuters.com, 24. www.livemint.com, 25. www.barrons.com, 26. www.theweek.in, 27. www.fxleaders.com, 28. www.theweek.in, 29. www.moneycontrol.com, 30. www.theweek.in, 31. www.reuters.com, 32. www.fxleaders.com, 33. www.barrons.com
")


")
