The main category of Forex News.
You can use the search box below to find what you need.
[wd_asp id=1]
The main category of Forex News.
You can use the search box below to find what you need.
[wd_asp id=1]
– Written by
David Woodsmith
STORY LINK GBP/USD Forecast: Pound Sterling Holds above 1.32 ahead of Fed Minutes
The Pound US Dollar (GBP/USD) exchange rate moved modestly higher on Tuesday as a brighter mood across financial markets reduced demand for the safe-haven US Dollar.
At the time of writing, GBP/USD was trading at around $1.3239, having edged up slightly from Tuesday’s opening level.
Demand for the US Dollar (USD) eased on Tuesday as investors became more willing to move into riskier assets.
Wall Street’s technology-led rally helped lift broader market sentiment, while a retreat in oil prices offered further reassurance after elevated energy costs had contributed to recent concerns over inflation and global growth.
Despite Tuesday’s pullback, USD remained close to multi-month highs.
The US Dollar Index was hovering around 102.2 after gaining almost 1% during the previous week, while elevated US Treasury yields continued to provide the currency with a degree of underlying support.
Sterling (GBP) traded within a relatively narrow range on Tuesday morning as investors awaited comments from Bank of England (BoE) policymaker Catherine Mann.
Get better rates and lower fees on your next international money transfer.
Compare TorFX with top UK banks in seconds and see how much you could save.
Mann was one of three Monetary Policy Committee (MPC) members to vote for an immediate 25-basis-point rate increase at September’s meeting.
Her latest remarks could therefore attract considerable attention from GBP traders.
Any indication that she continues to favour higher borrowing costs could strengthen expectations for a November hike and provide another lift for Sterling.
Wednesday’s release of the minutes from the Federal Reserve’s September meeting is likely to provide the next significant catalyst for the Pound US Dollar (GBP/USD) exchange rate.
Investors will be looking for clues about how much support there is within the central bank for additional interest rate increases.
An especially hawkish set of minutes could revive some expectations for tighter policy, although a return to firm October hike bets appears unlikely.

Should the minutes instead reinforce the possibility of a December increase, the US Dollar could find some support.
Sterling’s gains may remain limited in the meantime, with traders likely to adopt a cautious stance ahead of Thursday’s busy schedule of BoE speakers, including Governor Andrew Bailey.
International Money Transfer? Ask our resident FX expert a money transfer question or try John’s new, free, no-obligation personal service! ,where he helps every step of the way,
ensuring you get the best exchange rates on your currency requirements.
TAGS: Pound Dollar Forecasts
Oil and fuel prices have surged since the US-Israeli war with Iran disrupted shipments through the Strait of Hormuz, which handled about 20% of global oil supplies before the conflict. Iran has also targeted regional energy infrastructure in retaliation for US military strikes.
Falling inventories and tight diesel supplies are expected to keep prices elevated. Brent is forecast to average about $105 a barrel in the fourth quarter, $14 above the EIA’s earlier estimate.
US retail diesel prices, which reached record highs last month, are projected to remain above $6 a gallon in October before gradually declining to an average of about $4.50 in 2027.
However, Middle Eastern oil production and exports are expected to recover gradually as transit through the Strait of Hormuz improves and producers increasingly use alternative export routes and ship-to-ship transfers.
As supply flows normalise and inventories rebuild, Brent is expected to average $84 a barrel in 2027, $10 above the agency’s previous forecast.
According to Reuters, regional oil flows have improved after Saudi Arabia resumed shipments through its East-West Pipeline to the Red Sea, bypassing the Strait of Hormuz. Exporters have also adapted to attacks on shipping and energy infrastructure through “dark transits,” in which tankers switch off their tracking systems before transferring cargo at sea.
These measures helped restore Gulf oil flows, excluding Iran, to more than 81% of pre-war levels in September.
As the workarounds expand, crude-production shutdowns are expected to decline from 4.5 million barrels per day in the fourth quarter of 2026 to 2.7 million barrels per day in the first quarter of 2027, the EIA said.
(Disclaimer: This article is based on inputs from agencies. These do not represent the views of The Economic Times)
USD/JPY remains stuck near resistance at 158.00 – 158.50 despite the pullback in Treasury yields. I’d note that USD/JPY has become less sensitive to Treasury yield dynamics in recent trading sessions.
Today, traders focused on BoJ Governor Ueda speech. Ueda said that BoJ would continue to raise the interest rate.
If USD/JPY climbs above the 158.50 level, it will move towards the next resistance level at 160.00 – 160.50. On the support side, a move below the 50 MA at 157.76 will push USD/JPY towards the 157.00 level. If USD/JPY settles below 157.00, it will head towards the support level at 155.00 – 155.50.
If you’d like to know more about how to trade forex, please visit our educational area.
Welcome, my fellow traders! I have prepared a price forecast for US Crude, XAUUSD, and EURUSD using a combination of the margin zones method and technical analysis. Based on the market analysis, I have identified entry signals for intraday traders.
Gold reached its second sell target today.
The article covers the following subjects:
The oil price is approaching last week’s low around 87.30. If the asset settles below this low, it may pierce the Target Zone of 88.79–87.46. In this case, the next bearish target will be the Gold Zone of 84.36–83.92.
Consider short trades during a pullback from resistance A at 92.18–91.74, with targets at 89.74 and 87.30.
Sell at resistance A at 92.18–91.74. TakeProfit: 89.74, 87.30. StopLoss: 93.25.
Today, gold reached 4,110, its second sell target. Currently, the price is correcting higher. The short-term trend remains bearish.
If the gold price climbs to resistance A at 4,217–4,206, one may consider short trades, targeting 4,160 and 4,104.
Sell at resistance A at 4,217–4,206. TakeProfit: 4,160, 4,104. StopLoss: 4,243.
The euro is trading in a correction phase within a short-term downtrend. If it tests the resistance zone A at 1.1253–1.1245 during the correction, short positions can be considered, with the first target at 1.1207 and the second at 1.1161.
If the price falls below yesterday’s low, resistance A should be adjusted.
Sell near resistance A at 1.1253–1.1245. TakeProfit: 1.1207, 1.1161. StopLoss: 1.1274.
Would you like to learn more about technical analysis methods and principles? Explore our comprehensive guide.
P.S. Did you like my article? Share it in social networks: it will be the best “thank you” 🙂
Useful links:
The content of this article reflects the author’s opinion and does not necessarily reflect the official position of LiteFinance broker. The material published on this page is provided for informational purposes only and should not be considered as the provision of investment advice for the purposes of Directive 2014/65/EU.
According to copyright law, this article is considered intellectual property, which includes a prohibition on copying and distributing it without consent.
The first chart I’m watching is the U.S. 2-year yield. It is dropping a little bit during the trading session. That could provide a little bit of relief for some risk appetite-based assets. We’ll just have to wait and see. But right now, it is still elevated, so I think anti-U.S. dollar sentiment is probably somewhat short-lived.
It is not until the 28th that we roll over into the December contract. At that point, we really start to talk about people in the United States burning natural gas 24 hours a day. Until we get to that point, it is a little bit of a buy-the-dip opportunity, but it is also a market that probably has somewhat limited upside.
European LNG purchases this year could be a major story. We will just have to wait and see whether or not natural gas gets from Qatar to the EU. So far, it looks like that fear might be alleviated, but that is a wild card out there.
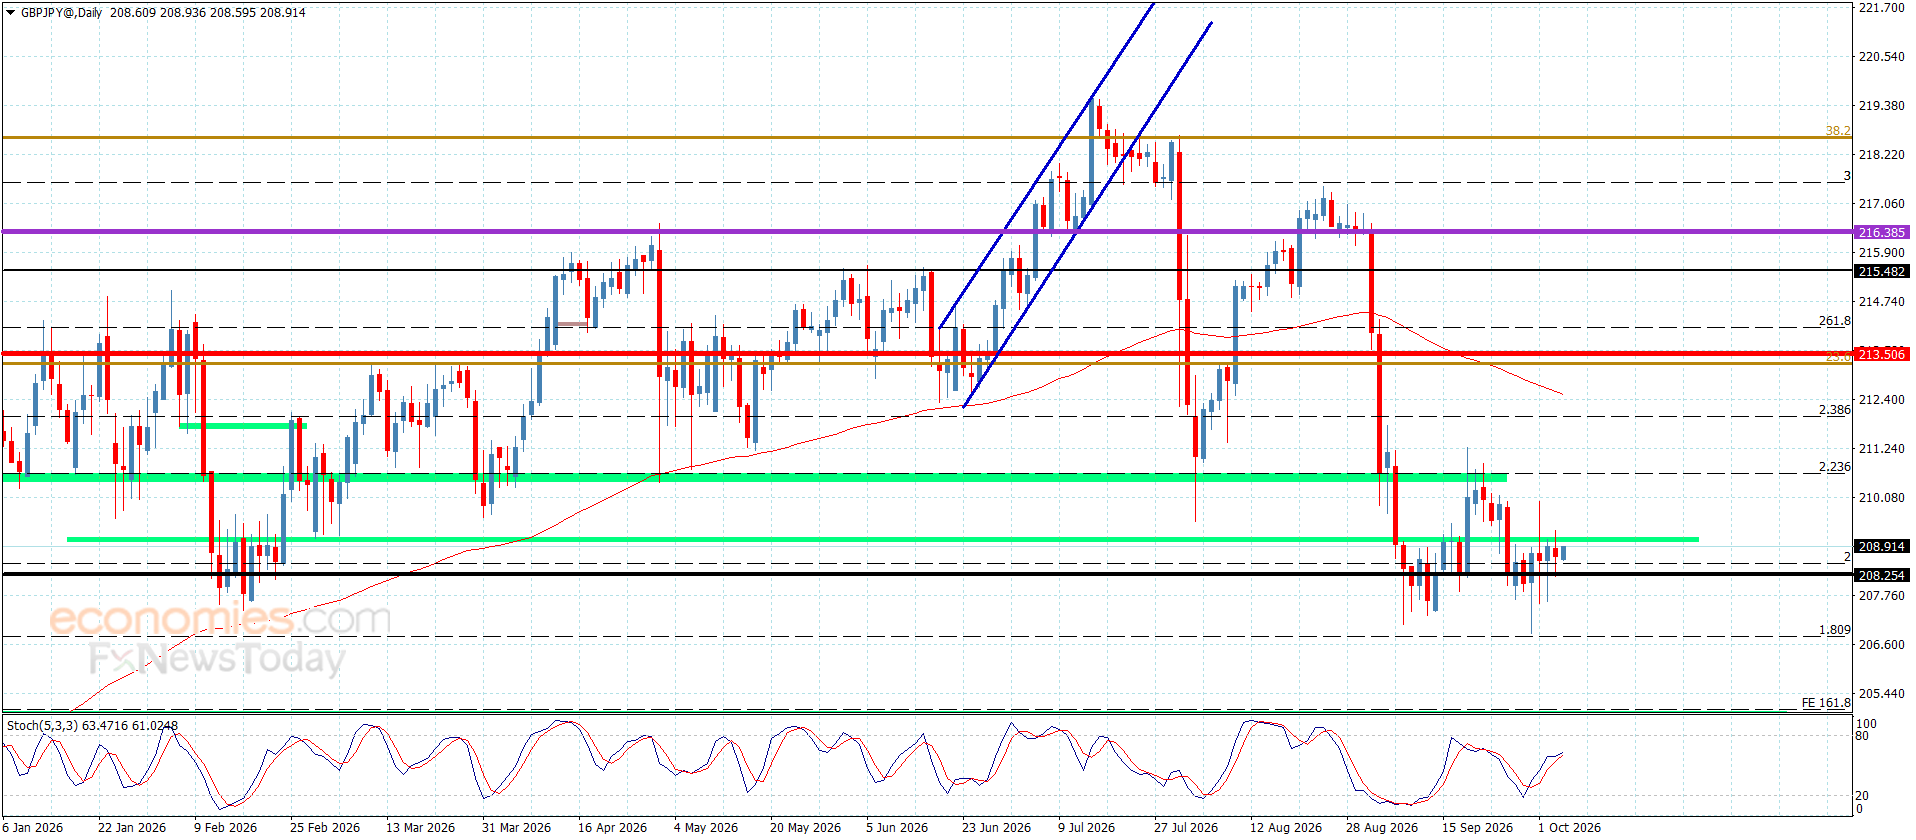
There is no change on the temporary sideways moves of GBPJPY pair, to fluctuate near 209.00 level due to the continuation of the main indicators’ contradiction, which obstacles the chances of resuming the main bearish trend, the sideways trading might continue temporarily until gathering negative momentum, attempting to press on 208.10 barrier, which extend the trading towards the main negative stations near 206.80 and 206.25.
While the risk of changing the negative trend and begin building a bullish path, which requires surpassing 210.45 and holding above it, to begin recording several gains to expect forming an initial station at 211.35.
The expected trading range for today is between 208.10 and 209.55
Trend forecast: Bullish
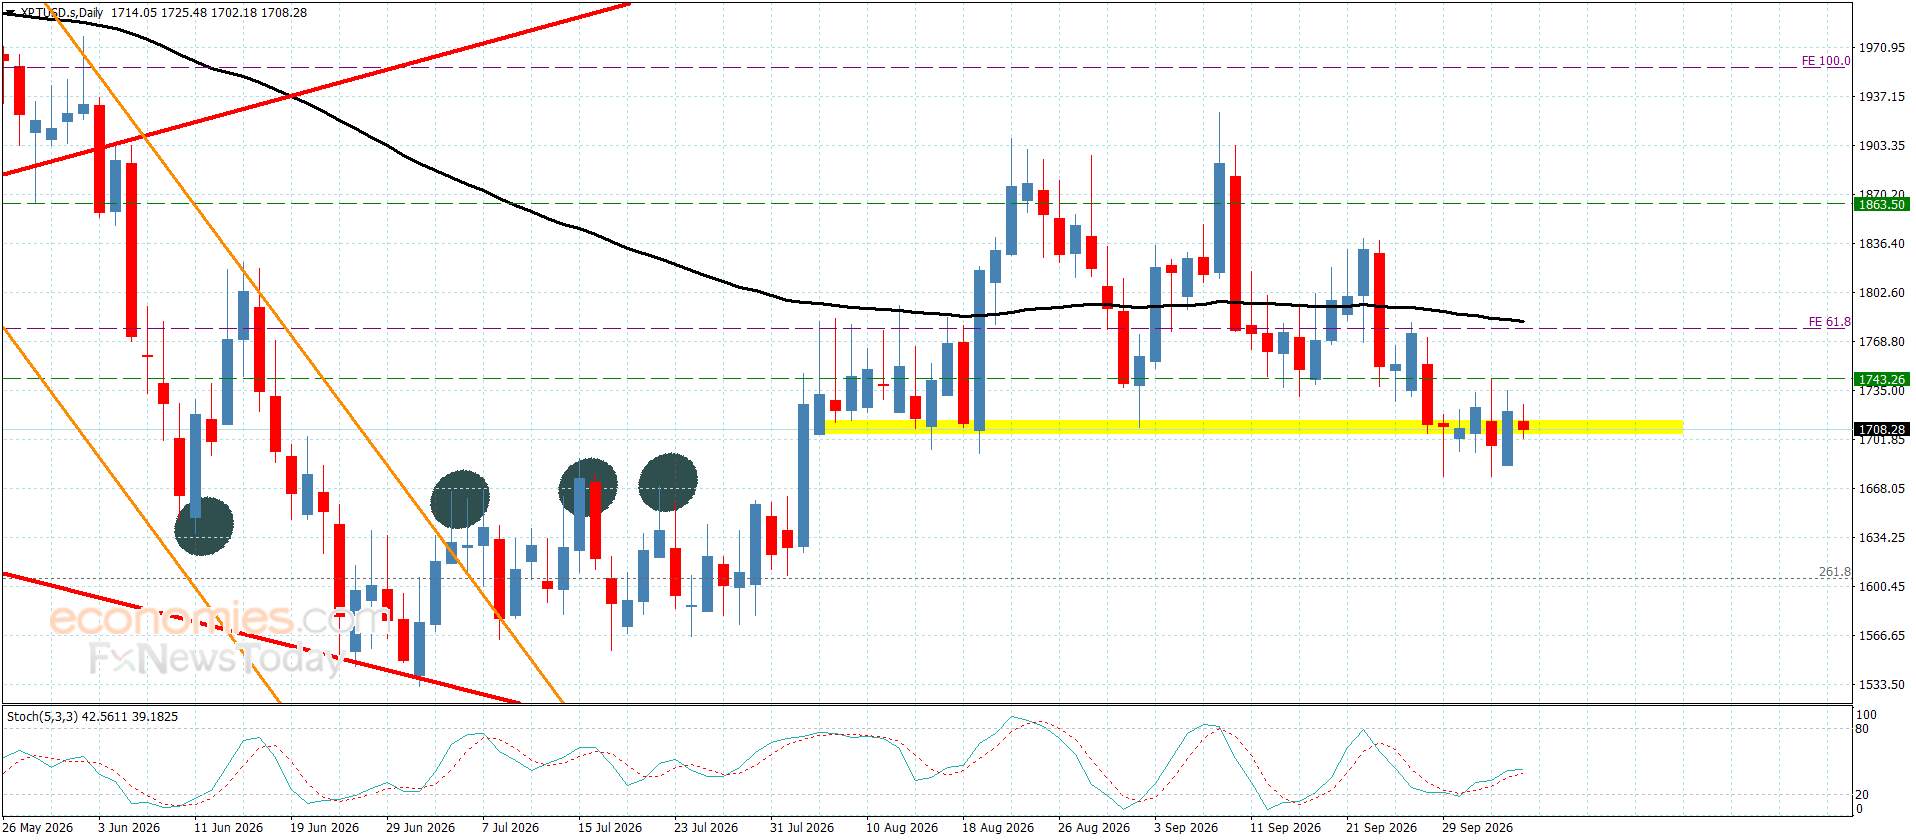
Platinum price remains stable near the extra support at $1705.00, affected by the contradiction of the main indicators, however, the stability below $1840.00 barrier makes us wait to confirm the breakout, to begin forming strong bearish waves, to target $1660.00 and $1605.00.
While breaching the previously mentioned barrier and holding above it will confirm recovering the bullish trend, to expect targeting several positive stations that might begin at $1880.00 and $1950.00.
The expected trading range for today is between $1660.00 and $1740.00
Trend forecast: Bearish
EUR/JPY halts its seven-day losing streak, trading around 177.40 during Asian hours on Tuesday. Technical analysis of the daily chart shows that the currency cross is remaining close to the lower boundary of the descending channel, suggesting the price holds support and a temporary bounce. However, a break below the channel would signal accelerating downward momentum in a steeper downtrend.
The EUR/JPY cross is maintaining a bearish tone as it holds beneath both the nine- and 50-period Exponential Moving Averages (EMAs). The currency cross has recently slipped below the nearer structural floor at 175.70, turning recent price action into a corrective phase, while the 14-day Relative Strength Index (RSI) at 29.78 hovers in oversold territory, hinting that while downside pressure is strong, fresh selling could become more measured in the short term.
The initial support lies at the lower boundary of the channel around 176.60, followed by an 11-month low of 175.70, recorded in November 2025. Further support lies at the 14-month low of 169.72.
On the upside, the EUR/JPY cross may rebound and test the nine-day EMA at 178.18, followed by the 50-day EMA at 181.20. Further resistance lies at the upper boundary of the descending channel around 184.20, followed by the all-time high of 187.95 set on April 17.
Analysts at Commerzbank argue that the ECB has scope to ease market tensions through communication before resorting to more forceful tools. They note that, despite elevated inflation, ECB representatives could “adopt a less hawkish tone in their public comments, thereby dampening expectations of interest-rate hikes and easing pressure on government bonds.” In their view, Christine Lagarde’s recent appearance before the European Parliament’s Committee on Economic and Monetary Affairs already points in this direction, as she stressed that “the sharp rise in bond yields would dampen economic growth and limit the pass-through of higher energy costs to consumers,” signalling greater sensitivity to the impact of tighter financing conditions.
(The technical analysis of this story was written with the help of an AI tool. Know more.)
The table below shows the percentage change of Euro (EUR) against listed major currencies today. Euro was the strongest against the Japanese Yen.
| USD | EUR | GBP | JPY | CAD | AUD | NZD | CHF | |
|---|---|---|---|---|---|---|---|---|
| USD | 0.05% | 0.10% | 0.16% | 0.03% | 0.01% | 0.04% | 0.10% | |
| EUR | -0.05% | 0.00% | 0.07% | -0.02% | -0.02% | -0.01% | 0.06% | |
| GBP | -0.10% | -0.00% | 0.08% | -0.04% | -0.02% | -0.02% | 0.08% | |
| JPY | -0.16% | -0.07% | -0.08% | -0.11% | -0.12% | -0.08% | -0.01% | |
| CAD | -0.03% | 0.02% | 0.04% | 0.11% | -0.02% | 0.00% | 0.09% | |
| AUD | -0.01% | 0.02% | 0.02% | 0.12% | 0.02% | 0.00% | 0.11% | |
| NZD | -0.04% | 0.00% | 0.02% | 0.08% | -0.00% | -0.01% | 0.10% | |
| CHF | -0.10% | -0.06% | -0.08% | 0.00% | -0.09% | -0.11% | -0.10% |
The heat map shows percentage changes of major currencies against each other. The base currency is picked from the left column, while the quote currency is picked from the top row. For example, if you pick the Euro from the left column and move along the horizontal line to the US Dollar, the percentage change displayed in the box will represent EUR (base)/USD (quote).
Disclaimer: For information purposes only. Past performance is not indicative of future results.
U.S. Dollar Index gains ground as traders react to ISM Services PMI report. The report showed that ISM Services PMI declined from 55.4 in August to 54.9 in September, compared to analyst forecast of 55. Numbers above 50 show expansion. The weaker-than-expected report did not put any pressure on the American currency.
Currently, U.S. Dollar Index is trying to settle above the resistance level at 102.35 – 102.50. In case U.S. Dollar Index manages to settle above the 102.50 level, it will head towards the next resistance, which is located in the 103.35 – 103.50 range.