The main category of Forex News.
You can use the search box below to find what you need.
[wd_asp id=1]
The main category of Forex News.
You can use the search box below to find what you need.
[wd_asp id=1]
The GBP/USD forecast indicates an increasing likelihood of a Fed rate cut in September, which is weighing on the dollar. Meanwhile, the pound remained steady as bets for another Bank of England rate cut this year have decreased following upbeat UK wholesale inflation.
–Are you interested in learning more about crypto robots? Check our detailed guide-
Rate cut bets increased after Fed’s John Williams said a rate cut was possible. However, he noted that the outlook would largely depend on the upcoming economic releases. His remarks pushed traders to price an 89% chance of the central bank cutting in September.
The story is different in the UK, where traders are only pricing a 40% chance of another Bank of England rate cut this year. Data revealed that wholesale inflation in the UK hit a two-year high of 1.9%. This came after consumer inflation also jumped. As a result, policymakers have assumed a more cautious tone about future rate cuts.
“A more persistent hold on Bank Rate is appropriate right now, to maintain the tight-but-not-tighter monetary policy stance needed to lean against inflation persistence,” Bank of England Monetary Policy Committee member Catherine Mann said in remarks released by the BoE on Tuesday.

On the technical side, the GBP/USD price trades above the 30-SMA with the RSI in bullish territory above 50. This indicates that bulls are currently in the lead. However, the price is still not making higher highs and lows.
–Are you interested in learning more about buying Dogecoin? Check our detailed guide-
The trend recently shifted from bullish to bearish after meeting the key resistance level at 1.3575. However, bears were unable to break below a solid support zone comprising the 0.382 Fibonacci level and the 1.3401 level. Here, the price made a solid bullish candle that broke above the SMA. It showed a surge in momentum. Although bulls struggled to maintain the price above the SMA, they produced another strong candle, indicating solid bullish momentum.
The price is now targeting the 1.3575 resistance level. A break above will make a higher high, continuing the previous uptrend. It will also solidify the bullish trend.
Looking to trade forex now? Invest at eToro!
68% of retail investor accounts lose money when trading CFDs with this provider. You should consider whether you can afford to take the high risk of losing your money.
Copper price faced stochastic negativity by its stability above the extra support at $4.2600, keeping the chances for renewing the bullish attempts, while gathering the bullish momentum makes us expect targeting $4.6200, pressing on the barrier near $4.7500 to find an exit to resume the bullish attempts.
While the risk of changing the main trend is represented by forming a sharp decline, to settle below the support of the bullish channel towards $4.0750, which forces it to suffer several losses by reaching $3.9200 initially.
The expected trading range for today is between $4.3000 and $4.6200
Trend forecast: Bullish
The yen pair continues to trade inside a tight consolidation between 146.20 and 148.80, digesting August’s sharp rally. Neither side has managed to force a breakout, reflecting investor caution as two key forces converge:
UBS has already revised forecasts lower, projecting USD/JPY toward the 142–140 range by mid-2026. But in the near term, traders are waiting for the first decisive move out of this consolidation box.
The unprecedented removal of Fed Governor Lisa Cook by Trump injected fresh volatility. Markets are now questioning whether monetary policy decisions are being driven by political pressure rather than independence, a narrative that undermines the dollar’s safe-haven appeal.
Friday’s U.S. releases – Core PCE Price Index, Personal Spending, and Personal Income – are highly anticipated. PCE is the Fed’s preferred inflation gauge, and combined with spending/income trends, it will heavily influence policy expectations.
This data could be the decisive trigger that resolves USD/JPY’s consolidation, especially given its proximity to the FOMC meeting.
|
News Event |
Description |
Impact on USD/JPY |
|---|---|---|
|
Fed Political Turmoil |
Governor dismissal shakes credibility |
Weakens USD, favors yen |
|
Policy Divergence |
Dovish Fed vs. steady BOJ |
Yen strength in risk-off |
|
UBS Forecasts |
Sees USD/JPY into 140s by 2026 |
Reinforces long-term bearish tilt |
|
Core PCE, Spending, Income |
Key inflation/consumption data |
Likely breakout trigger |
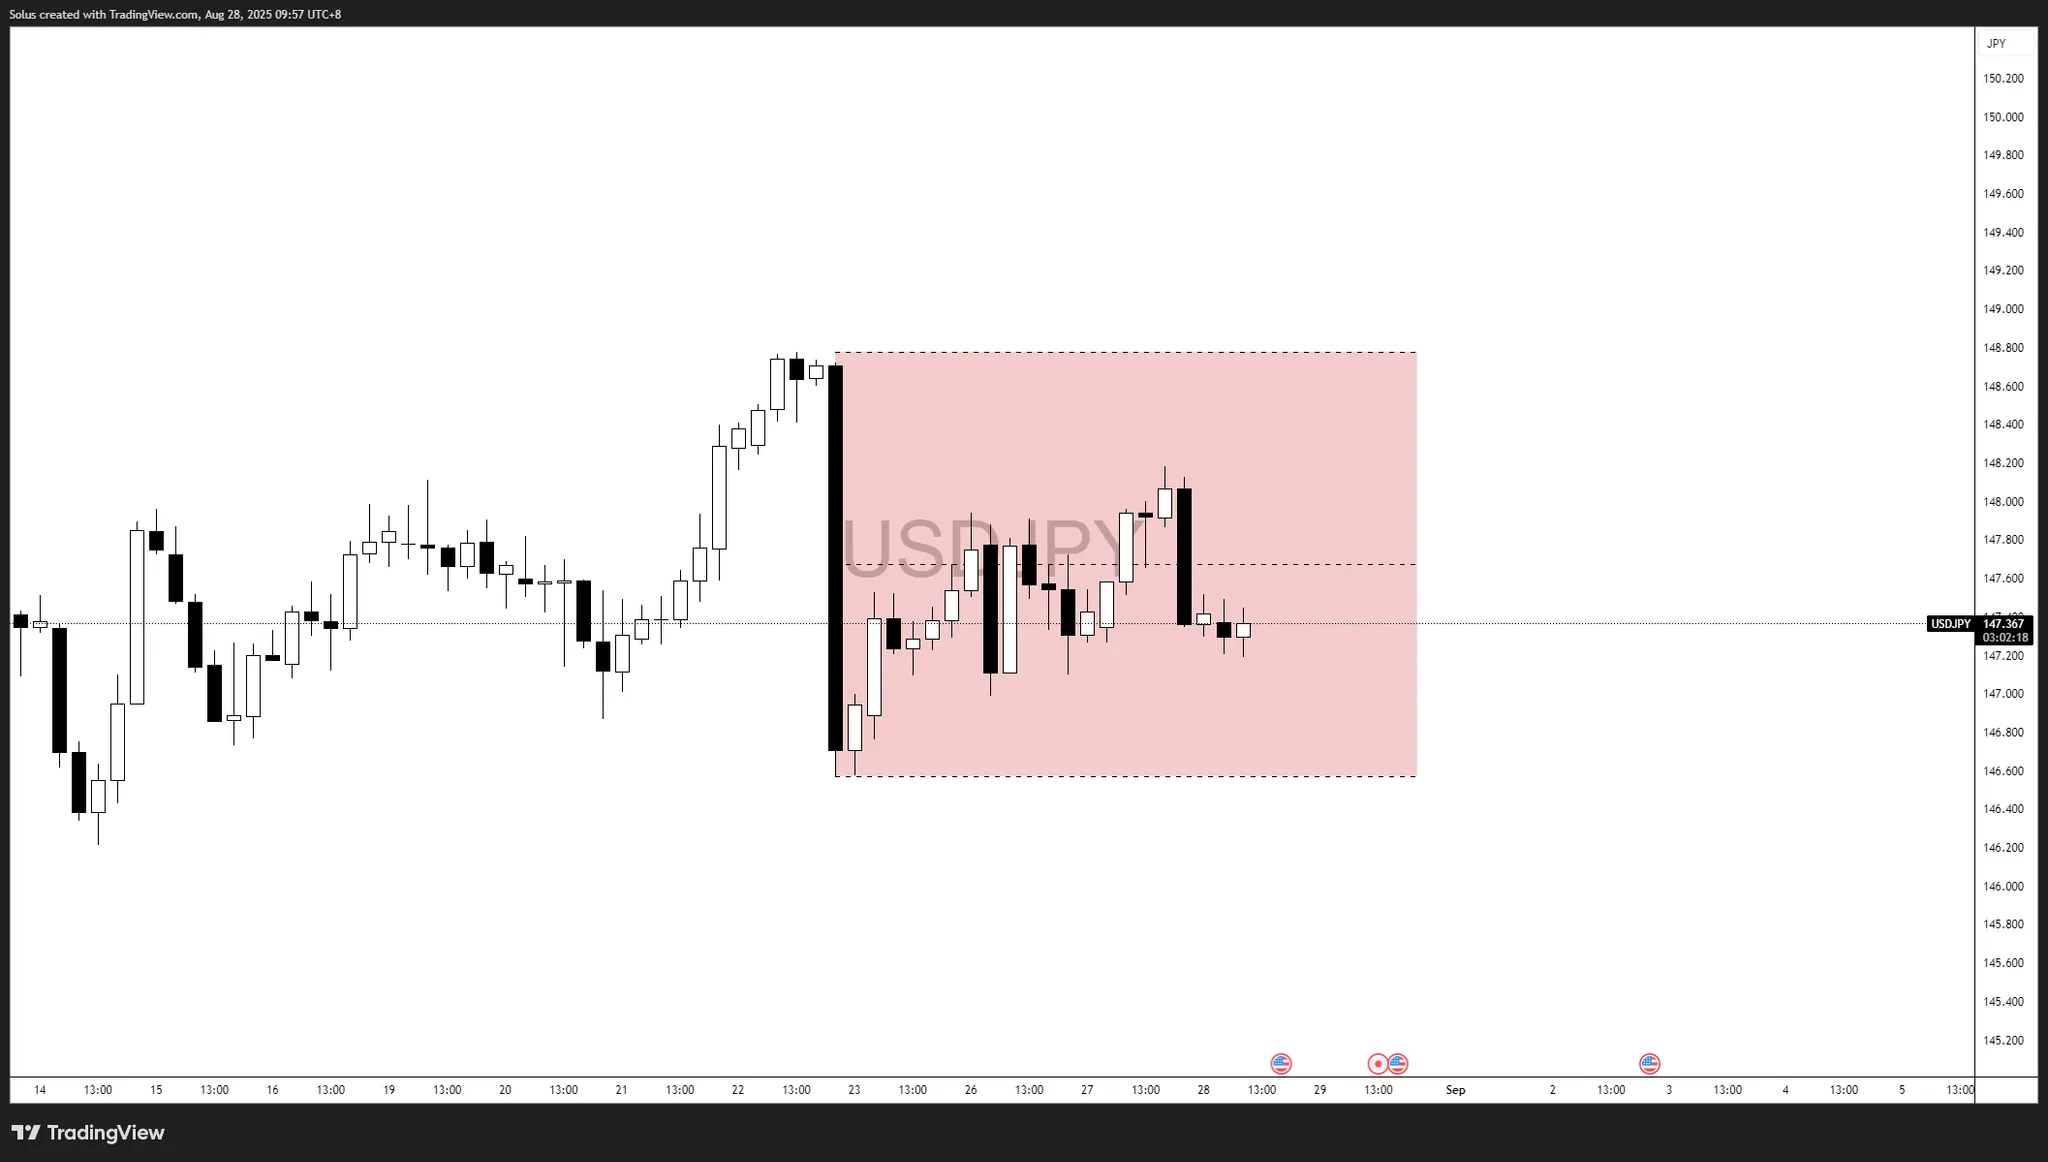
USD/JPY is consolidating in a 146.20 – 148.80 box, with mid-range support at ~147.30 acting as balance. The next breakout will likely coincide with Friday’s data or FOMC expectations.
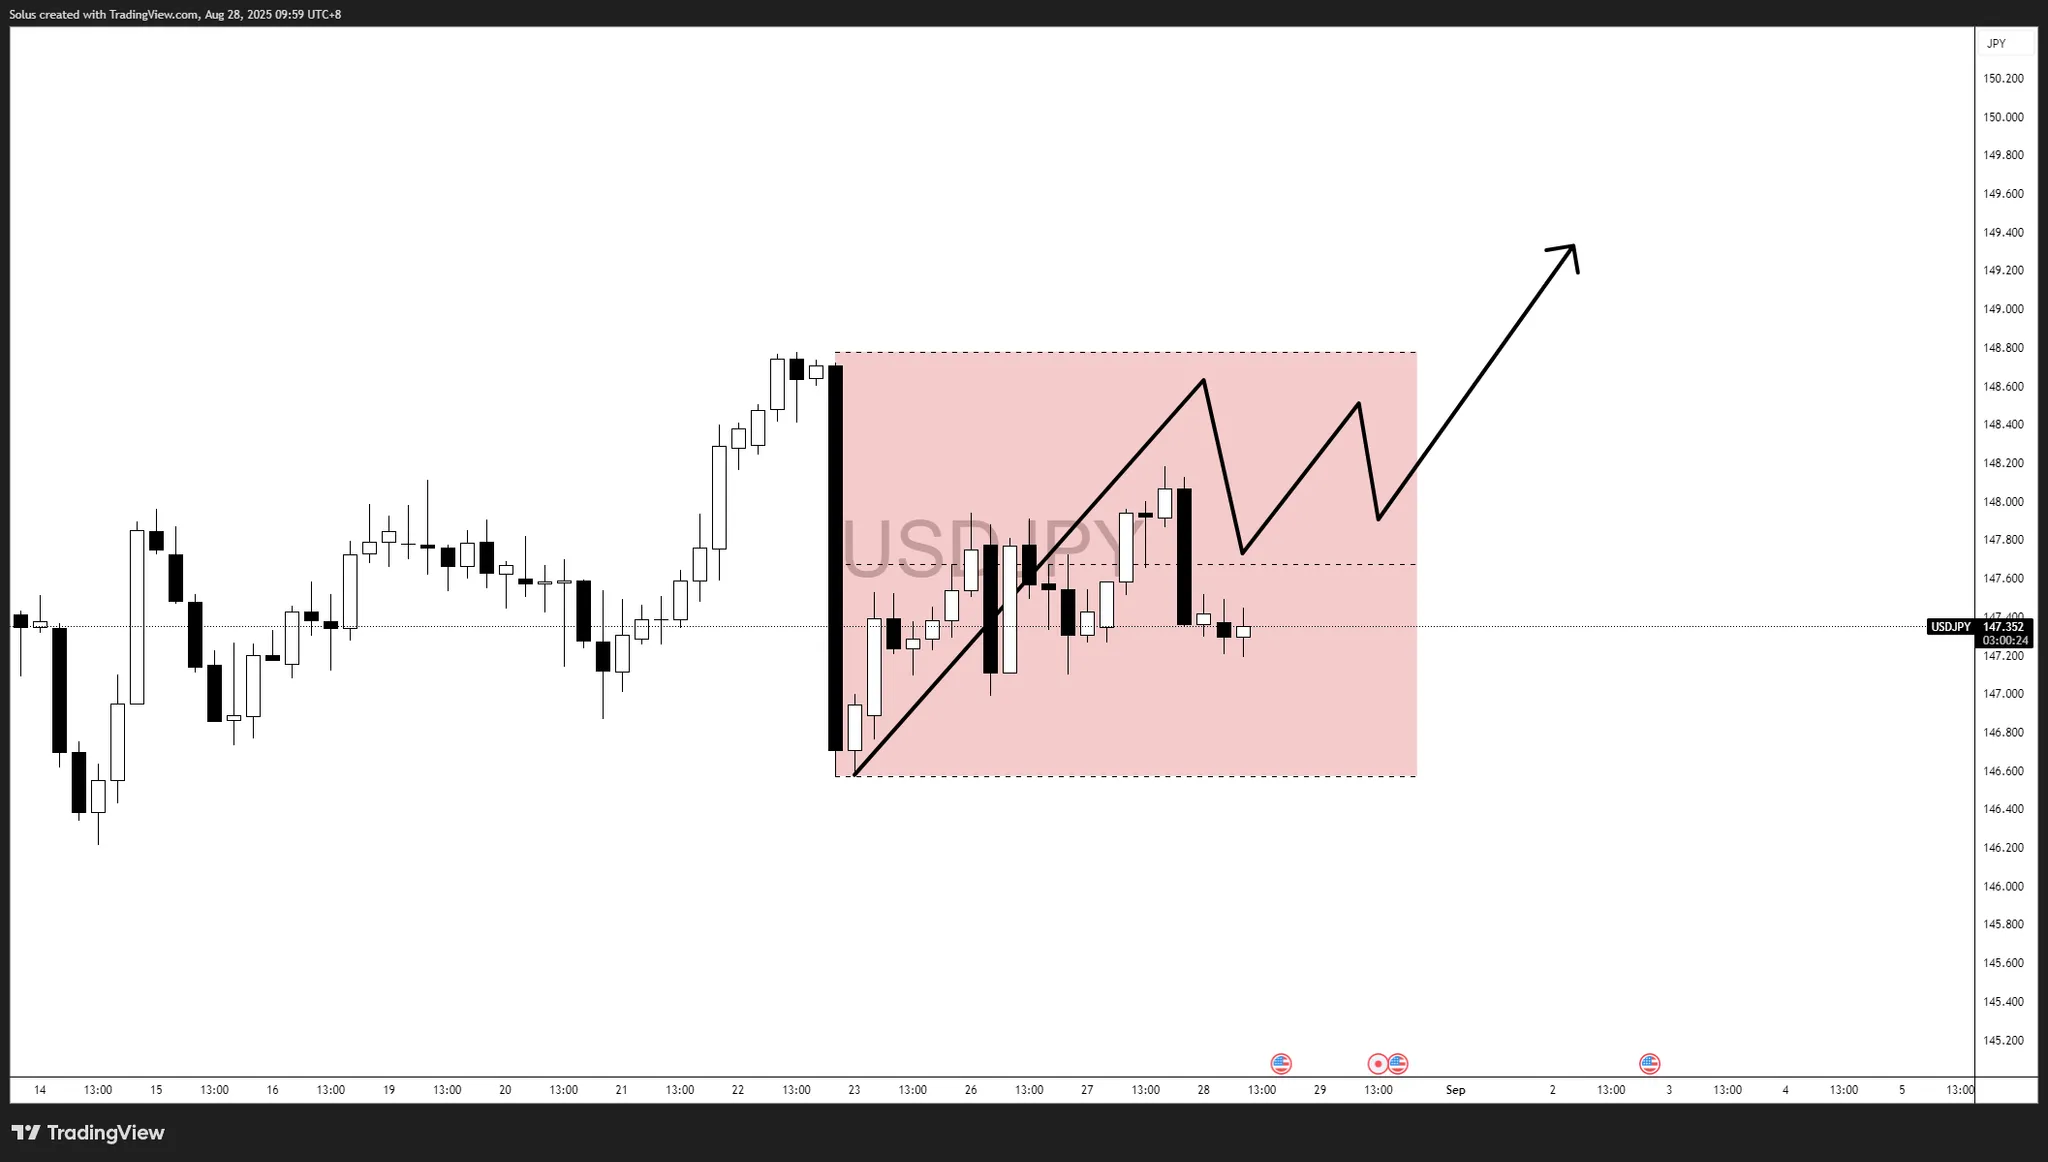
If buyers defend the 147.20–147.40 mid-range and push price through the 148.80 ceiling, momentum could extend the August rally.
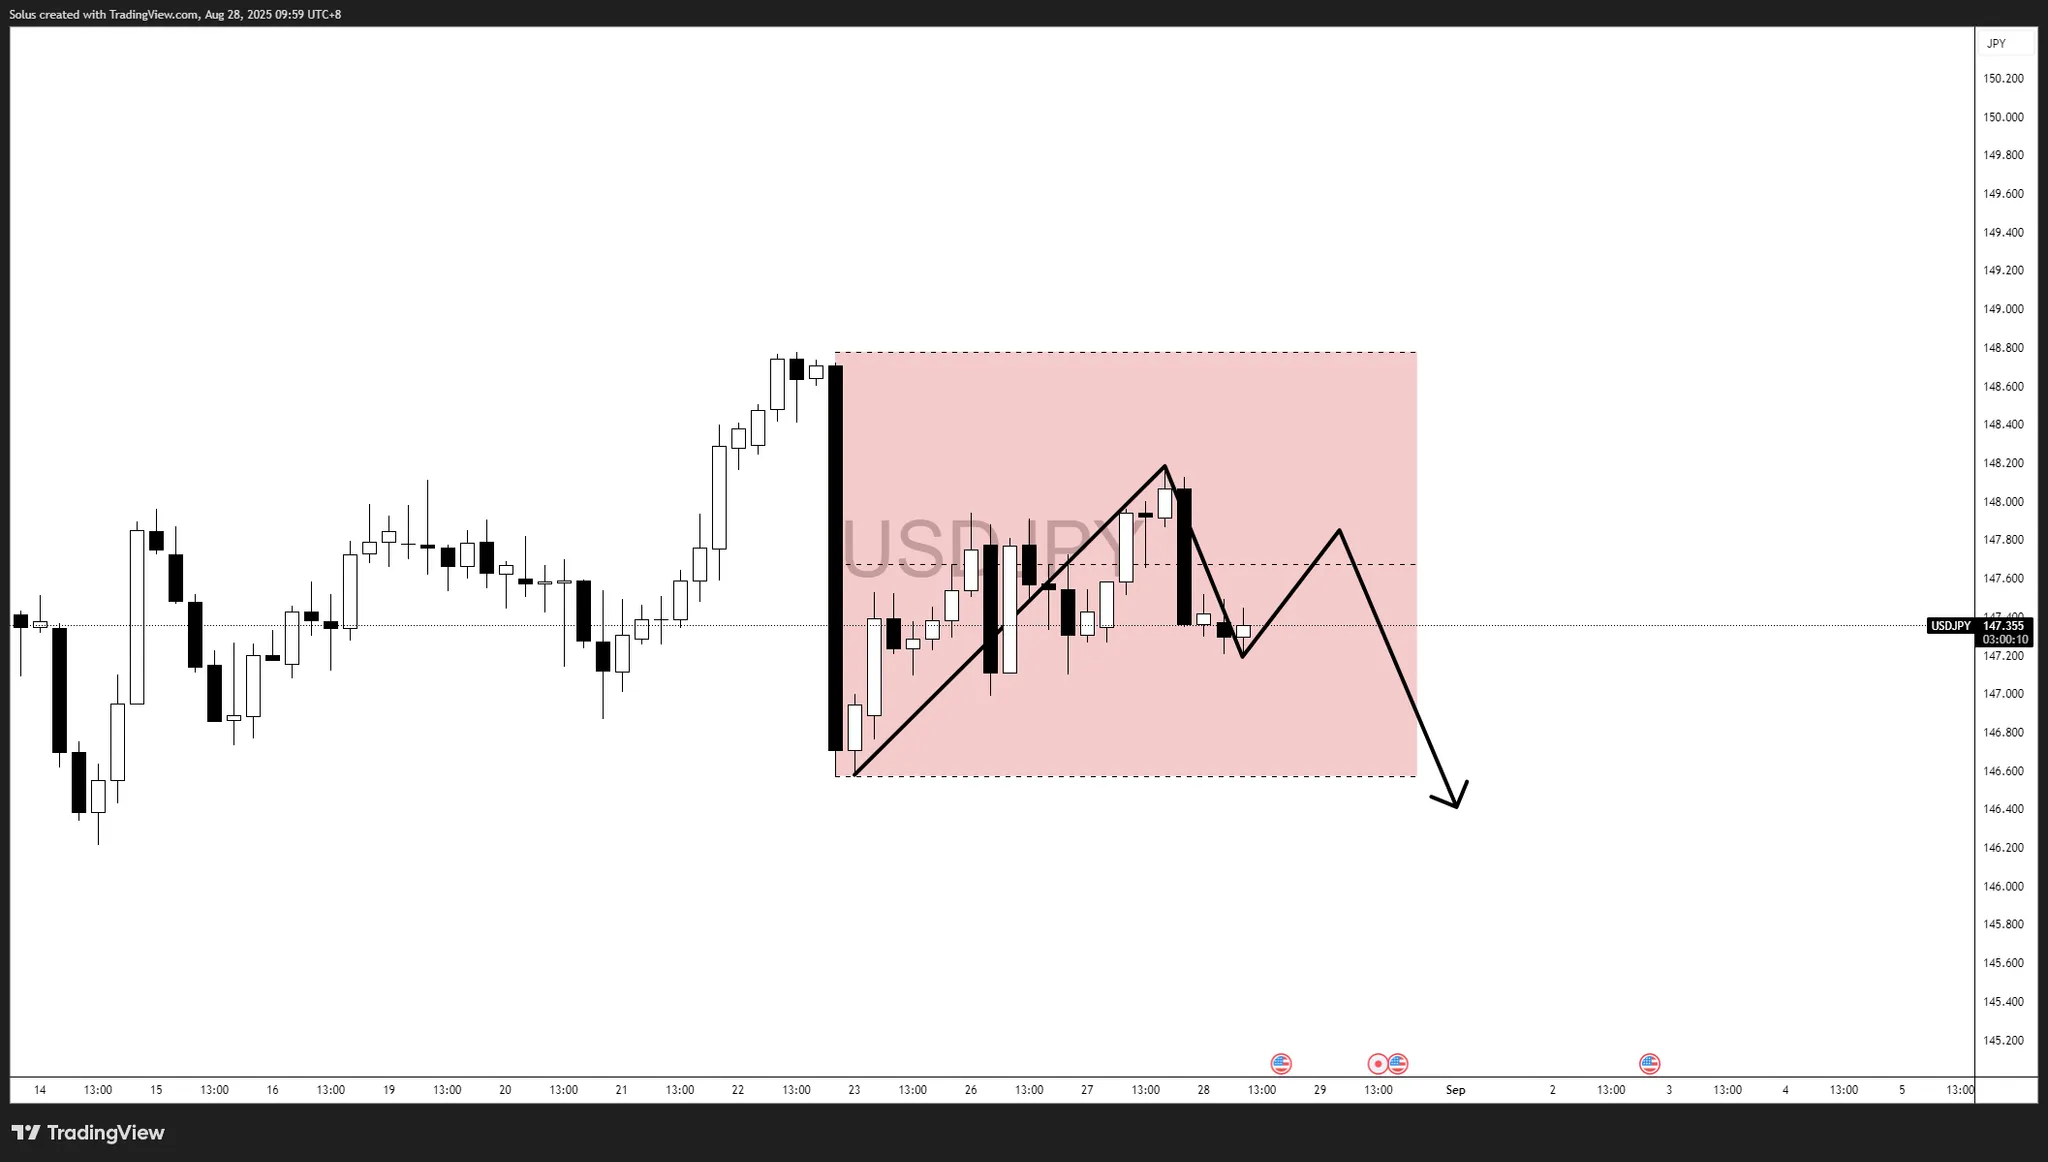
If price fails to hold the midpoint and momentum turns lower, USD/JPY could slide back to the 146.20 support floor. A breakdown there would confirm bearish expansion.
USD/JPY is coiled inside a 146.20–148.80 range, awaiting its breakout trigger. Two forces now dominate the outlook:
With political pressure on the Fed undermining the dollar and Core PCE inflation data looming, a breakout is imminent.
Traders should brace for volatility, liquidity sweeps, and false breaks around Friday’s PCE release. Patience and confirmation remain key.
Gold has been consolidating within the triangle for weeks, reflecting a pause in trend before a decisive move. Given its proximity to the pattern’s apex, a breakout is likely within the next week or so. The expectation is for an eventual upside resolution, consistent with the longer-term bullish trend. However, traders should remain aware that short-term consolidations often occur near breakout points, which could delay a sustained advance.
Should an upside breakout occur, higher initial targets include the $3,500 record high, followed by $3,578. A decisive move through that zone could trigger renewed momentum and signal a continuation of gold’s multi-month bull run. The 20-Day moving average is trending higher beneath price, providing technical support for buyers as the market approaches this key resistance test.
While the technical setup leans bullish, the potential for a failed breakout must be considered. A rejection at resistance or decline back into the triangle following a breakout, could weigh on sentiment. The key support levels to watch are the lower boundary of the pattern and the recent swing low at $3,311. Any close below those levels would weaken the bullish outlook and potentially delay new record high attempts.
A bullish weekly reversal has already been confirmed this week with the move above $3,379. If gold closes the week above that level, the reversal signal will stand on the higher timeframe. This would reinforce the probability of an upside-breakout from the triangle and strengthen the case for a longer-term continuation toward new highs.
For a look at all of today’s economic events, check out our economic calendar.
– Written by
David Woodsmith
STORY LINK Euro to Dollar Forecast: EUR/USD Vulnerable Despite Powell’s Dovish Shift
The Euro to Dollar (EUR/USD) exchange rate forecast remains fragile after the single currency slipped to fresh lows near 1.1575 on Wednesday before stabilising into the New York open.
Political turmoil in Europe, including renewed fears over France’s government, continues to weigh on the euro, while the US dollar has held firm despite growing concerns about Federal Reserve independence.
Analysts remain split, with some warning of further losses toward 1.14, while others still see scope for EUR/USD to rebound toward 1.17 and even 1.20 over the medium term.
The Euro has not been able to gain any traction on Wednesday and dipped to lows around 1.1575 before stabilising at the New York open.
The Euro has been undermined by on-going European concerns while the dollar has been resilient despite on-going unease surrounding the Administration attempts to gain greater control of the Federal Reserve.
According to UoB; “we expect EUR to trade in a range between 1.1580 and 1.1745 for now.”
Get better rates and lower fees on your next international money transfer.
Compare TorFX with top UK banks in seconds and see how much you could save.
Scotiabank notes the potential risk of a slide to 1.14, but added; “We remain neutral—for now— looking to a near-term range bound between 1.1550 support 1.1650 resistance.”
ING expects that the Euro can rebound; “We think EUR/USD can ultimately make its way back to 1.170.
Danske Bank expects a medium-term EUR/USD move to above 1.20.
Markets are continuing to monitor the French political situation and the bond market.
According to Rabobank; “the risk has grown substantially that France’s government will fall, which would also raise the risk that the 2026 budget will not include any material spending cuts.”
It added; “The coming days will tell if Bayrou can work the opposition parties to get them on board. The Socialists have said that it’s “inconceivable” that they will vote in favour of the government, but they seem to be the prime minister’s best chance for survival at this point.”
Scotiabank also noted European concerns; “Political uncertainty in Europe appears to be broadening as the Dutch government faces a no confidence vote ahead of an election scheduled for October. French bond markets look to have stabilized somewhat following Tuesday’s announcement of a September 8 confidence vote, however the country’s yields remain elevated as French-German yield spreads continue to widen.”

As far as the US economy is concerned, the consumer confidence index edged lower to 97.4 for August from 98.7 previously, but above consensus forecasts of 96.4.
Stephanie Guichard, Senior Economist, Global Indicators at The Conference Board commented; “The present situation and the expectation components both weakened. Notably, consumers’ appraisal of current job availability declined for the eighth consecutive month.”
According to Rabobank; “Given Powell’s dovish lean at Jackson Hole and the recent repricing of the Fed, we are reluctant to chase the USD weaker in the near term, with downside risks to yields now looking more limited.”
Nevertheless, it added; “Strategically, we continue to recommend selling into rallies, consistent with our view that the USD remains on a downward trajectory over the medium term.”
International Money Transfer? Ask our resident FX expert a money transfer question or try John’s new, free, no-obligation personal service! ,where he helps every step of the way,
ensuring you get the best exchange rates on your currency requirements.
TAGS: Euro Dollar Forecasts
In addition to the 20-Day moving average, natural gas faces resistance at last week’s high of $2.92. A close above that level would trigger a one-week bullish reversal signal. If successful, the next obstacle lies at $2.97, an interim swing high that coincides with resistance identified by an anchored volume weighted average price (AVWAP). This AVWAP level was previously support until early August, suggesting a strong reaction could emerge on the first test as resistance.
The bullish wedge pattern projects upside targets at $3.15 and $3.19, depending on how the beginning of the wedge is measured. However, before those objectives can be reached, natural gas must push through lower resistance levels. The 50-Day moving average, now at $3.21 and trending lower, presents another hurdle. Since it failed as support in early-July, a first retest as resistance may prove difficult to overcome. Its potential convergence with a long-term uptrend line increases the significance of this potential barrier if price advances that far.
The falling wedge represented a tight consolidation with waning bearish momentum. Sellers were unable to drive a deeper decline, and buyers ultimately gained control. While Wednesday’s breakout is only the first sign of a potential trend shift, it sets the stage for further upside attempts. Follow-through strength above $2.92 and $2.97 will be essential to confirm the breakout and establish a stronger bullish tone.
For a look at all of today’s economic events, check out our economic calendar.
– Written by
Tim Boyer
STORY LINK Pound to Dollar Price Forecast: Can GBP/USD Hold Ground before US GDP Data?
The Pound US Dollar exchange rate dipped on Wednesday as a downbeat sentiment swept markets.
At the time of writing, GBP/USD was trading at approximately $1.3436, down roughly 0.3% from the start of Wednesday’s session.
The US Dollar (USD) pushed higher through Wednesday’s session, overcoming renewed political unease linked to the Federal Reserve.
Fresh reports suggesting that Donald Trump intends to oust Fed Governor Lisa Cook reignited worries about political interference at the central bank this week.
While such developments often sap confidence in the Dollar, the currency was instead buoyed by its safe-haven appeal as investors sought stability amid fragile global sentiment.
This resilience allowed USD to make notable gains against several peers, with traders favouring the ‘Greenback’ despite the uncertainty hanging over the Fed.
The Pound (GBP) saw a patchy performance on Wednesday, making modest gains against some currencies while remaining steady against others, after the UK’s latest CBI distributive trades survey was published.
Get better rates and lower fees on your next international money transfer.
Compare TorFX with top UK banks in seconds and see how much you could save.
Retail activity continued to show signs of contraction, but the index slightly exceeded expectations, rising from -34 to -32 instead of the anticipated -33.
The small upside provided Sterling with limited support, helping the Pound maintain a generally steady tone across major currencies during mid-week trade.
Looking ahead to Thursday’s European session, the focus for GBP/USD will shift firmly onto the upcoming release of the US’s second-quarter GDP estimate.
Markets are expecting a rebound in growth, with forecasts pointing to a stronger reading following the slowdown earlier in the year.
If the data meets or exceeds expectations, it could reinforce confidence in the resilience of the US economy and provide fresh support for the ‘Greenback’.
Turning to the Pound, the UK data calendar remains relatively barren, leaving Sterling without a strong domestic driver.
This absence of fresh UK data means the Pound is likely to take its cues from broader market mood, limiting the scope for any major upside as the week progresses.
International Money Transfer? Ask our resident FX expert a money transfer question or try John’s new, free, no-obligation personal service! ,where he helps every step of the way,
ensuring you get the best exchange rates on your currency requirements.
TAGS: Pound Dollar Forecasts
Gold (XAU/USD) opened the midweek session at $3,443 per ounce, briefly pushing higher before retracing to around $3,380. The shift followed a resilient U.S. dollar advance, which pressured commodities broadly. Despite this, gold remains elevated, holding close to its August peaks and still showing a staggering 36.9% yearly gain compared with $2,504 per ounce a year earlier. The consolidation is being read as a battle between dollar strength and political risk, with the Trump–Federal Reserve feud dominating headlines. The removal of Fed Governor Lisa Cook raised questions about central bank independence, amplifying safe-haven flows and keeping gold attractive above the $3,360–$3,394 range, where technical support remains firm.
In futures trading, December contracts last traded at $3,424, down $9.00 intraday, while spot prices hovered just under $3,390. In Asia, local reference rates in the Philippines reflected the global softness: PHP 6,205.28 per gram, PHP 72,377 per tola, and PHP 193,005 per troy ounce, all slightly below Tuesday levels. Regionally adjusted gold pricing, tied to the USD/PHP cross, highlights how currency shifts amplify or cushion international trends. For example, while global XAU/USD eased, domestic buyers in peso terms still faced prices well above historical averages.
Charts show a well-defined symmetrical triangle forming between $3,288 support and $3,440 resistance. Current trading near $3,380 places gold in the center of this consolidation. On the daily frame, the 50-day EMA at $3,373 continues to rise, providing dynamic support that has acted as a trendline for several months. Resistance levels are stacked at $3,394, $3,410, and $3,433, while downside markers sit at $3,344 and $3,314. Momentum readings remain constructive: RSI near 58 has room to climb before overbought conditions, while MACD is approaching a bullish crossover at zero. Traders warn the next decisive candle could determine whether gold extends toward $3,500–$3,800 or slides back to retest $3,288.
The Federal Reserve remains the single most important catalyst for the gold market. Inflation in July stood at 2.7% year over year, above the Fed’s 2% target, yet Powell’s Jackson Hole comments signaled potential rate cuts as soon as September. Futures markets show an 87% probability of at least a 25-basis-point cut, up from 84% the prior day. Lower real yields historically act as a tailwind for non-interest-bearing assets like gold, aligning with analysts projecting higher prices into Q4. J.P. Morgan Research has set a year-end target of $3,675, with upside toward $4,000 by Q2 2026 if easing continues.
Global central banks continue to stockpile bullion at record levels. Purchases surpassed 1,000 metric tons in 2024, and demand has remained strong in 2025 as institutions diversify away from the U.S. dollar. This institutional floor has been one of the clearest drivers of gold’s resilience above $3,300. On the geopolitical side, Trump’s tariffs on 55% of Indian exports to the U.S., particularly textiles and jewelry, ripple directly into gold-consuming industries. Meanwhile, tensions over Fed governance create further uncertainty, reinforcing the hedge appeal of gold. Analysts caution that a renewed global crisis could trigger rapid inflows, accelerating a breakout well above current consolidation ranges.
Market strategists remain divided. Brett Elliott at APMEX described the trading pattern as sideways consolidation, with gold trapped between $3,180 and $3,440 since April and awaiting a catalyst. Chris Mancini of Gabelli suggested Fed easing could unlock the next surge, while Savvy Wealth’s Joshua Barone sees a bull case near $4,000 by year-end if real rates fall and geopolitical tensions persist. Conversely, a bear case points to $3,200 if inflation proves sticky, the dollar strengthens, and yields remain elevated. Historical trends reinforce caution: September and October have often delivered turbulence across markets, and gold could see volatility intensify into the fall.
The structure of gold investment also reflects these shifts. Physical gold remains popular but is challenged by storage and liquidity, while SPDR Gold Shares (GLD) offers a direct ETF proxy at lower fees. Mining equities like Barrick Gold (GOLD) and Franco-Nevada (FNV) trade with higher volatility than bullion itself, often amplifying moves. December gold futures, trading at $3,424, highlight how leveraged exposure increases both risk and reward. Meanwhile, spot holdings continue to expand across Asia and Europe, underpinned by retail demand and central bank diversification.
At present levels of $3,380–$3,390 per ounce, gold balances precariously. Technical compression suggests a breakout is imminent, with $3,500–$3,800 in play if bulls succeed. On the downside, a break of $3,344 support exposes $3,288, with further risk toward $3,200 under a strong-dollar environment. With inflation still elevated, Fed rate cuts priced in, and central bank accumulation ongoing, the medium-term trajectory favors strength. Yet traders must respect near-term fragility: the U.S. dollar’s resilience and political volatility remain immediate headwinds.


 Price Forecast: Builds Toward Potential Breakout of Triangle")

