The main category of Forex News.
You can use the search box below to find what you need.
[wd_asp id=1]
The main category of Forex News.
You can use the search box below to find what you need.
[wd_asp id=1]
In our last webinar, we highlighted 148.00–148.50 as the key rejection zone unless U.S. CPI delivered a strong dovish surprise. We noted that a failure at this level could open the path toward 146.50, targeting previous demand.
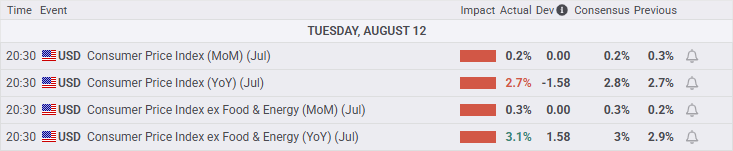
On August 12, CPI data brought a split outcome:
The soft headline reinforced easing expectations, but the hotter core print kept the Fed from being fully locked into aggressive cuts, creating two-way volatility in USD/JPY.
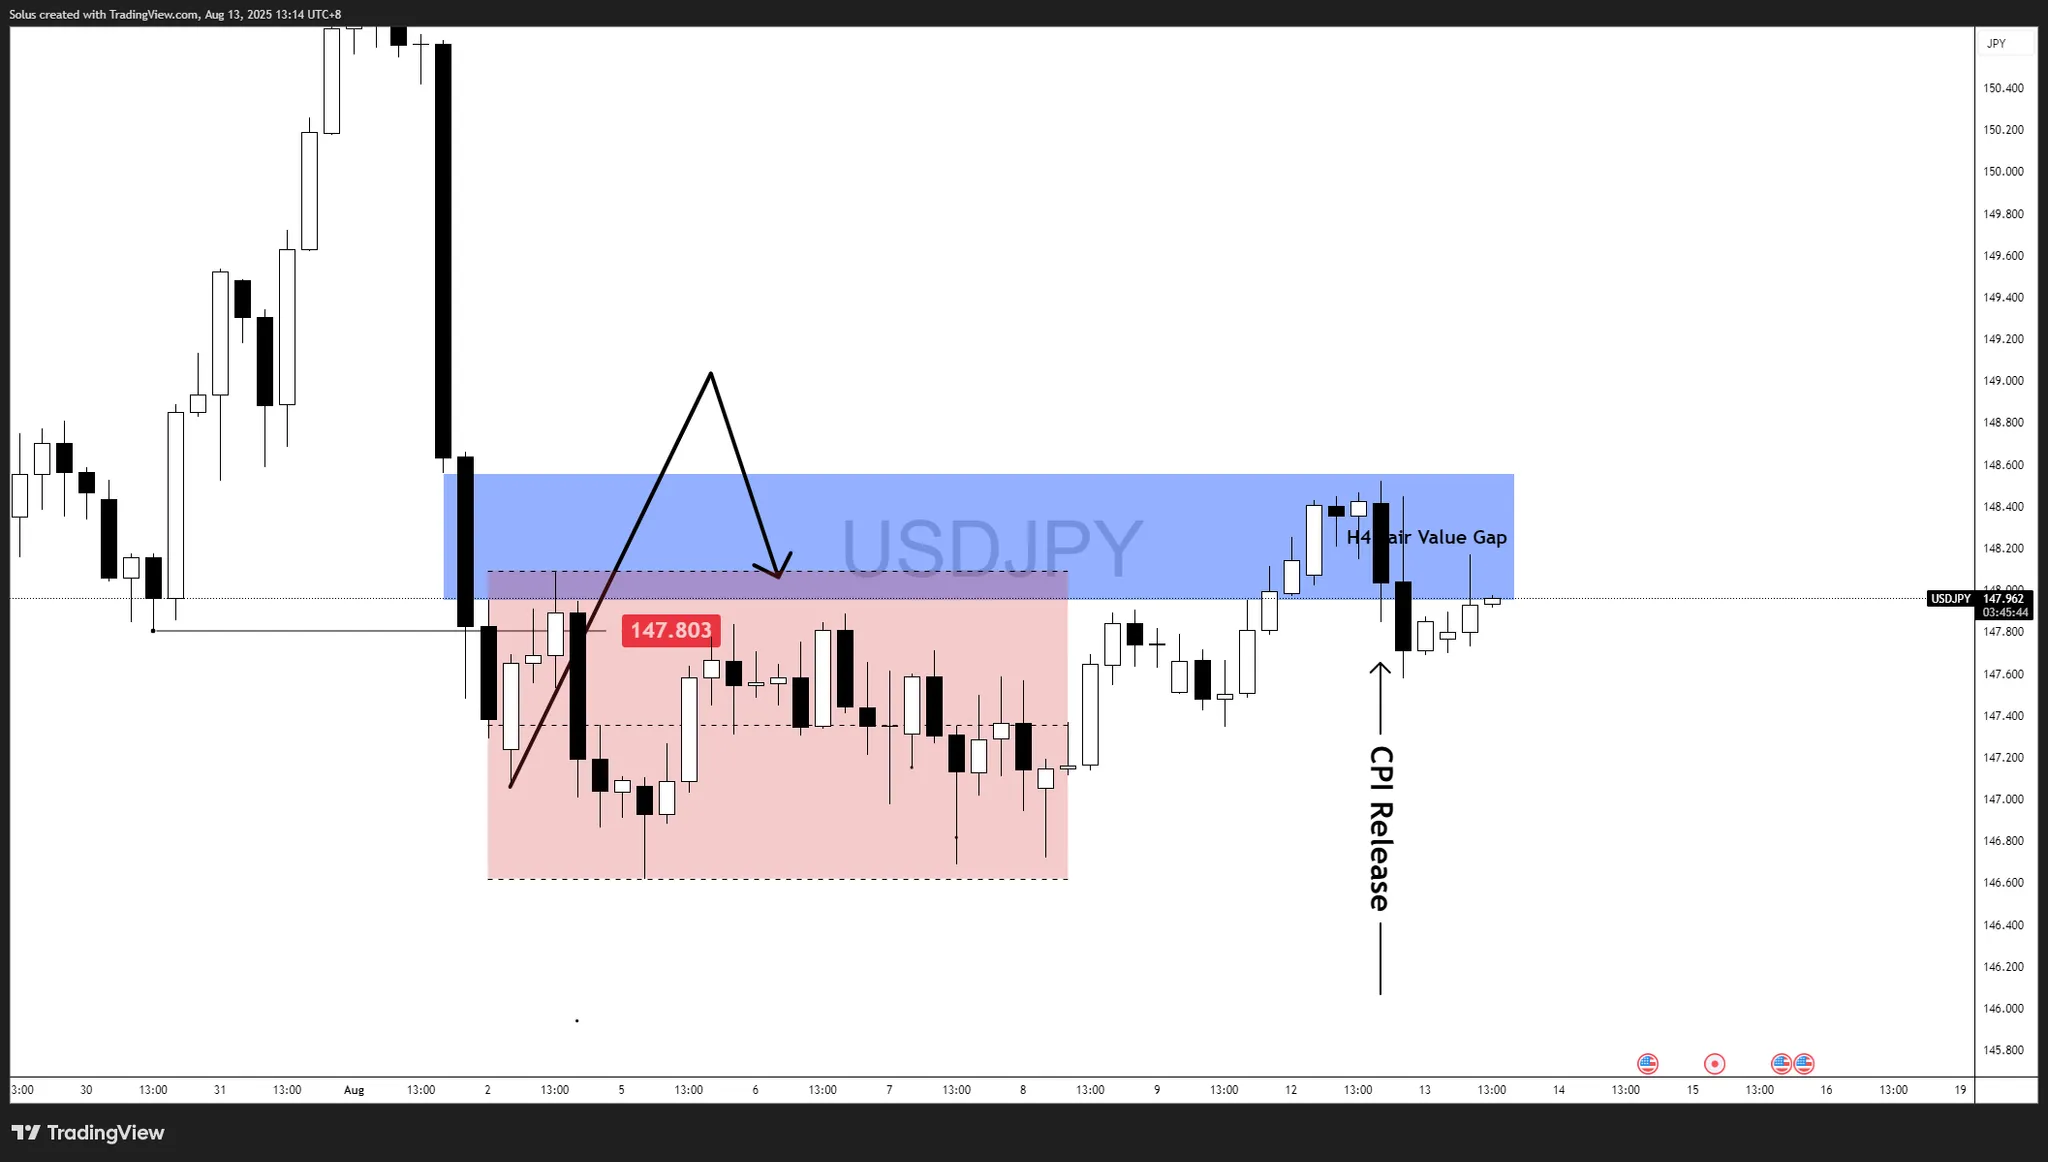
The pair rejected the 148.50 ceiling, confirming our pre-CPI bias. Price is now consolidating in the 148.50–147.50 range, awaiting a breakout trigger from further U.S. data or Fed commentary.
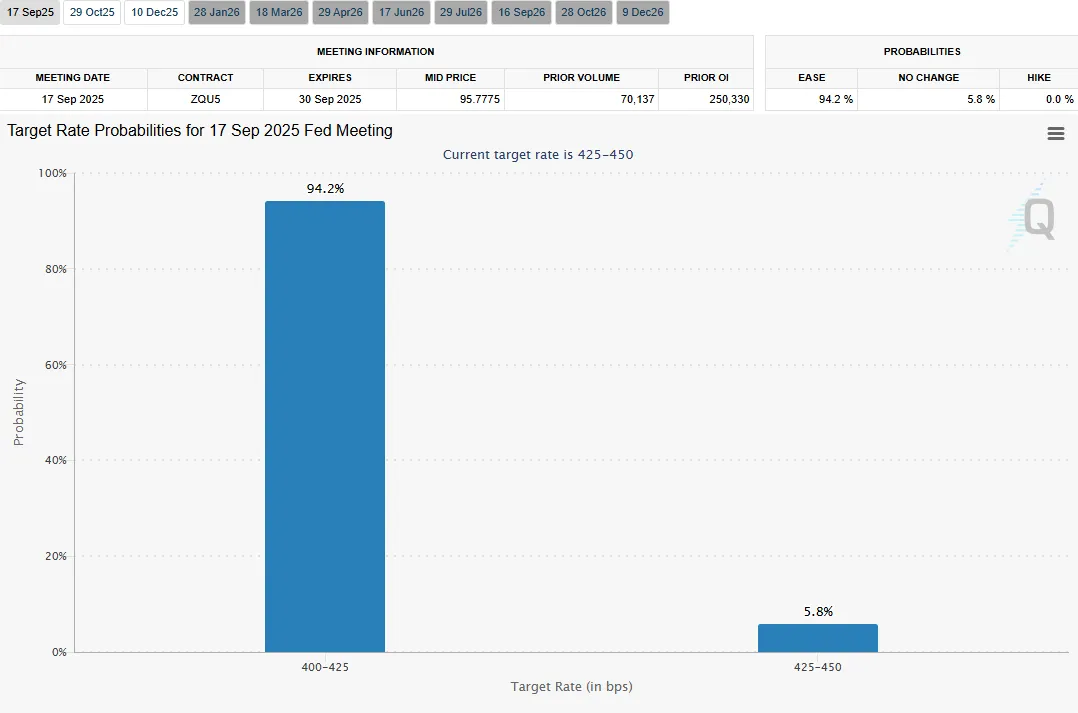
According to the CME FedWatch Tool following the CPI release:
This strong consensus for easing keeps USD/JPY supported in the short term, but with the risk of dollar weakness if future data aligns with the softer headline CPI trend.
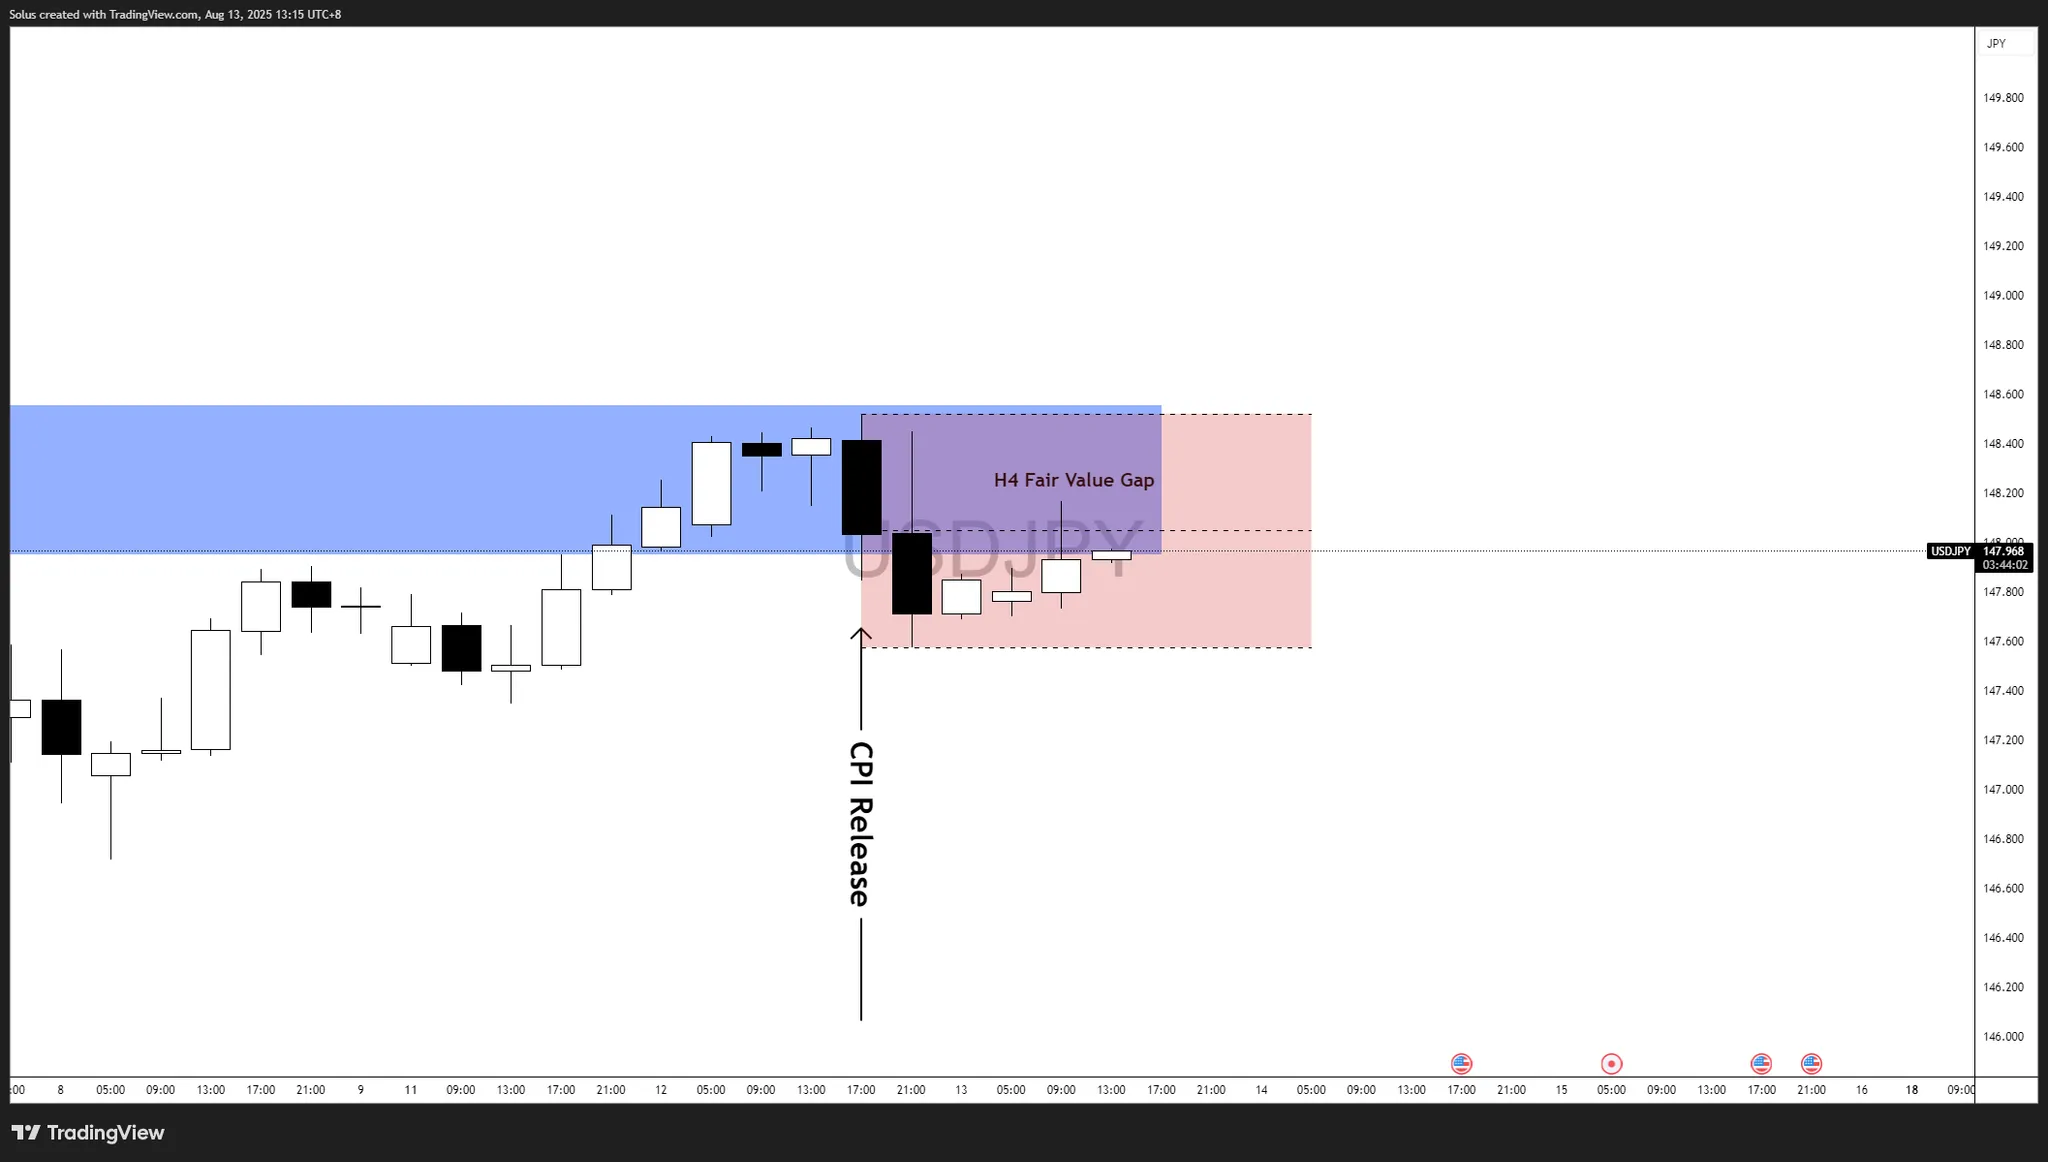
Following the CPI release, USD/JPY reacted with a sharp rejection from the H4 Fair Value Gap, aligning with the supply zone we outlined in the pre-event forecast.
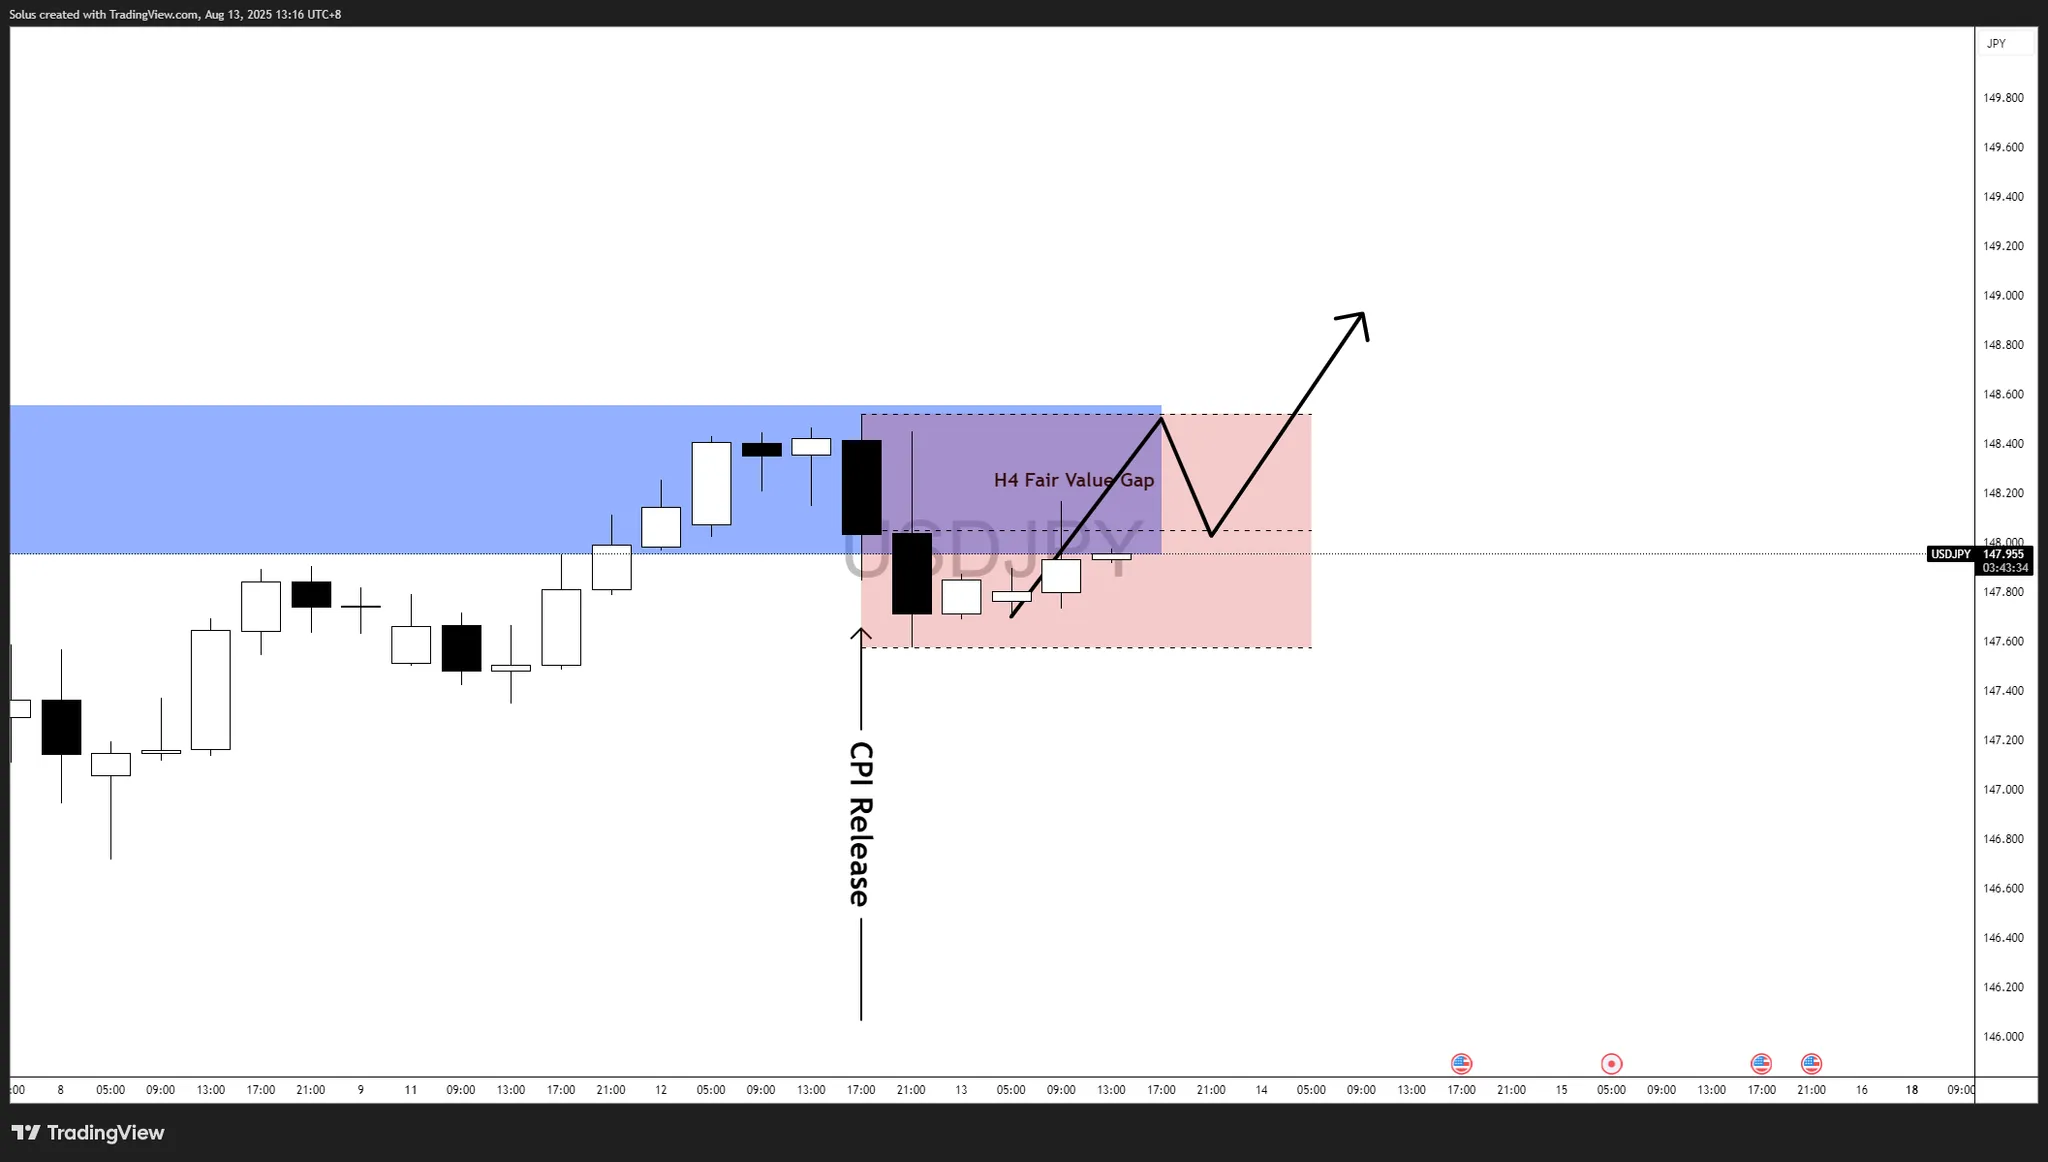
Following the CPI release, USD/JPY has been consolidating within the H4 Fair Value Gap after an initial downside reaction. The current structure suggests the potential for buyers to reassert control if price action follows through on a clean breakout.
This bullish pathway aligns with the macro backdrop of a 94.2% Fed rate cut probability, which generally supports carry trade flows into USD/JPY. If risk sentiment remains steady and Japanese yields stay suppressed, buyers could leverage the current consolidation as a launchpad for a push toward the 149 handle.
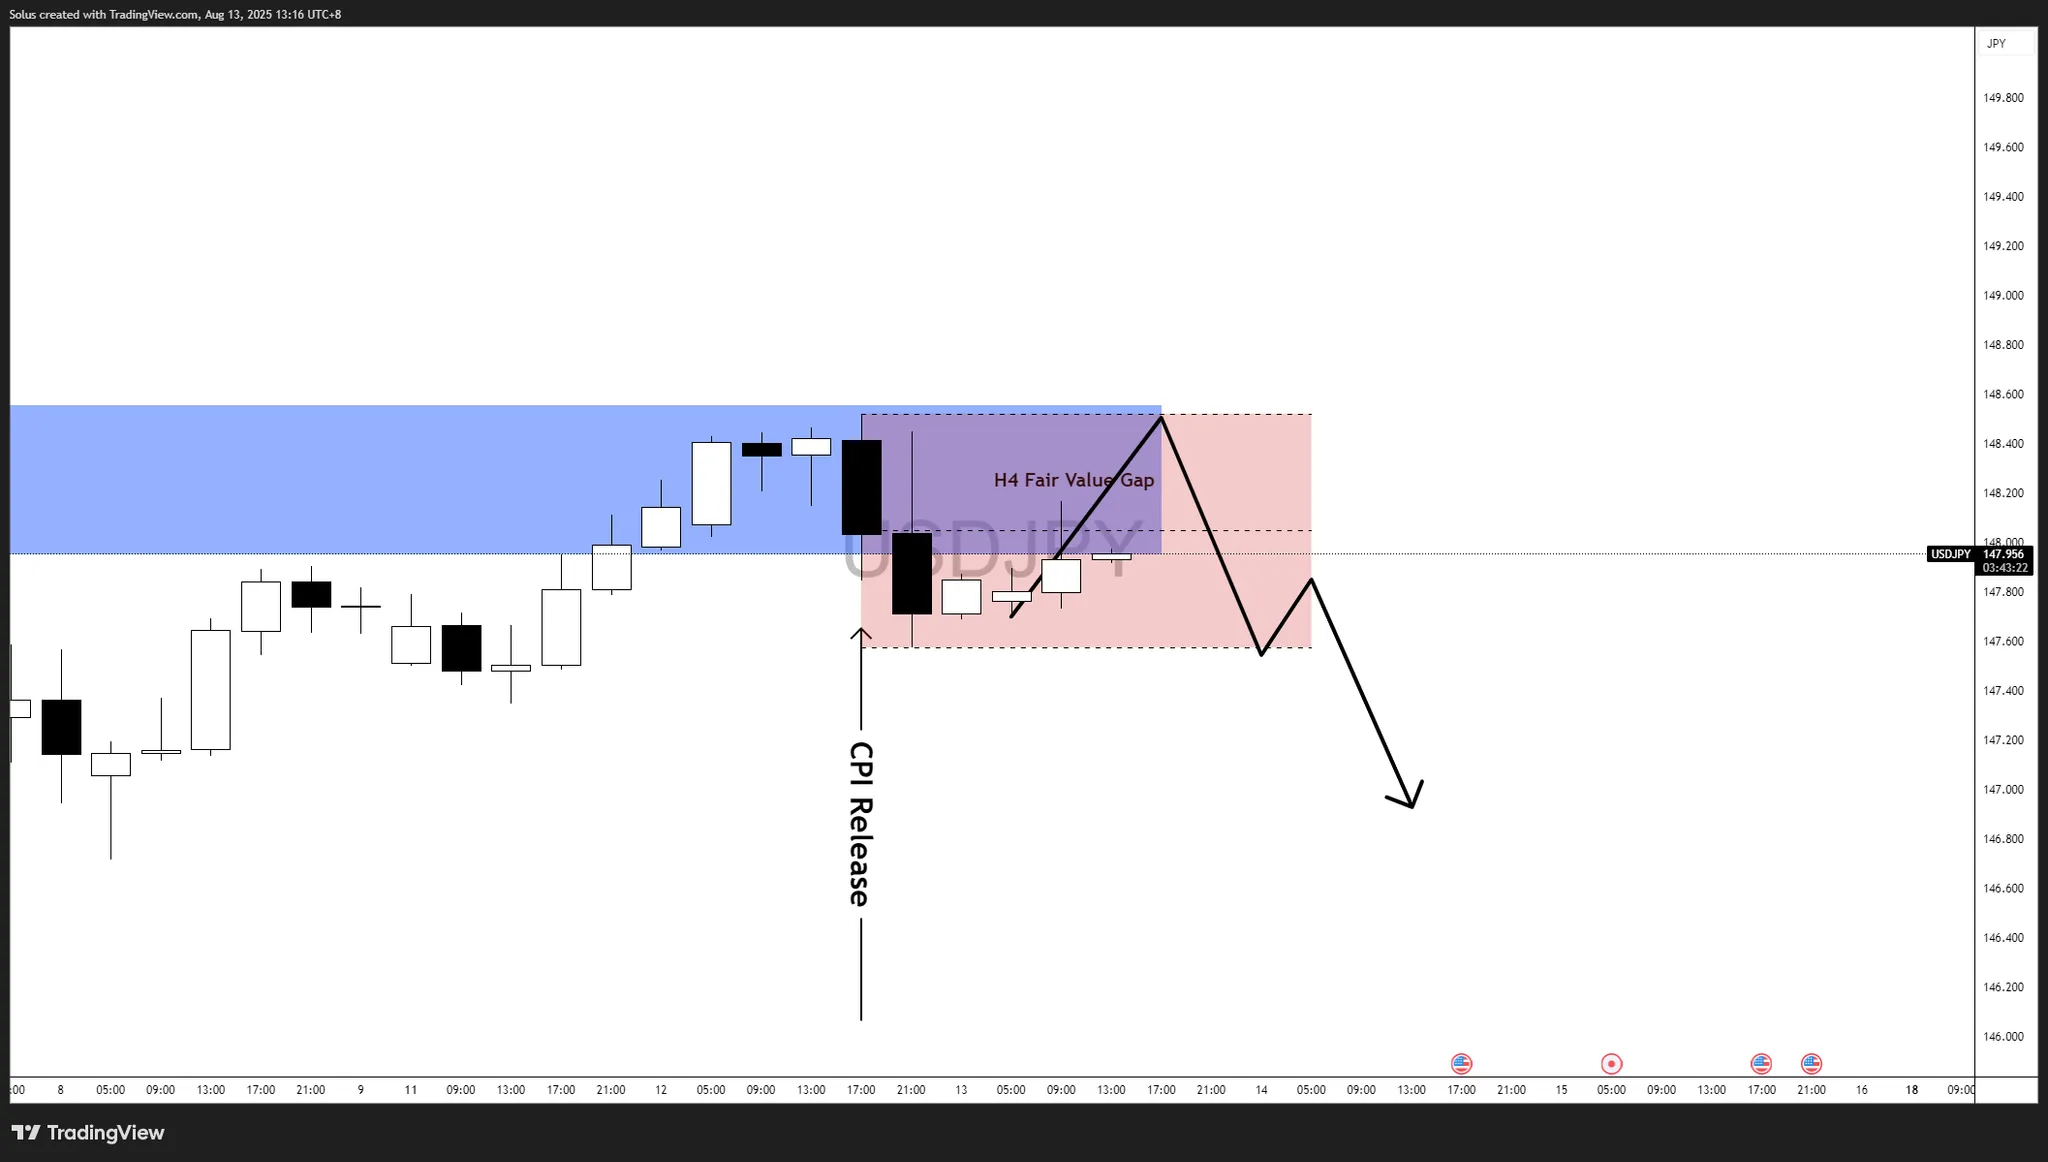
Price remains capped within the H4 Fair Value Gap, showing signs of weakness. Sellers could regain control if price action respects this zone as a ceiling.
The rejection from the H4 Fair Value Gap aligns with the idea of distribution at premium pricing, particularly as the market digests mixed CPI signals. While a 94.2% Fed cut probability leans dovish for the USD in theory, if the yen strengthens on any BoJ commentary or risk-off sentiment, sellers could drive the pair into a deeper retracement phase.
Notice that the top of the flag shows resistance around the 200-Day MA (blue) and the 20-Day MA (purple). Plus, the 20-Day line has turned down recently and that follows an advance since May 28. It is also interesting to notice that a minimum 38.2% Fibonacci retracement was completed around the recent lower swing high at $69.98. Together, these signs of resistance are consistent with the formation of a bearish flag and simultaneous bull channel breakdown.
Given the sharp descent that generated the pole portion of the bear flag, the bears will be fighting the bulls, as a large potential support zone is not much lower. When including the 50-Day MA, that zone would start around $65.74 to $64.50. The range begins with the 50-Day MA, is followed by the combination of an AVWAP level and the neckline of a double bottom pattern around $65.33 and finishes with the 61.8% Fibonacci retracement. Subsequently, a decisive decline below the 61.8% level will confirm a continuation of the bear flag breakdown.
Despite the bear trigger there needs to be follow-though to confirm. Notice that today’s range is very narrow and not what is generally anticipated on a solid breakdown. Traders should stay cautious as a rally above today’s high of $67.41 could lead to another test of resistance around 20-Day MA, now at $68.47, or another resistance level. Of course, that would keep crude oil within the flag consolidation pattern. On the upside, a decisive decline below today’s low of $66.50 triggers a continuation of the bear flag breakdown and opens the door to lower prices.
For a look at all of today’s economic events, check out our economic calendar.
The euro is building on its bullish footing against the U.S. dollar after a mixed but dovish-leaning U.S. CPI report reinforced expectations of a Federal Reserve rate cut in September. EUR/USD is now trading around.
While core CPI YoY came in slightly above forecast at 3.1%, the headline CPI YoY remained unchanged at 2.7%, missing estimates for 2.8%. Markets interpreted this as a sign that inflationary pressures are not re-accelerating, allowing the Fed more room to ease policy without reigniting price growth.
The euro, supported by steady Eurozone data and a technical structure that has respected key retracement zones, has benefited directly from the resulting dollar weakness.
|
Data |
Actual |
Forecast |
Previous |
Market Impact |
|---|---|---|---|---|
|
Inflation Rate YoY (Jul) |
2.7% |
2.8% |
2.7% |
Slight miss supported a dovish Fed outlook. |
|
Core Inflation Rate YoY (Jul) |
3.1% |
3.0% |
2.9% |
Small upside surprise but overshadowed by stable headline CPI. |
|
Inflation Rate MoM (Jul) |
0.2% |
0.2% |
0.3% |
On target, no hawkish shift. |
|
Core Inflation Rate MoM (Jul) |
0.3% |
0.3% |
0.2% |
Matched forecasts, keeping cut expectations alive. |
Traders largely dismissed the slight core CPI beat, focusing instead on the fact that headline CPI YoY remains anchored at 2.7%. This reinforced a dovish Fed bias and triggered a USD sell-off, giving EUR/USD the momentum to push toward the top of its range.
The CME FedWatch tool now shows a 94.2% probability of a 25 bps cut at the September 17 FOMC meeting—up sharply from 84.5% in our August 12 forecast.
This jump reflects market conviction that the Fed will take action, as YoY inflation has stabilized and risks of re-acceleration appear limited. The pricing shift further undercuts
In the previous webinar, our bullish projection outlined:
Following the inflation release, the market followed this blueprint precisely—rejecting deeper downside, reclaiming the upper range, and moving toward breakout territory.
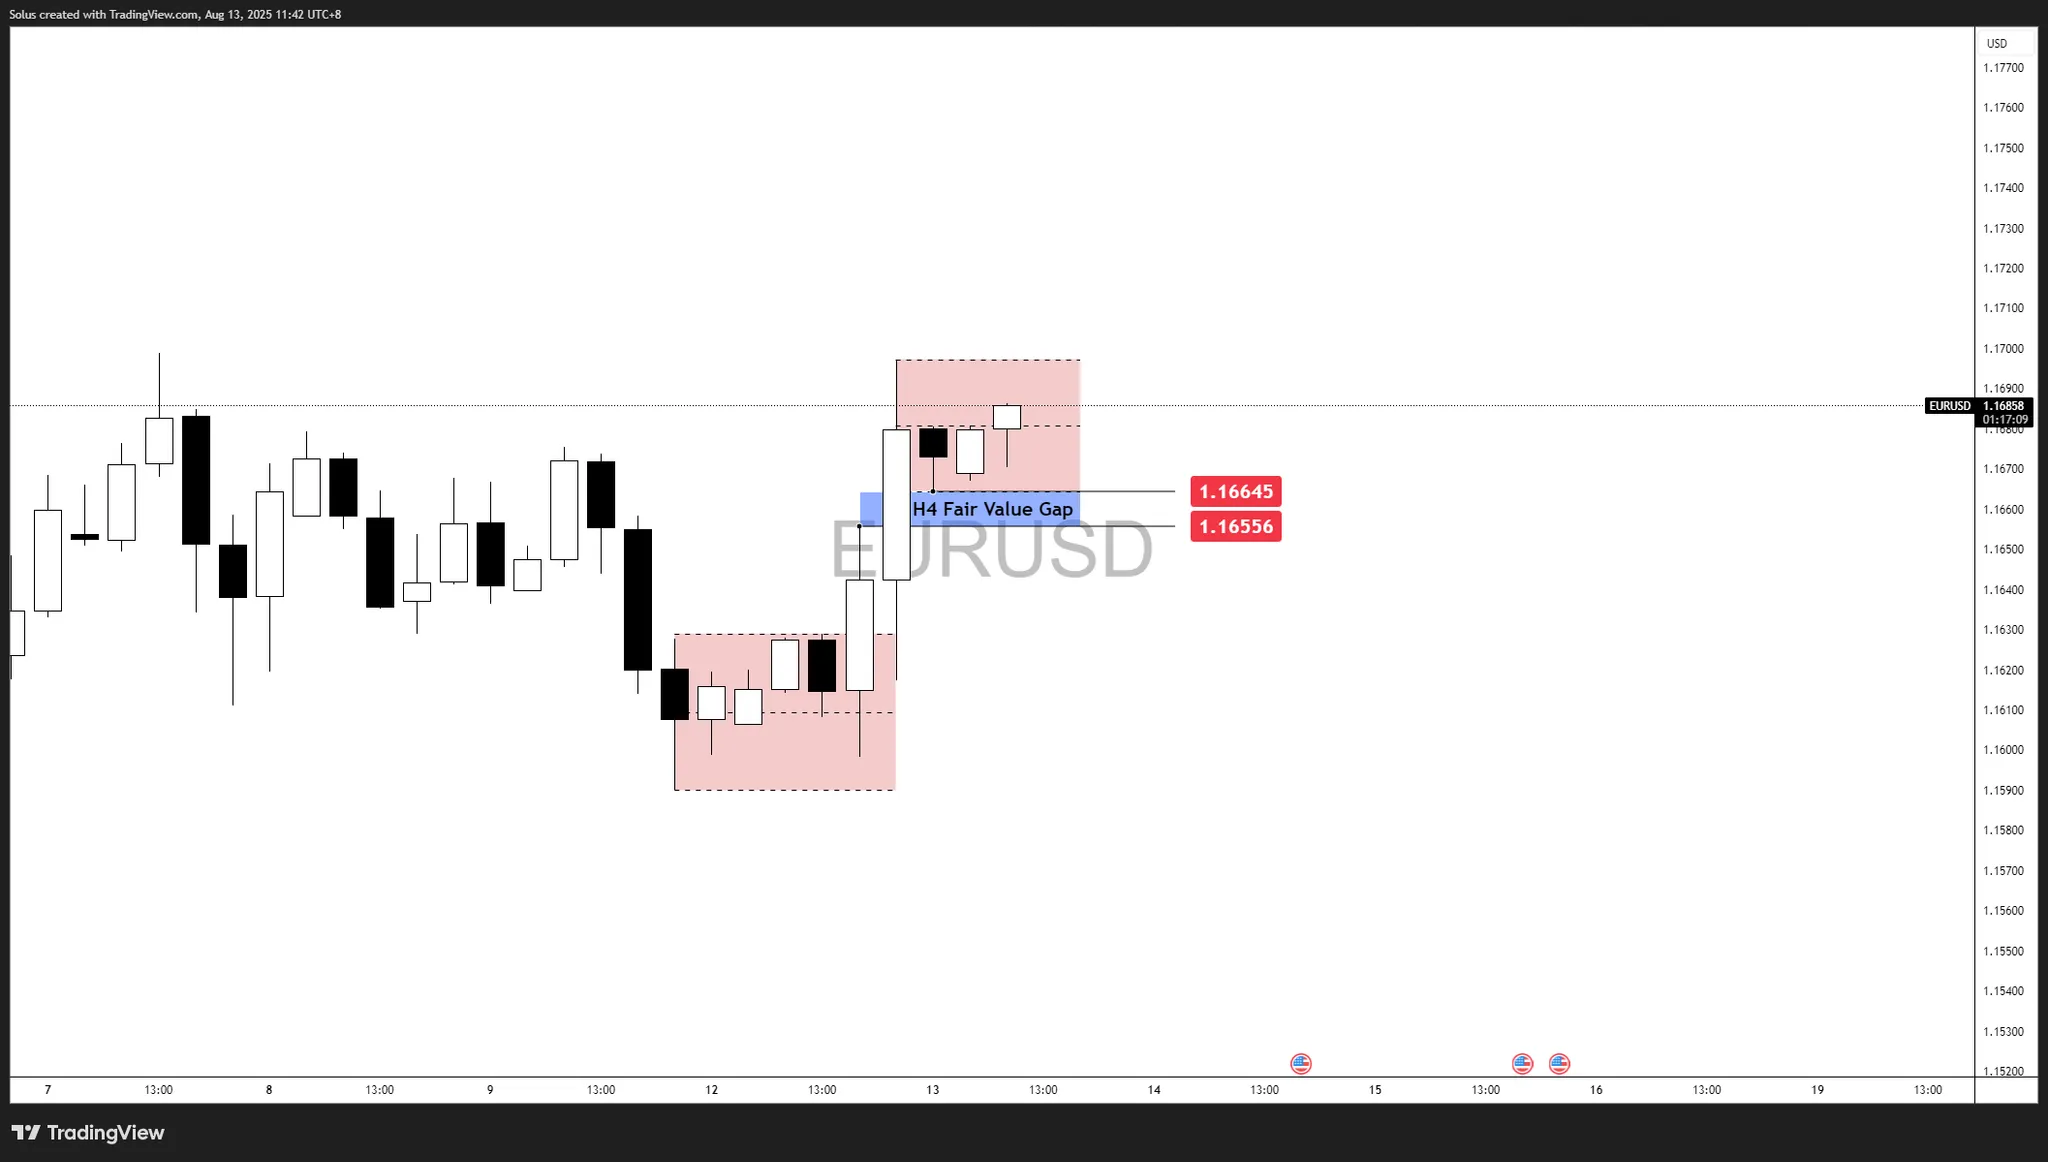
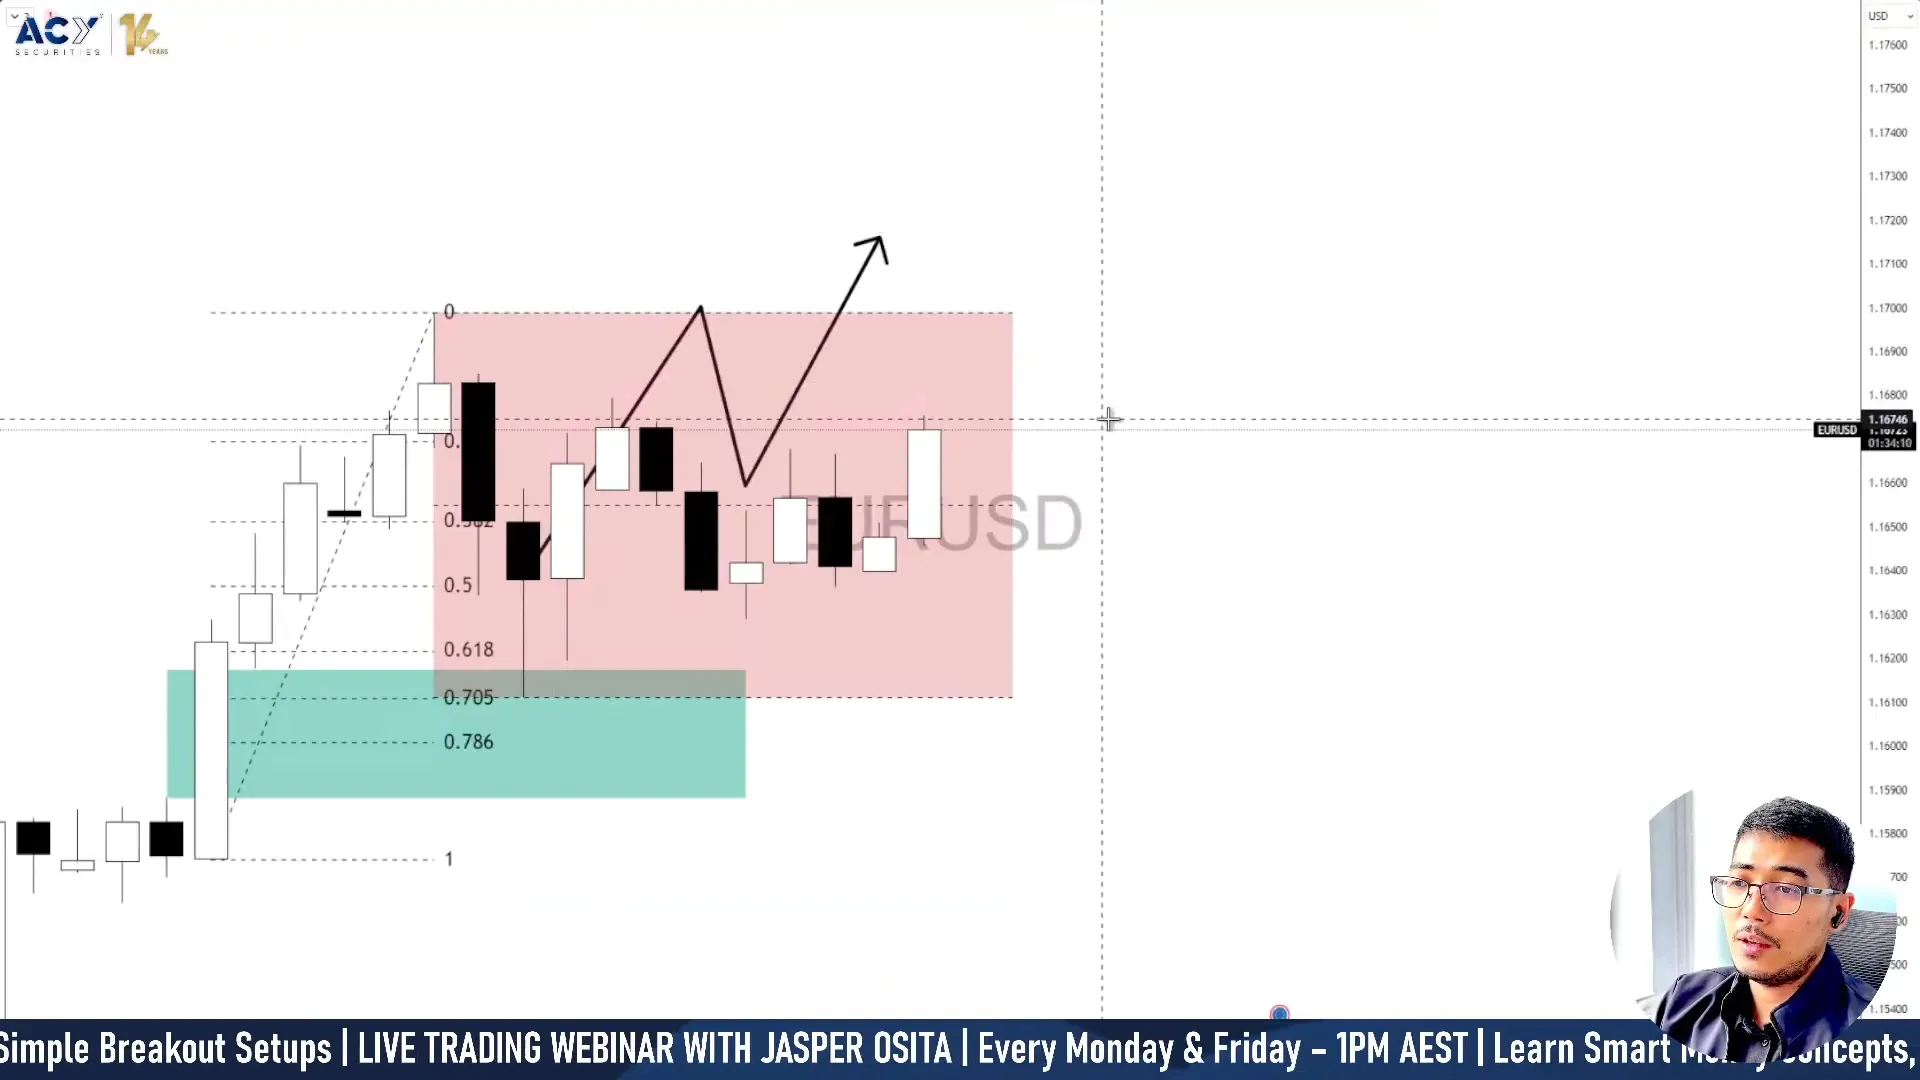
The recent EUR/USD price action confirms a bullish market structure, with price breaking higher from the earlier consolidation zone and now leaving the H4 Fair Value Gap (FVG) between 1.16556 – 1.16645 untouched as potential fresh intraday support for pullback opportunity.
The rally from the August 12 low was impulsive, sweeping prior liquidity and leaving behind a clean demand imbalance that aligns with our prior bullish roadmap. Current price action shows a modest consolidation just below 1.1700, a key breakout level.
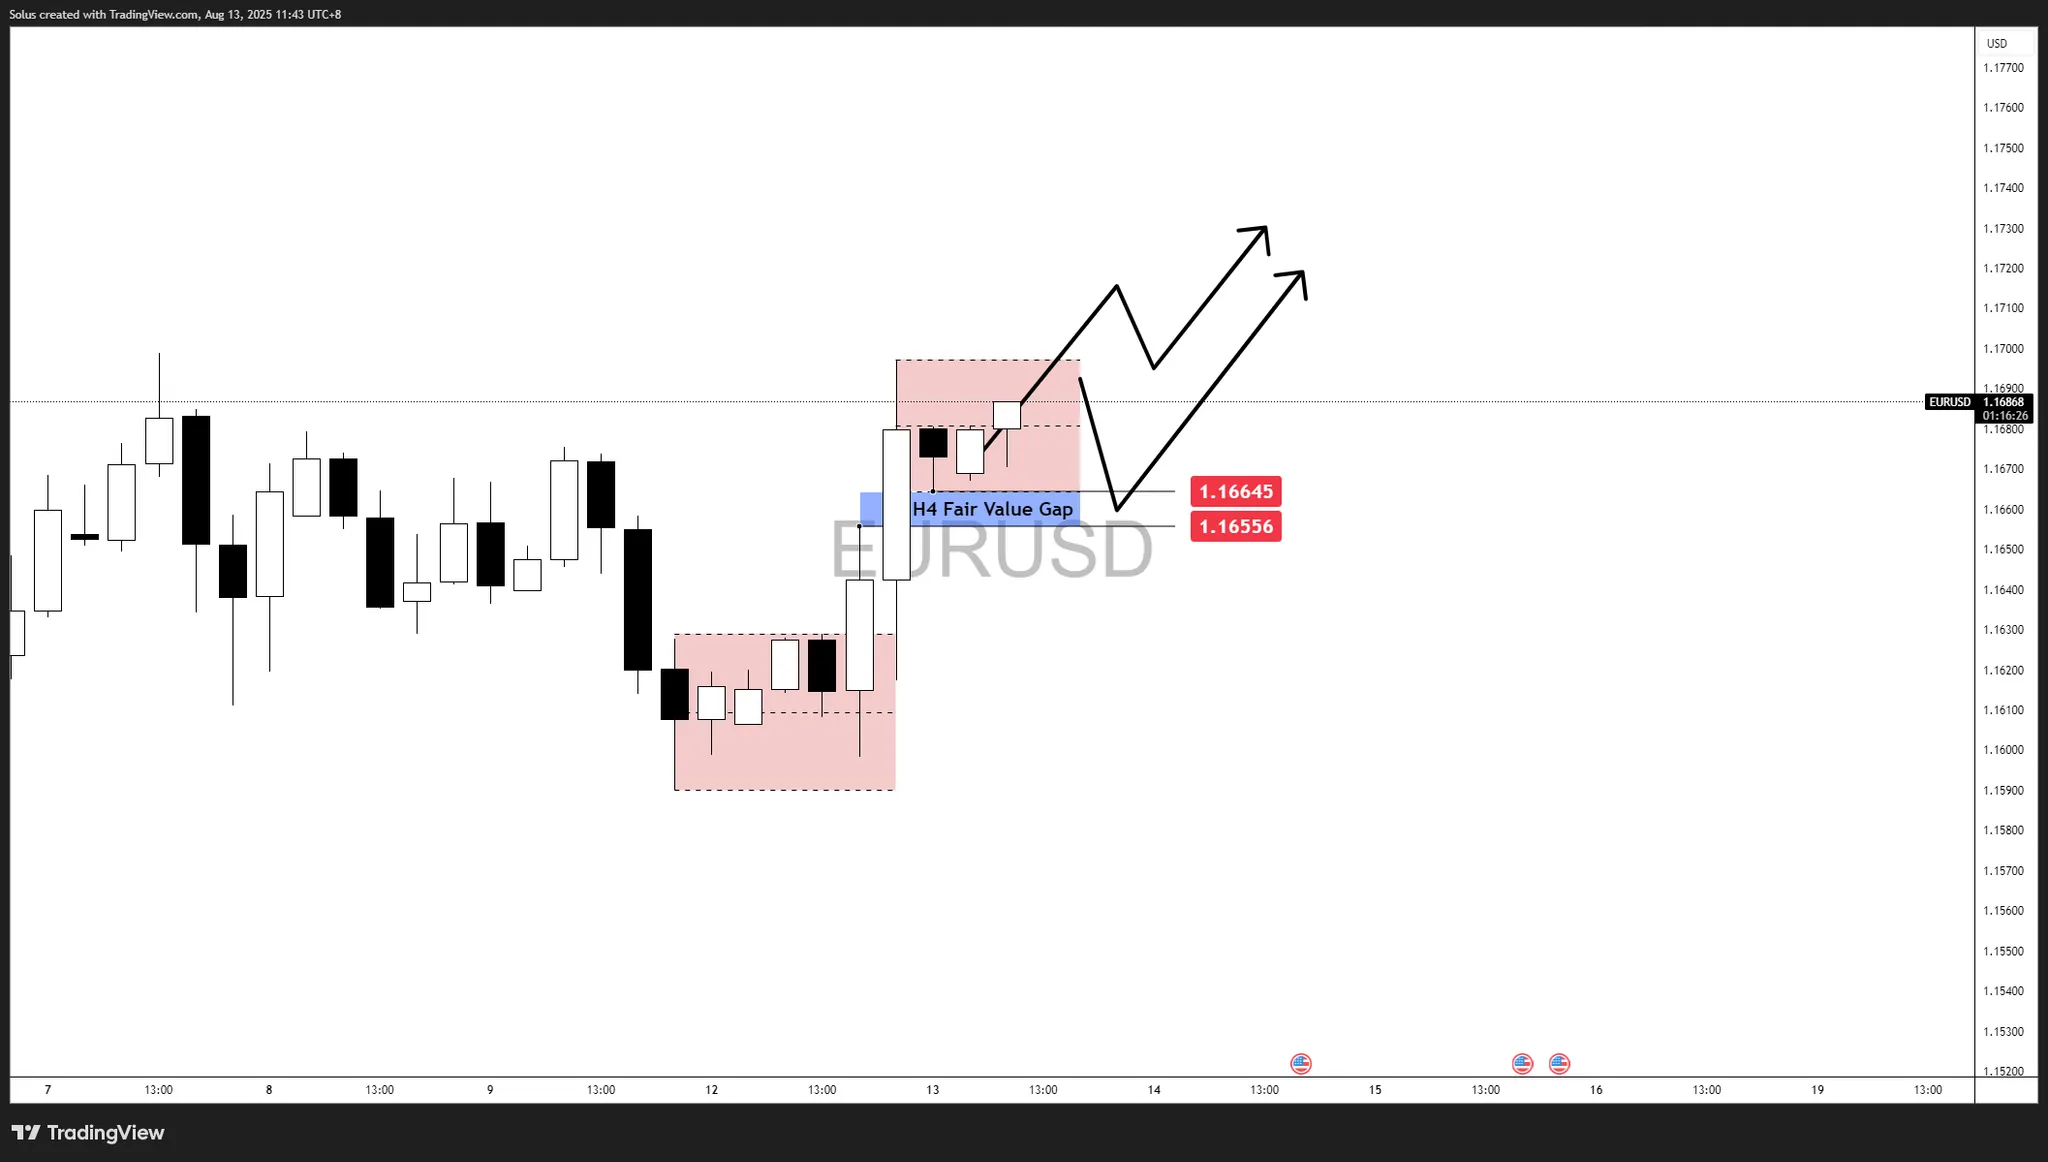
EUR/USD is currently consolidating just under the 1.1700 breakout level after a sharp rally from the August 12 lows. Price is holding above the H4 Fair Value Gap (1.16556 – 1.16645), which is acting as a key intraday support zone.
From here, there are two bullish pathways:
Immediate breakout:
FVG retest before breakout:
Bullish invalidations:

EUR/USD is showing signs of stalling just below the 1.1700 breakout level, with the potential for a rejection that sends price back toward the H4 Fair Value Gap (1.16556 – 1.16645).
If the gap fails to hold as support, bearish pressure could accelerate toward the 1.1600 psychological level which marks the prior accumulation base and key liquidity pool before the CPI momentum.
Bearish pathway:
Bearish invalidation:
The US dollar initially rallied against the Japanese yen during the early hours here on Tuesday but gave back gains as CPI again came out as anticipated. We are hovering right around the 200-day EMA, which, of course, is an indicator that a lot of people pay attention to anyway. So, I think you would anticipate seeing a bit of noise here regardless. If we do break down from here and break down below the 200 day EMA, then we could go looking at the 50 day EMA underneath. So, with that being said, I think you’ve got a lot of cushion underneath that will continue to push to the upside, although I don’t know how quickly.
The Australian dollar fell initially during the day but has turned around as the 50 day EMA has held out support and let’s be honest here, this was all about the CPI number not being hotter than anticipated. So, at this point, the Australian dollar could go looking to the 0.6550 level, an area that’s been important multiple times in the past. And with that, I think you have to assume it’s a bit of a magnet for price.
If we break down below the bottom of the candlestick, then it opens up the possibility of a move down to the 200 day EMA at the 0.6457 level. Anything below there could open up fresh selling, but right now I think we’re just heading right back into the same area that we’ve been stuck in for what seems like a lifetime here.
For a look at all of today’s economic events, check out our economic calendar.
Gold trades with a softer tone on Tuesday, falling to a fresh one-week low of $3,331.12 in the American session. The US Dollar (USD) gathered momentum following the release of United States (US) data, finding additional legs in political headlines.
The US published the July Consumer Price Index (CPI), which rose at an annualized pace of 2.7% in July, lower than the 2.8% market forecast. The core annual reading, however, increased by 3.1%, higher than the previous 2.9% and the 3% anticipated. On a monthly basis, the CPI rose by 0.2%, while the core monthly reading resulted at 0.3%, matching expectations.
The figures support the case for a September rate cut, leading to broad USD weakness. Stocks rallied, reflecting the better mood amid potential lower costs, and weighing on the bright metal.
The USD kept falling despite some political noise. US President Donald Trump extended the 90-day pause on massive tariffs on China, while Beijing answered reciprocally. Later in the day, Trump said he is considering allowing a lawsuit against Federal Reserve (Fed) Chair Jerome Powell amid the “ horrible, and grossly incompetent, job he has done in managing the construction of the Fed Buildings.”
Kansas City Federal Reserve (Fed) President Jeffrey Schmid said that the muted impact of tariffs on inflation should be seen as evidence that monetary policy is appropriate, and not a reason to cut interest rates.
Other than that, Trump’s candidate to replace Adriana Kugler, Stephen Miran, said he believes tariffs will be borne by the countries that they are tariffing, while the next head of the Bureau of Labor Statistics, EJ Antoni, suggested not publishing the Nonfarm Payrolls report anymore. The noise is doing no good to the Greenback.
The macroeconomic calendar cools down on Wednesday, as the only relevant figure will be the final estimate of German Harmonized Index of Consumer Prices (HICP).
The XAU/USD pair is little changed from Monday’s close, hovering around the $3,350 level. The daily chart shows the pair is unable to advance beyond a flat 20 Simple Moving Average (SMA), although well above bullish 100 and 200 SMAs. At the same time, technical indicators suggest buyers remain sidelined: the Momentum indicator ticked modestly higher but remains below its 100 line, while the Relative Strength Index (RSI) indicator heads nowhere at around 50.
In the near term, and according to the 4-hour chart, the risk skews to the downside- Technical indicators keep grinding lower below their midlines, in line with lower lows ahead. At the same time, a flat 100 SMA at around $3,359 provides intraday resistance, while the 20 SMA gains bearish traction above the longer one.
Support levels: 3.331.10 3,312.25 3,290.00
Resistance levels: 3,359.00 3,372.30 3,389.85
GBPCHF continued to form strong bullish trading as it confirmed breaching the barrier at 1.0825, recording some extra gains by hitting 1.0915 level, which forces it to form an intraday negative rebound, affected by stochastic exit from the overbought level.
The price might be forced to provide sideways trading, to keep waiting for the positive momentum, which allows it to press on 50%Fibonacci correction level at 1.0935, and surpassing it will make it success to record extra gains that might extend at 1.0995 and 1.1025 initially.
The expected trading range for today is between 1.0860 and 1.0935
Trend forecast: Bullish
– Written by
Ben Hughes
STORY LINK GBP/USD Forecast: Pound Sterling Extends Gains after US Inflation Disappoints
The Pound to US Dollar (GBP/USD) exchange rate pushed to a two-week high on Tuesday, buoyed by softer-than-expected US inflation data and steady UK employment figures.
At the time of writing, GBP/USD was trading at around $1.3483, up roughly 0.4% from Tuesday’s opening levels.
The US Dollar (USD) came under pressure on Tuesday following the release of the July Consumer Price Index, which came in softer than markets had anticipated.
Headline inflation held steady at 2.7% year-on-year, falling just short of the 2.8% forecast. Meanwhile, core inflation, which excludes food and energy, rose to 3.1%, slightly above expectations.
Despite the elevated core reading, the cooler-than-expected headline figure is reinforcing bets that the Federal Reserve will begin cutting interest rates before year-end.
Indeed, markets are now placing in as much as 75bps of easing by the end of 2025.
The Pound (GBP) gained traction on Tuesday, following the release of the UK’s latest employment report.
![]()
Figures from the Office for National Statistics (ONS) showed the unemployment rate holding at 4.7% in June, with wage growth easing slightly from 5% to 4.6%.
Meanwhile, payroll numbers fell by just 8,000, far better than the anticipated 60,000 drop and the smallest decrease since January.
While the data confirmed that the labour market is gradually cooling, the pace of the slowdown does not yet appear sufficient to push the Bank of England (BoE) into accelerating its rate-cutting cycle.
Looking ahead, the Pound to US Dollar (GBP/USD) exchange rate may face a key test later this week when the UK’s second-quarter GDP figures are released.
Economists expect growth to slow sharply, with forecasts pointing to a 0.1% quarterly expansion, down from 0.7% in Q1. Such a result could prompt fresh calls for the BoE to step up policy support and fuel concerns over government finances, including the potential for more tax hikes.
In the meantime, geopolitical tensions may offer some support to the US Dollar, with investors likely to turn more cautious ahead of Friday’s planned meeting between US President Donald Trump and Russian President Vladimir Putin.
![]()
International Money Transfer? Ask our resident FX expert a money transfer question or try John’s new, free, no-obligation personal service! ,where he helps every step of the way,
ensuring you get the best exchange rates on your currency requirements.
TAGS: Pound Dollar Forecasts
EUR/USD moves sideways slightly above 1.1600 after closing marginally lower on Monday. As investors await July Consumer Price Index (CPI) data from the US, the pair’s near-term technical outlook highlights a neutral stance.
The table below shows the percentage change of Euro (EUR) against listed major currencies this week. Euro was the weakest against the British Pound.
| USD | EUR | GBP | JPY | CAD | AUD | NZD | CHF | |
|---|---|---|---|---|---|---|---|---|
| USD | 0.29% | -0.06% | 0.59% | 0.27% | 0.50% | 0.59% | 0.12% | |
| EUR | -0.29% | -0.36% | 0.33% | -0.01% | 0.20% | 0.25% | -0.17% | |
| GBP | 0.06% | 0.36% | 0.62% | 0.35% | 0.57% | 0.61% | 0.19% | |
| JPY | -0.59% | -0.33% | -0.62% | -0.28% | -0.05% | 0.07% | -0.33% | |
| CAD | -0.27% | 0.01% | -0.35% | 0.28% | 0.23% | 0.27% | -0.18% | |
| AUD | -0.50% | -0.20% | -0.57% | 0.05% | -0.23% | 0.05% | -0.38% | |
| NZD | -0.59% | -0.25% | -0.61% | -0.07% | -0.27% | -0.05% | -0.42% | |
| CHF | -0.12% | 0.17% | -0.19% | 0.33% | 0.18% | 0.38% | 0.42% |
The heat map shows percentage changes of major currencies against each other. The base currency is picked from the left column, while the quote currency is picked from the top row. For example, if you pick the Euro from the left column and move along the horizontal line to the US Dollar, the percentage change displayed in the box will represent EUR (base)/USD (quote).
The US Dollar (USD) held its ground on Monday and caused EUR/USD to edge lower as investors cheered the news of the US and China agreeing to extend the trade truce for another 90 days.
Annual inflation in the US, as measured by the change in the CPI, is expected to rise to 2.8% in July from 2.7% in June. On a monthly basis, the CPI and the core CPI, which excludes volatile food and energy prices, are forecast to increase by 0.2% and 0.3%, respectively.
In case the headline annual CPI comes in above the market consensus, the USD could gather strength against its rivals with the immediate reaction. If this data matches the expectation, investors could react to the monthly core CPI print. A stronger-than-forecast increase in this figure could be supportive for the USD. Conversely, a soft core inflation reading is likely to feed into expectations of three Federal Reserve (Fed) rate cuts this year and hurt the USD, allowing EUR/USD to gain traction.
According to the CME FedWatch Tool, investors are currently pricing in a 43% probability of the Fed lowering the policy rate by a total of 75 bps in the remainder of the year.
The Relative Strength Index (RSI) indicator on the 4-hour chart moves sideways near 50 and EUR/USD fluctuates at around the 100-period Simple Moving Average (SMA), while remaining in between the 50-period and the 20-period SMAs, reflecting a neutral stance.
The 100-period SMA could be seen as a pivot level at 1.1625. Once EUR/USD confirms that level as support, 1.1650-1.1665 (Fibonacci 23.6% retracement of the latest uptrend, 200-period SMA) could be seen as the next resistance before 1.1700 (static level, round level) and 1.1760 (static level).
On the downside, 1.1600-1.1590 (static level, round level, 50-period SMA) aligns as the first support before 1.1540 (Fibonacci 38.2% retracement) and 1.1500 (static level, round level).
The Euro is the currency for the 19 European Union countries that belong to the Eurozone. It is the second most heavily traded currency in the world behind the US Dollar. In 2022, it accounted for 31% of all foreign exchange transactions, with an average daily turnover of over $2.2 trillion a day.
EUR/USD is the most heavily traded currency pair in the world, accounting for an estimated 30% off all transactions, followed by EUR/JPY (4%), EUR/GBP (3%) and EUR/AUD (2%).
The European Central Bank (ECB) in Frankfurt, Germany, is the reserve bank for the Eurozone. The ECB sets interest rates and manages monetary policy.
The ECB’s primary mandate is to maintain price stability, which means either controlling inflation or stimulating growth. Its primary tool is the raising or lowering of interest rates. Relatively high interest rates – or the expectation of higher rates – will usually benefit the Euro and vice versa.
The ECB Governing Council makes monetary policy decisions at meetings held eight times a year. Decisions are made by heads of the Eurozone national banks and six permanent members, including the President of the ECB, Christine Lagarde.
Eurozone inflation data, measured by the Harmonized Index of Consumer Prices (HICP), is an important econometric for the Euro. If inflation rises more than expected, especially if above the ECB’s 2% target, it obliges the ECB to raise interest rates to bring it back under control.
Relatively high interest rates compared to its counterparts will usually benefit the Euro, as it makes the region more attractive as a place for global investors to park their money.
Data releases gauge the health of the economy and can impact on the Euro. Indicators such as GDP, Manufacturing and Services PMIs, employment, and consumer sentiment surveys can all influence the direction of the single currency.
A strong economy is good for the Euro. Not only does it attract more foreign investment but it may encourage the ECB to put up interest rates, which will directly strengthen the Euro. Otherwise, if economic data is weak, the Euro is likely to fall.
Economic data for the four largest economies in the euro area (Germany, France, Italy and Spain) are especially significant, as they account for 75% of the Eurozone’s economy.
Another significant data release for the Euro is the Trade Balance. This indicator measures the difference between what a country earns from its exports and what it spends on imports over a given period.
If a country produces highly sought after exports then its currency will gain in value purely from the extra demand created from foreign buyers seeking to purchase these goods. Therefore, a positive net Trade Balance strengthens a currency and vice versa for a negative balance.
Gold (XAU/USD) reversal from the $3,400 area has been contained at a strong support area between $3,335 and $3,345, where the pair was contained on August 4 and 5, which is also coincident with the 50% Fibonacci retracement of the early August rally.
The pair is trading sideways without a clear bias on Tuesday’s European session, as the US Dollar Index consolidates previous gains with all eyes on the US CPI release, due later today. A more cautious market sentiment on Tuesday is keeping the precious metal from dropping further.
XAU/USD confirmed a trend shift on early Monday’s trading after breaching the bottom of the ending wedge, at $3,390. The pair featured an impulsive reversal to reach the broken wedge’s measured target, at $3,345, and is consolidating on Tuesday, awaiting a fundamental trigger to set the US Dollar’s near-term direction.
Technical indicators remain pointing lower, and a confirmation below the mentioned $3,335 level would bring the July 29 low and July 31 highs, at the $3,305-$3,315 area back to the bears’ focus, before the August 1 low, at $3,282.
To the upside, immediate resistance is at the August 8 lows at $3,380 ahead of the $3,400-$3,410 area, where the August 7 and 10 highs meet the reverse trendline. Above here, the bearish view will be cancelled with the late July highs, at $3,440 coming into view.
Gold has played a key role in human’s history as it has been widely used as a store of value and medium of exchange. Currently, apart from its shine and usage for jewelry, the precious metal is widely seen as a safe-haven asset, meaning that it is considered a good investment during turbulent times. Gold is also widely seen as a hedge against inflation and against depreciating currencies as it doesn’t rely on any specific issuer or government.
Central banks are the biggest Gold holders. In their aim to support their currencies in turbulent times, central banks tend to diversify their reserves and buy Gold to improve the perceived strength of the economy and the currency. High Gold reserves can be a source of trust for a country’s solvency. Central banks added 1,136 tonnes of Gold worth around $70 billion to their reserves in 2022, according to data from the World Gold Council. This is the highest yearly purchase since records began. Central banks from emerging economies such as China, India and Turkey are quickly increasing their Gold reserves.
Gold has an inverse correlation with the US Dollar and US Treasuries, which are both major reserve and safe-haven assets. When the Dollar depreciates, Gold tends to rise, enabling investors and central banks to diversify their assets in turbulent times. Gold is also inversely correlated with risk assets. A rally in the stock market tends to weaken Gold price, while sell-offs in riskier markets tend to favor the precious metal.
The price can move due to a wide range of factors. Geopolitical instability or fears of a deep recession can quickly make Gold price escalate due to its safe-haven status. As a yield-less asset, Gold tends to rise with lower interest rates, while higher cost of money usually weighs down on the yellow metal. Still, most moves depend on how the US Dollar (USD) behaves as the asset is priced in dollars (XAU/USD). A strong Dollar tends to keep the price of Gold controlled, whereas a weaker Dollar is likely to push Gold prices up.
The (ETHUSD) price rose in its last intraday trading, amid its move in sideways range in attempt to gain positive momentum that might help it to recover and complete the strong bullish track, amid its trading alongside a minor bullish bias line on the short-term basis, taking advantage of the dynamic support that is represented by its trading above its EMA50, on the other hand, we notice the emergence of the negative signals on the (RSI), which reduced the last gains of the price.
Therefore, our expectations suggest a rise in the (ETHUSD) price in the upcoming intraday trading, conditioned by its stability above $4,150, targeting the resistance level at $4,500.
The expected trading range is between $4,000 support and $4,500 resistance.
Today’s forecast: Bullish


