The main category of Forex News.
You can use the search box below to find what you need.
[wd_asp id=1]
The main category of Forex News.
You can use the search box below to find what you need.
[wd_asp id=1]
Traders pulled risk off the table following a cooler shift in U.S. weather models. While much of the southern two-thirds of the country remains hot, with highs in the 90s and low 100s, updated GFS and EC models showed a net reduction of five cooling degree days (CDDs) over the weekend.
Temperatures in the Northeast and Midwest are now expected to moderate from late July into early August, with Vaisala projecting an active storm track that could cap cooling demand during July 31–August 4.
Another pressure point for prices is the ongoing softness in LNG exports. U.S. LNG net flows on Monday totaled 14.9 bcf/day, down 4.9% week-on-week, according to BNEF. This drop coincides with signs of stronger supply. U.S. dry gas production reached 107.4 bcf/day to start the week—up 4.8% year-on-year—while rig activity hit a 17-month high of 117, per Baker Hughes.
Last week’s EIA storage report added to the bearish tone. Inventories rose by 46 bcf for the week ending July 11, slightly above consensus and the five-year average of +41 bcf. U.S. gas inventories now sit 6.2% above their five-year seasonal average, despite being 4.9% lower year-on-year.
Meanwhile, electricity demand offers limited support: U.S. power output rose just 1.1% y/y in the latest weekly report, a modest lift relative to expectations for peak summer cooling demand.
Important DisclaimersThe content provided on the website includes general news and publications, our personal analysis and opinions, and contents provided by third parties, which are intended for educational and research purposes only. It does not constitute, and should not be read as, any recommendation or advice to take any action whatsoever, including to make any investment or buy any product. When making any financial decision, you should perform your own due diligence checks, apply your own discretion and consult your competent advisors. The content of the website is not personally directed to you, and we does not take into account your financial situation or needs.The information contained in this website is not necessarily provided in real-time nor is it necessarily accurate. Prices provided herein may be provided by market makers and not by exchanges.Any trading or other financial decision you make shall be at your full responsibility, and you must not rely on any information provided through the website. FX Empire does not provide any warranty regarding any of the information contained in the website, and shall bear no responsibility for any trading losses you might incur as a result of using any information contained in the website.The website may include advertisements and other promotional contents, and FX Empire may receive compensation from third parties in connection with the content. FX Empire does not endorse any third party or recommends using any third party’s services, and does not assume responsibility for your use of any such third party’s website or services.FX Empire and its employees, officers, subsidiaries and associates, are not liable nor shall they be held liable for any loss or damage resulting from your use of the website or reliance on the information provided on this website.Risk DisclaimersThis website includes information about cryptocurrencies, contracts for difference (CFDs) and other financial instruments, and about brokers, exchanges and other entities trading in such instruments. Both cryptocurrencies and CFDs are complex instruments and come with a high risk of losing money. You should carefully consider whether you understand how these instruments work and whether you can afford to take the high risk of losing your money.FX Empire encourages you to perform your own research before making any investment decision, and to avoid investing in any financial instrument which you do not fully understand how it works and what are the risks involved.
Natural gas price settled on slight gain in its last intraday trading, attempting to recover some of its previous losses, and it attempts to offload some of its clear oversold conditions on the (RSI), especially with the beginning of the emergence of the positive signals, amid the dominance of the main bearish trend on the short-term, and its affection by exiting bullish correctional channel’s range on the short-term basis, with the continuation of the negative pressure due to its trading below EMA50.
Therefore, our expectations suggest natural gas price decline in its upcoming intraday trading, if the resistance settles at $3.40, to target the initial support level at 43.25 preparing to break it.
The expected trading range for today is between $3.20 and $3.40
Trend forecast: Bearish
High-Accuracy Trading Signals – Provided by BestTradingSignal.com
Subscribe now to professional, carefully structured packages covering major global markets. Receive signals directly via Telegram from our expert team.
The longer your subscription, the bigger the discount and the better the rate.
See the full results here: Trading Signal Results by BestTradingSignal.com; Week of July 14–18, 2025

Being above the 50 Day EMA is bullish obviously, but we also have a major trend line underneath that continues to offer support. If we were to break down below the uptrend line, and clear the 1.3350 level to the downside, then we could see something rather significant as far as a drop is concerned, perhaps a move down to the 1.31 level where the 200 Day EMA currently resides. However, I think that is very unlikely at the moment, mainly due to the fact that it would probably take the US dollar strengthening against almost everything. Ultimately, this is a market that remains bullish over the longer term, but we are sitting in an area that could dictate where we go for the next several handles.
Keep in mind that the US dollar of course is being thrown around by the idea of what the Federal Reserve may or may not do, as traders are looking for some type of handout in the form of lower interest rates. Ironically, the economic numbers coming out the United States have not shown an economy that is cooling off, so whether or not the Federal Reserve will actually cut anytime soon remains to be seen. However, it’s also worth noting that the British pound has outperformed other currencies against the US dollar for a couple of years now, even on the way down.
Ready to trade our daily GBP/USD Forex forecast? Here’s some of the best forex broker UK reviews to check out.
Christopher Lewis has been trading Forex and has over 20 years experience in financial markets. Chris has been a regular contributor to Daily Forex since the early days of the site. He writes about Forex for several online publications, including FX Empire, Investing.com, and his own site, aptly named The Trader Guy. Chris favours technical analysis methods to identify his trades and likes to trade equity indices and commodities as well as Forex. He favours a longer-term trading style, and his trades often last for days or weeks.
Ahead of anticipated new statements from US Central Bank Governor Jerome Powell today, Tuesday, July 22, 2025, the EUR/USD currency pair attempted to move above the 1.1700 resistance, recovering from its recent losses that pushed it towards the 1.1556 support level by the end of last week’s trading. The Euro’s stability comes as investors await the European Central Bank’s (ECB) monetary policy decision and closely monitor trade developments between the EU and the United States.
On the monetary policy front, the European Central Bank is expected to keep interest rates unchanged next Thursday after eight consecutive cuts, with policymakers adopting a wait-and-see approach amid uncertainty about the impact of higher-than-expected US tariffs and the strong Euro on European growth and inflation. Meanwhile, EU envoys are preparing to meet this week to discuss emergency measures in case no agreement is reached with US President Donald Trump, whose stance on tariffs appears to have hardened ahead of the August 1st deadline.
The technical forecasts for EUR/USD still indicate that the currency pair is moving within a counter-bearish channel, supported by its move below the 1.1600 support level. With the gains at the start of the week, the 14-day RSI (Relative Strength Index) has returned to around a reading of 56, moving away from the midline, which gives bulls renewed momentum to push higher. As a result, the MACD (Moving Average Convergence Divergence) lines are returning to neutrality. According to the daily timeframe chart performance, the 1.1770 and 1.1830 resistance levels will remain crucial to avoid the recent collapse, and at the same time, expectations for the psychological 1.2000 resistance are re-emerging.
” dir=”auto” id=”content-1686574122635″>
On the downside, over the same timeframe, trading the Euro below $1.16 will remain important for a bearish reversal and give bears enough momentum to move towards stronger losses. Euro trading today is not anticipating significant economic releases from the Eurozone, and the reaction to US Central Bank Governor Jerome Powell’s statements will be most important for the currency pair.
We advise to sell EUR/USD, but without excessive risk, and to monitor factors influencing the currency market.
According to observations by forex trading experts, Euro trading is experiencing a temporary upward trend, but it remains stable against the US dollar. Certainly, not many events are expected this week, as forex markets appear relatively quiet for now. While there are no major events on the US calendar, the EU and Japan will have to approve or reject new trade agreements with the United States within the next ten days, with President Donald Trump’s August 1st deadline approaching. Headlines regarding this issue could introduce some short-term volatility into the market.
Trading fundamentals suggest that trade agreements will benefit the US dollar, as they will reduce the likelihood of negative domestic economic shocks stemming from import tariffs. Reports indicate that the United States also wishes to apply comprehensive tariffs on EU goods exceeding 10% with few exceptions.
The main event this week is the European Central Bank (ECB) meeting, where interest rates are expected to remain at their current levels, signifying an end to its rate-cutting cycle. Last June, President Lagarde stated that the ECB is well-positioned to handle the current uncertain environment, emphasizing that further cuts are not guaranteed. Experts expect the ECB to keep the deposit facility rate at 2.0% at its meeting scheduled for July 24th, and we do not anticipate any further rate cuts after that. However, the risk of this decision stems from the possibility of an escalation in the trade dispute between the EU and the US, and a further appreciation of the Euro against the dollar.
Overall, if the ECB concludes its interest rate cuts, the Euro will receive good support from a future interest rate differential perspective. However, most market participants believe it will cut interest rates again in September for the final time. Even if it does, the broader picture is that the United States will likely see larger interest rate cuts in the coming months compared to the Eurozone, which supports the Euro against the dollar.
Ready to trade our EUR/USD daily forecast? Here’s a list of some of the top forex brokers in Europe to check out.
The GBPJPY pair rose in its last intraday levels, affected by its lean on the support of minor bullish trend line on the short-term basis, gaining positive momentum, accompanied by the emergence of the negative signals on the (RSI), after reaching oversold levels, attempting to surpass the negative pressure on the EMA50, announcing its full recovery.
Therefore, our expectations suggest a rise of (GBPJPY) in its upcoming intraday trading, if the support settles at 198.70, to target the critical resistance level at 199.80.
The expected trading range for today is between 198.75 and 199.80
Trend forecast: Bullish
Silver (XAG/USD) starts the week on firmer ground after a mild pullback last week. As of now, the metal is trading near $38.50 during the early American trading hours on Monday, just shy of the multi-year high of $39.13 set on July 14. Although the recent rally has lost some momentum, technical indicators are turning bullish again across both short-term and longer-term charts.
The rebound is also supported by a softer US Dollar, which is trading under pressure on Monday amid easing Treasury yields and cautious risk sentiment.
On the hourly chart, Silver is showing signs of renewed strength after forming a local bottom near $37.50, following a break above a descending trendline. The spot price now holds above both the 50- and 21-period Exponential Moving Averages (EMAs). Both moving averages are sloping slightly upward and acting as dynamic intraday support, indicating fresh buying interest.
Momentum is also firming up. The Relative Strength Index (RSI) has climbed into the overbought zone near 70, reflecting strong bullish momentum. While slightly stretched, the setup remains constructive as long as the RSI holds above 60. Meanwhile, the Average Directional Index (ADX) is pointing north currently at 20, hinting at a possible strengthening in trend momentum. However, a confirmed breakout above the $38.80-$39.00 resistance band could quickly ignite a stronger directional push.
Key short-term levels:
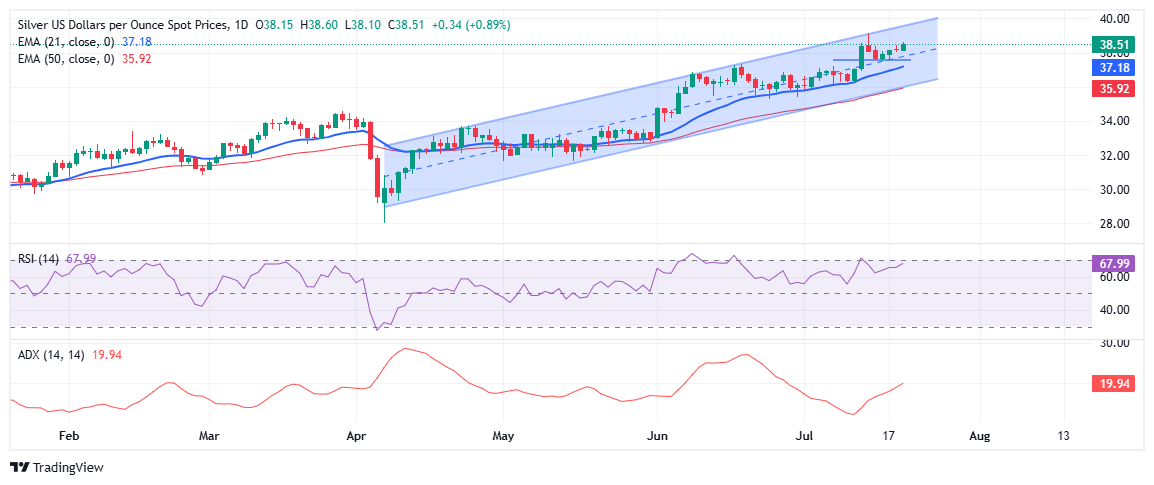
Zooming out to the daily chart, Silver remains firmly embedded in an uptrend, supported by a clearly defined ascending channel that has held since early April. The recent rally to $39.13 shows strong buying interest in Silver, supported by ongoing economic uncertainty and global tensions.
Despite last week’s modest pullback from multi-year highs, the broader structure remains intact. Silver continues to trade comfortably above the 21-day EMA at $37.18 and the 50-day EMA at $35.92—both serving as solid dynamic support and aligning with the lower boundary of the rising channel.
The RSI is nearing the overbought level, currently at 68, indicating buyers are gaining strength. Meanwhile, the ADX has increased to 20.00, showing that the trend is in its early stages. As long as Silver holds above the $37.00-$37.50 region, the broader bullish bias remains intact. A decisive breakout above $39.13 could pave the way for a run toward the key psychological barrier at $40.00.
Silver is a precious metal highly traded among investors. It has been historically used as a store of value and a medium of exchange. Although less popular than Gold, traders may turn to Silver to diversify their investment portfolio, for its intrinsic value or as a potential hedge during high-inflation periods. Investors can buy physical Silver, in coins or in bars, or trade it through vehicles such as Exchange Traded Funds, which track its price on international markets.
Silver prices can move due to a wide range of factors. Geopolitical instability or fears of a deep recession can make Silver price escalate due to its safe-haven status, although to a lesser extent than Gold’s. As a yieldless asset, Silver tends to rise with lower interest rates. Its moves also depend on how the US Dollar (USD) behaves as the asset is priced in dollars (XAG/USD). A strong Dollar tends to keep the price of Silver at bay, whereas a weaker Dollar is likely to propel prices up. Other factors such as investment demand, mining supply – Silver is much more abundant than Gold – and recycling rates can also affect prices.
Silver is widely used in industry, particularly in sectors such as electronics or solar energy, as it has one of the highest electric conductivity of all metals – more than Copper and Gold. A surge in demand can increase prices, while a decline tends to lower them. Dynamics in the US, Chinese and Indian economies can also contribute to price swings: for the US and particularly China, their big industrial sectors use Silver in various processes; in India, consumers’ demand for the precious metal for jewellery also plays a key role in setting prices.
Silver prices tend to follow Gold’s moves. When Gold prices rise, Silver typically follows suit, as their status as safe-haven assets is similar. The Gold/Silver ratio, which shows the number of ounces of Silver needed to equal the value of one ounce of Gold, may help to determine the relative valuation between both metals. Some investors may consider a high ratio as an indicator that Silver is undervalued, or Gold is overvalued. On the contrary, a low ratio might suggest that Gold is undervalued relative to Silver.
Spot Gold surged in the European session Monday, flirting with the $3,400 level after Wall Street’s opening. The strong momentum in the bright metal comes from the broad US Dollar’s (USD) weakness, as the American currency keeps suffering from fiscal and political woes.
Trade-related tensions took centre stage in the absence of relevant data, with the focus particularly in negotiations between the United States (US) and the European Union (EU). Undergoing negotiations between the two economies is not enough to pause threats and retaliatory measures announcements. On the one hand, the White House noted that the deadline, set for August 1, will not be changed, while a base tariffs could be set at 30%. The EU, in the meantime, announced it’s studying retaliatory levies, should the US moves forward.
Other than that, Republican House Anna Paulina Luna is referring Federal Reserve (Fed) Chairman Jerome Powell to the Department of Justice (DOJ) for criminal charges, accusing him of perjury on two occasions. Additionally, Treasury Secretary Scott Bessent proposed a review of the whole Fed. “What we need to do is examine the entire Federal Reserve institution and whether they have been successful,” Bessent said on Monday.
The daily chart for the XAU/USD pair shows it largely recovered above the 61.8% Fibonacci retracement of the $3,452.51 – $3,247.83 at around $3,374, opening the door for a recovery towards the top of the range. The same chart shows the pair is well above a now flat 20 Simple Moving Average (SMA), which consolidates at around $3,330, while the 100 SMA maintains its form bullish slope far below the shorter one, in line with the dominant bullish trend. Finally, technical indicators remain within positive levels with uneven upward strength, yet still suggesting higher highs ahead.
The near-term picture is supportive of another leg north, as technical indicators in the 4-hour chart reached overbought readings. The Momentum indicator maintains its almost vertical slope, while the Relative Strength Index (RSI) indicator decelerated, but keeps aiming north at around 71. At the same time, XAU/USD is far above all its moving averages, with the 100 and 200 SMA lacking directional strength, but the 20 SMA heading higher above the longer ones, skewing the risk to the upside.
Support levels: 3,390.10 3,374.50 3,350.00
Resistance levels: 3,403.20 3,417.90 3,430.35
The higher timeframe monthly chart has also turned bearish. Last week a bearish shooting star candlestick pattern triggered on the monthly chart. Given today’s bearish price action, it needs to be considered as the longer-term patterns influence the shorter. However, it is not just the one-month breakdown that is of concern. A bullish breakout of an inside month triggered the month before in June. Therefore, this month’s breakdown is also a failure of the bullish signal the month before. Failed breakouts can result in sharp moves in the opposite direction. Nonetheless, it indicates downside pressure on the price of natural gas.
For perspective, a bearish measured move (light blue) was added to the current downswing on the chart. It matches part of the prior bearish correction that began following the March trend high on a percentage basis. Moreover, the bearish correction prior to March completed after a 31.6% decline in the price of natural gas. Interestingly, the target from that measured move matches a 78.6% Fibonacci retracement level at $2.80. But for that level to be reached higher and potentially significant support would need to be broken.
If the interim May swing low at $3.10 is broken, the next lower target zone becomes more likely to be reached. That low is also a monthly low from May. There are two dynamic support lines of significance. A long-term rising trendline is in purple, and it connects to the August 2024 swing low. It represents the lower boundary area of a long-term rising trend channel.
Earlier this year resistance was seen on several occasions around the top channel line. Once there is a reversal from one side of a pattern, there is a possibility that price eventually reaches the other side. Given the second break below an internal uptrend line today, that lower line comes into focus. In addition, there is AVWAP line that is close to converging with the uptrend line.
For a look at all of today’s economic events, check out our economic calendar.


")
")


