The main category of Forex News.
You can use the search box below to find what you need.
[wd_asp id=1]
The main category of Forex News.
You can use the search box below to find what you need.
[wd_asp id=1]
May 26, 2025 – Written by Tim Boyer
STORY LINK Euro to Dollar Forecast for Week Ahead: EUR Pares Gains on USD Rebound
Morgan Stanley expects on-going dollar vulnerability with EUR/USD strengthening to 1.20 at the end of next year and 1.27 by the end of 2026.
BNP Paribas has downgraded its dollar outlook and forecasts that Euro to Dollar exchange rate (EUR/USD) gains to 1.18 by the end of 2025.
Credit Agricole notes the risks, but expects EUR/USD gains will be held to 1.14 with a 1.10 level by the end of next year.
Overall dollar confidence has dipped again with fears over budget trends, trade uncertainty and a rotation of assets away from US markets.
There was fresh market turbulence on Friday following President Trump’s threat to impose 50% tariffs on EU exports to the US from June 1st.
This would be much higher than the baseline tariff of 10% and substantially above the 20% tariff threatened in April.
ING noted that the threat could well be a blatant negotiating tactic to secure concessions from the EU.
![]()
ING did, however, warn over the potential impact; “Volatility is back. And just to be sure, if fully implemented, 50% US tariffs on European products would shave off some 0.6ppt of GDP growth and bring the eurozone economy close to recession territory. Needless to say, it would also increase stagflationary pressures in the US again.”
Bank of America commented; “we see US tariffs as bad for Europe, but worse for the US.”
Tellingly, although there would be notable costs to the Euro-Zone economy, the Euro recovered from lows and EUR/USD posted fresh gains to around 1.1365 while the dollar index dipped sharply to 3-week lows.
MUFG outlined another strand of dollar vulnerability; “At the same time, USD weakness has been driven by building speculation that the Trump administration is putting pressure on other countries to allow their currencies to strengthen against the USD as part of deals to prevent higher “reciprocal tariffs” from being implemented after 9th July deadline.”
According to Credit Agricole; “the USD could thus remain vulnerable if we see more evidence of persistent selling pressure in the US equity and FI markets.”
It added; “That being said, many negatives seem to be already in its price and potential indications today that the US PMIs have consolidated could help the USD stabilise. We also think that the US will not abandon its strong USD policy.”
The downgrading of the US credit rating from AAA undermined confidence early in the week and there were also underlying budget fears as the House of Representatives passed the budget Bill.
![]()
MUFG commented; “The loss of confidence in the USD and US policymaking reflects increased concerns over the fiscal outlook in the US.”
It added; “While the downgrade should have limited impact in forcing investors to adjust exposure to US Treasuries, it provides another timely reminder of the deteriorating US fiscal outlook which remains a structural headwind for the USD.”
According to Deutsche Bank; “At the core of our views in coming months is that the market is becoming increasingly driven by external asset positions, and this is putting combined downward pressure on US bond markets and the USD.”
Deutsche expects risk assets will be vulnerable; “The 2023-24 period saw a combined rise in US yields and equities as the market was revising US growth expectations higher. Today is very different. It is all a building fiscal risk premium into US assets. It is hard to make the case that such a (negative) driver of the rising cost of capital is positive for risk assets.
A key element, therefore, will be whether the dollar can secure defensive inflows.
According to Morgan Stanley this is doubtful; “The combination of elevated policy uncertainty, increased trade restrictions, and an immigration policy-driven decline in labor force growth leads to an underperformance of USD.”
The Euro-Zone recorded a huge current account surplus for the first quarter of 2025, illustrating structural strength.
BNP Paribas sees scope for capital inflows to the Euro area; “Our analysis suggests that eurozone investors are both overweight and underhedged the USD. As a result, we expect the EUR to be a key beneficiary of a potential switch out of US assets.”
International Money Transfer? Ask our resident FX expert a money transfer question or try John’s new, free, no-obligation personal service! ,where he helps every step of the way,
ensuring you get the best exchange rates on your currency requirements.
Silver price (XAG/USD) remains steady after registering more than 1% gains in the previous session, trading around $33.40 per troy ounce during the European hours on Monday. Safe-haven demand for precious metals, including Silver, weakened due to easing trade war between the United States (US) and the European Union (EU).
The risk sentiment improves US President Donald Trump extended the tariff deadline on the European Union (EU) from June 1 to July 9. Trump stepped back after threatening to impose a 50% tariff on imports from the European Union.
However, the downside of the Silver price could be limited as the safe-haven demand would strengthen amid growing uncertainty surrounding the US economy. US fiscal deficit could increase further when Trump’s “One Big Beautiful Bill” passes on Senate floor.
On Sunday, US Senator Ron Johnson said in an interview on CNN, “I think we have enough votes to stop the process until the President gets serious about spending reduction and reducing the deficit.” “My primary focus now is spending. This is completely unacceptable. Current projections are a $2.2 trillion per year deficit,” Johnson added.
Moreover, Silver attracted buyers after Moody’s downgraded the US credit rating from Aaa to Aa1. Moody’s now projects US federal debt to climb to around 134% of GDP by 2035, up from 98% in 2023, with the budget deficit expected to widen to nearly 9% of GDP.
Chicago Federal Reserve (Fed) President Austan Goolsbee noted on Friday that adjustments in the Fed’s interest rates are likely to be delayed due to Trump’s latest tariff threats. Meanwhile, Kansas City Fed President Jeffrey Schmid said that policymakers will gauge hard data before deciding on interest rate decisions, and the Fed needs to be careful how much emphasis it puts on soft data.
Silver is a precious metal highly traded among investors. It has been historically used as a store of value and a medium of exchange. Although less popular than Gold, traders may turn to Silver to diversify their investment portfolio, for its intrinsic value or as a potential hedge during high-inflation periods. Investors can buy physical Silver, in coins or in bars, or trade it through vehicles such as Exchange Traded Funds, which track its price on international markets.
Silver prices can move due to a wide range of factors. Geopolitical instability or fears of a deep recession can make Silver price escalate due to its safe-haven status, although to a lesser extent than Gold’s. As a yieldless asset, Silver tends to rise with lower interest rates. Its moves also depend on how the US Dollar (USD) behaves as the asset is priced in dollars (XAG/USD). A strong Dollar tends to keep the price of Silver at bay, whereas a weaker Dollar is likely to propel prices up. Other factors such as investment demand, mining supply – Silver is much more abundant than Gold – and recycling rates can also affect prices.
Silver is widely used in industry, particularly in sectors such as electronics or solar energy, as it has one of the highest electric conductivity of all metals – more than Copper and Gold. A surge in demand can increase prices, while a decline tends to lower them. Dynamics in the US, Chinese and Indian economies can also contribute to price swings: for the US and particularly China, their big industrial sectors use Silver in various processes; in India, consumers’ demand for the precious metal for jewellery also plays a key role in setting prices.
Silver prices tend to follow Gold’s moves. When Gold prices rise, Silver typically follows suit, as their status as safe-haven assets is similar. The Gold/Silver ratio, which shows the number of ounces of Silver needed to equal the value of one ounce of Gold, may help to determine the relative valuation between both metals. Some investors may consider a high ratio as an indicator that Silver is undervalued, or Gold is overvalued. On the contrary, a low ratio might suggest that Gold is undervalued relative to Silver.
The pair has undergone a powerful downtrend recently, marked by sharp red candlesticks and clear breaches of previous support levels, confirming a decidedly negative short-term trend. Furthermore, the rapid drop from 0.0391 to 0.0256 indicates a complete loss of positive momentum and increasing selling pressure on the Turkish Lira.

The price is currently trading below all major moving averages, reinforcing the bearish outlook for the pair. Momentum indicators (like the RSI) also show entry into oversold regions, opening the door for a potential temporary technical rebound towards nearby resistance levels. However, continued trading below 0.0300 maintains the negative outlook, with the possibility of testing new support levels unless monetary authorities intervene, or signs of imminent economic stability emerge.
Given the sharp declines and the Lira’s loss of value, it’s advised not to risk large positions without clear confirmations, especially in the absence of internal economic stability. Speculators can capitalize on the current volatility with a short-term trading approach between support and resistance levels, while strictly adhering to capital management and stop-loss discipline.
Negative pressure on the Turkish Lira is likely to persist this week, unless there’s intervention from the Turkish Central Bank or the release of positive economic data supporting the currency. Moreover, the expected trading range will be between the 0.0245 support level and the nearby 0.0300 resistance. A break of current support could open the way to lower levels; while breaching resistance and holding above it might change the short-term direction and prepare the pair for a rebound towards 0.0340.
Given the high volatility of the USD/TRY pair, traders should exercise caution and avoid emotional decisions. It’s crucial to follow economic and political developments in Turkey, especially those related to interest rate and inflation policies. Decisively, relying on a short-term trading strategy supported by strong technical signals and strict risk management is highly recommended.
Ready to trade our Forex daily analysis and predictions? Here are the best Turkish brokers to choose from.
The DFX Team at DailyForex is a group of veteran financial analysts, traders, and brokerage industry experts dedicated to producing in-depth broker reviews and cutting-edge market insights, plus analysis of market trends. Holding over 16 years of experience in global financial markets, and 4 B.A. level academic qualifications in relevant degrees, we conduct thorough, unbiased evaluations of brokers to enable traders make informed decisions, using the most advanced methodology in the industry. Also, the DFX team is involved in generating technical analysis, signals, and trading strategies, with a consistent commitment to accuracy and transparency. Whether you’re a beginner or a professional trader, the DFX Team works to ensure you have the tools and insights you need to succeed as a trader in the retail CFD industry.
Trump’s decision to extend the deadline for 50% tariffs on EU goods to July 9 briefly reduced geopolitical tension. Over the weekend, the U.S. President said he agreed to an extension after a phone call with European Commission President Ursula von der Leyen, calling it a “privilege” to accommodate ongoing trade talks. This move countered last week’s aggressive rhetoric, when Trump threatened a “straight 50% tariff” and floated a 25% levy on Apple iPhones made outside the U.S.
Despite Monday’s softness, gold remains well bid above key support at $3,166.46 and $3,018.52. Last week, gold posted its strongest weekly performance in six weeks, rising 4.8% to $3,358.13. A drop in the U.S. dollar index—down 1.5% for the week—reflected intensifying concerns about the U.S. fiscal position. Traders continue to rotate out of dollar-denominated assets, with net short positions swelling to $17.3 billion.
Market anxiety over ballooning U.S. deficits intensified after Moody’s downgraded U.S. sovereign credit and the House passed Trump’s tax-heavy spending bill. The CBO projects this could swell the deficit by nearly $4 trillion. Long-end yields surged, with the 30-year Treasury yield hitting 5.14%, raising fears of debt monetization and inflation. As a result, gold gained favor over traditional U.S. assets.
China’s net gold imports via Hong Kong more than doubled in April, reaching the highest levels since March. This uptick in physical demand underscores global investor interest in gold as a hedge against both policy risk and currency depreciation.
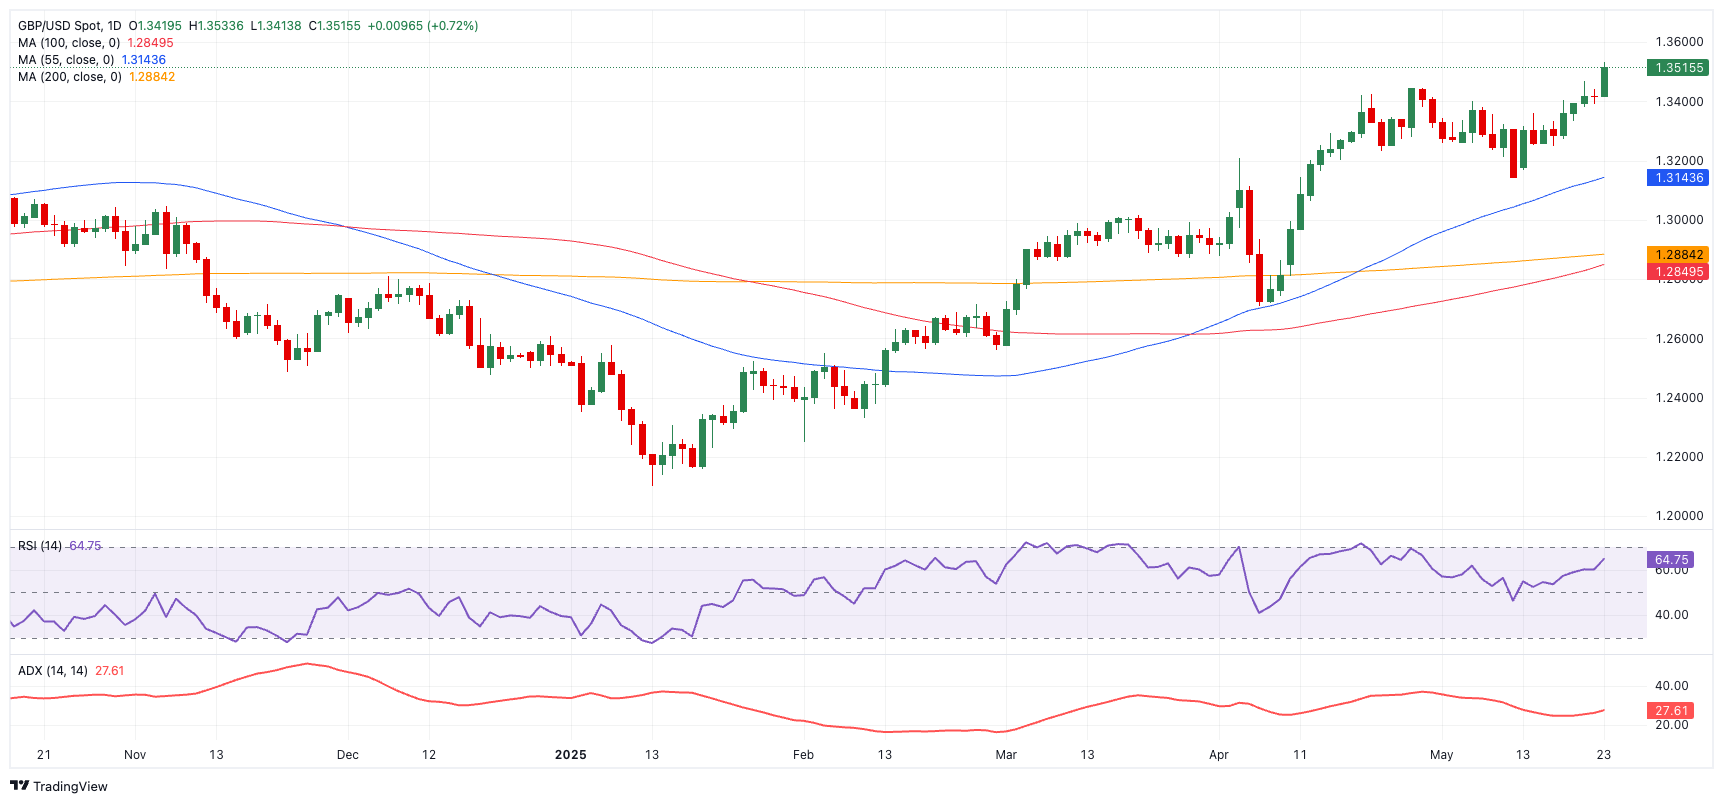
GBP/USD started the week on a bullish note and touched its highest level since February 2022 near 1.3600. The pair corrects lower in the European session and the technical outlook suggests that it remains overbought in the near term.
The US Dollar (USD) came under strong selling pressure on Friday and fuelled a decisive rally in GBP/USD heading into the weekend as United States (US) President Donald Trump threatened the European Union (EU) with 50% tariffs, noting that their discussions were going nowhere. Read more…
The daily chart presents a distinctly bullish scenario for GBPUSD, showcasing strong impulsive characteristics in its current Elliott Wave configuration. This setup places the developing navy blue wave 3 within the broader gray wave 1, signaling the completion of the corrective navy blue wave 2 and the start of a potential long-lasting bullish impulse. This suggests GBPUSD has entered the most aggressive stage of its upward cycle. Read more…
The British Pound held a firm tone throughout the week, pushing GBP/USD beyond the 1.3500 mark on Friday, territory last seen in late February 2022.
Sterling’s advance was driven largely by sustained pressure on the US Dollar (USD), which accelerated in the latter part of the week following President Donald Trump’s threat to impose 50% tariffs on European Union (EU) imports. Read more…
The GBPJPY pair began today’s trading with clear positivity, getting advantage of the unionism of the main indicators for providing positive momentum, to notice achieving some gains by its current stability above the obstacle at 193.30 level.
Therefore, forming extra support at 192.50 level makes us keep the bullish suggestion, reminding you that the extra targets is located near 194.60 level reaching 23.6%Fibonacci correction level at 195.65.
The expected trading range for today is between 192.60 and 194.60
Trend forecast: Bullish
Do you need help in trading decisions? Do you want to learn how to start trading?
Join Economies.com VIP Club and benefit from over 15 years of market analysis expertise and get:
Special Offer: Subscribe to the Economies.com VIP channel and get also a free subscription to a trusted trading signals channel provided by Best Trading Signal.
The EUR/USD pair trades near a weekly high of 1.1365 ahead of the close, as the US Dollar (USD) remains pressured by political and fiscal headlines. The Euro (EUR) surged on broad USD dumping, but tepid local data limited the advance.
Trade tensions somehow returned amid the lack of progress in negotiations and fresh tensions between the United States (US) and China. Both countries agreed on a 90-day truce and reduced massive retaliatory tariffs a couple of weeks ago, boosting the market’s optimism. However, things deteriorated after the US issued an industry warning against using Chinese chips, targeting the Asian giant Huawei. By the end of the week, Washington and Beijing agreed to maintain communication, but optimism among investors faded.
Tensions also arose between the US and Japan, as the latter is unwilling to fulfil US demands. Furthermore, the Japanese government made it clear that there is no use for an agreement unless Washington eliminates tariffs, particularly a 25% levy on autos and car parts. Talks seem to have stalled after Japan’s top trade negotiator Ryosei Akazawa noted Japan will not rush to seal a trade deal if that puts the country’s interests at risk.
Adding fuel to the fire, Trump pledged a straight 50% tariffs on European Union (EU) imports starting June 1st. Through a Truth Social post on Friday, Trump claimed trade talks with the EU are going nowhere, and once again repeated that the sole purpose of the European Union was “to take advantage of the US on trade.”
But it’s not all about the trade war. US President Donald Trump is now focused on his ‘One Big Beautiful Bill Act’, a major bill aimed at reshuffling taxes and government spending. Tax cuts within the bill for individuals and corporations are expected to increase the country’s outstanding debt by between $3 and $5 billion, fueling concerns about the US economic health. The bill passed the House of Representatives on Thursday by a slim margin and now moves to the Senate, which will discuss it in the upcoming days.
S&P Global and the Hamburg Commercial Bank (HCOB) released the preliminary estimates of the May Purchasing Managers’ Index (PMI) for both economies. The surveys showed a steeper downturn in European businesses as new orders continued to decrease. A sharp contraction in services output led the way lower, with the German index falling to 47.2, a 30-month low from the previous 49, and the Eurozone (EU) one posting 48.9, down from 50.1 in April. A modest uptick in manufacturing was not enough to compensate for the slide, resulting in the EU Composite PMI shrinking to 49.5 from the previous 50.4.
US figures, on the other hand, were upbeat. Manufacturing output improved to 52.3 from 50.2 in April, while the Services PMI rose to 52.3 from 50.8 in the same period. As a result, the Composite PMI surged to 52.1 after posting 50.6 in April, a two-month high. Still, the figures were just enough to help EUR/USD correct lower before it resumed its advance.
Finally, Germany released the IFO Survey, showing a modest uptick in Business Climate, up to 87.5 in May from the 86.9 posted in April. Expectations improved to 88.9, although the assessment of the current situation missed expectations and printed at 86.1.
Additionally, European Central Bank (ECB) President Christine Lagarde hit the wires on Friday and warned international trade will be “changed forever” by trade-related tensions triggered by the US decision to impose tariffs on most major trading partners.
“Warned that international trade will be changed forever by the tensions over tariffs,” Lagarde added, before noting countries need to question the links of dependency they have with each other and with the US.
The macroeconomic calendar will include some interesting events in the upcoming days. The US Federal Open Market Committee (FOMC) will release the Minutes of the latest meeting on Wednesday, while a revision of the US Q1 Gross Domestic Product (GDP) will be out on Thursday.
The focus will shift to Germany on Friday, as the country will release April Retail Sales and the preliminary estimate of the May Harmonized Index of Consumer Prices (HICP). Also on Friday, the US will publish April Personal Consumption Expenditures (PCE) Price Index figures, the Federal Reserve’s (Fed) favorite inflation gauge.
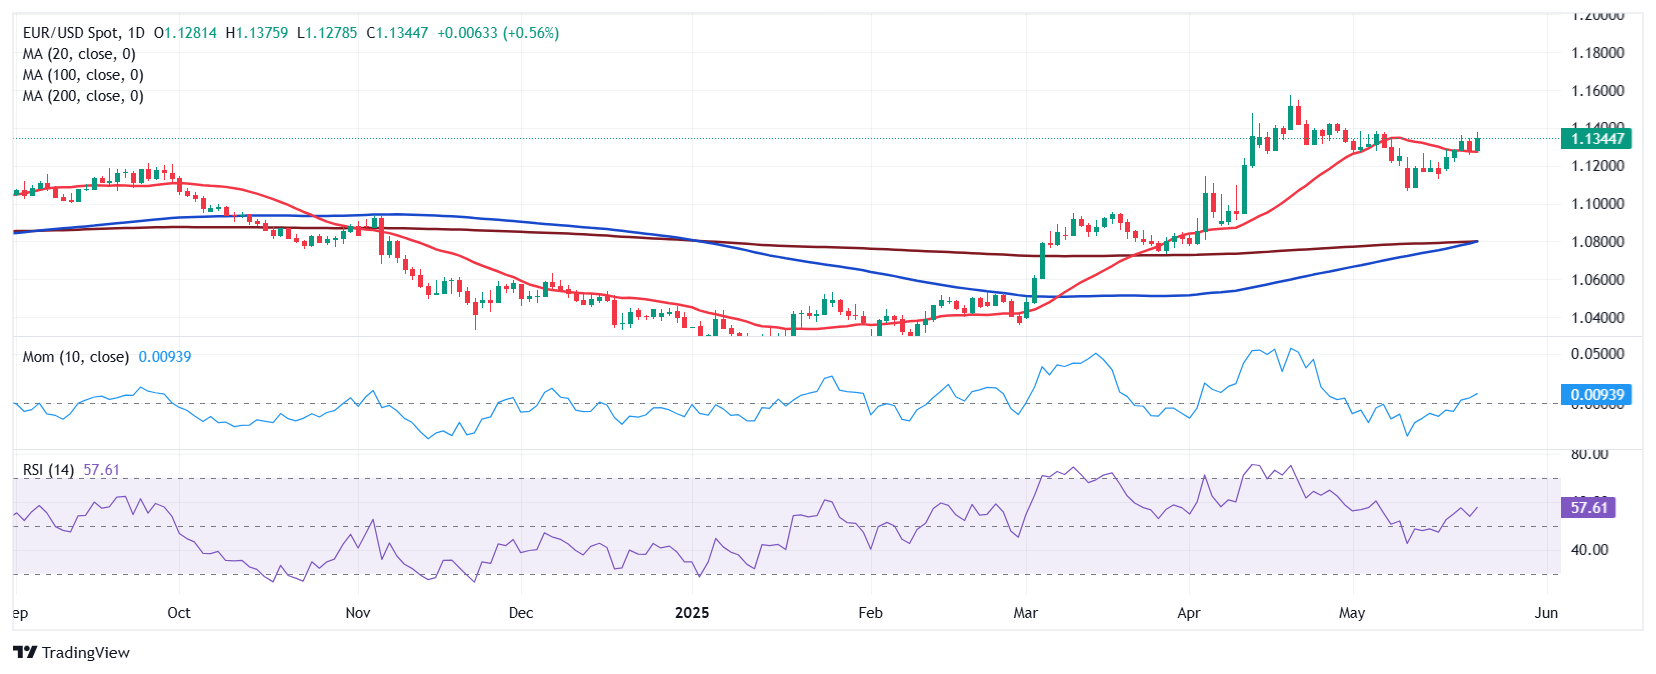
From a technical point of view, the risk skews to the upside. The weekly chart for the EUR/USD pair shows it reversed its losing streak and resumed its advance after correcting overbought conditions. The pair trades well above all its moving averages, with a firmly bullish 20 Simple Moving Average (SMA) crossing above directionless and converging 100 and 200 SMAs, all gathering around 1.0830. Technical indicators, in the meantime, turned neutral to marginally bullish well above their midlines, suggesting higher highs are likely in the upcoming days.
The EUR/USD pair is neutral-to-bullish according to technical readings in the daily chart. The pair broke above a now flat 20 SMA at around 1.1270, which attracted buyers for three days in a row. At the same time, the 100 SMA is about to cross above the 200 SMA, far below the short one, still supporting an upward run. Finally, the Momentum indicator hovers directionless around its midline, while the Relative Strength Index (RSI) indicator aims north at around 57, resuming its advance.
A break through the weekly high exposes the 1.1460 price zone, while the next relevant level to watch is the year high at 1.1573. Below the 1.1270 area, on the other hand, the pair has room to fall towards the 1.1160 region, while below the latter, the next relevant support level is May’s low at 1.1064.
Generally speaking, a trade war is an economic conflict between two or more countries due to extreme protectionism on one end. It implies the creation of trade barriers, such as tariffs, which result in counter-barriers, escalating import costs, and hence the cost of living.
An economic conflict between the United States (US) and China began early in 2018, when President Donald Trump set trade barriers on China, claiming unfair commercial practices and intellectual property theft from the Asian giant. China took retaliatory action, imposing tariffs on multiple US goods, such as automobiles and soybeans. Tensions escalated until the two countries signed the US-China Phase One trade deal in January 2020. The agreement required structural reforms and other changes to China’s economic and trade regime and pretended to restore stability and trust between the two nations. However, the Coronavirus pandemic took the focus out of the conflict. Yet, it is worth mentioning that President Joe Biden, who took office after Trump, kept tariffs in place and even added some additional levies.
The return of Donald Trump to the White House as the 47th US President has sparked a fresh wave of tensions between the two countries. During the 2024 election campaign, Trump pledged to impose 60% tariffs on China once he returned to office, which he did on January 20, 2025. With Trump back, the US-China trade war is meant to resume where it was left, with tit-for-tat policies affecting the global economic landscape amid disruptions in global supply chains, resulting in a reduction in spending, particularly investment, and directly feeding into the Consumer Price Index inflation.
The (USDJPY) price witnessed fluctuated trading in the intraday levels, rising temporarily affected by the stability of the key support level at 142.40, gaining positive momentum to attempt to recover some of its previous losses, at the same time it attempts to offload some of its clear oversold condition on the (RSI), especially with the beginning pf positive overlapping signals, it seems that the sellers is the dominant on the price move, it bounced quickly preparing for breaking this key support, amid its trading alongside a minor bearish trend on the short-term basis.
Do you need help in trading decisions? Do you want to learn how to start trading?
Join Economies.com VIP Club and benefit from over 15 years of market analysis expertise and get:
Special Offer: Subscribe to the Economies.com VIP channel and get also a free subscription to a trusted trading signals channel provided by Best Trading Signal.
Platinum price reached the initial extra target at $1100.00, to begin providing sideways trading, due to its neediness to the positive momentum by the stochastic attempt to exit the overbought level.
The suggested scenario depends on the stability of $1080.00 level, which represents the extra support, the stability of the support will increase the chances for renewing the bullish attempts, which might target $1125.00 level, while reaching below this support will increase the chances for renewing the bullish attempts, targeting $1125.00, while reaching below the support will delay the bullish rally, and there is a chance for forming correctional trading, which might target $1068.00 and $1060.00 level.
The expected trading range for today is between $1080.00 and $1125.00
Trend forecast: Bullish
Do you need help in trading decisions? Do you want to learn how to start trading?
Join Economies.com VIP Club and benefit from over 15 years of market analysis expertise and get:
Special Offer: Subscribe to the Economies.com VIP channel and get also a free subscription to a trusted trading signals channel provided by Best Trading Signal.


")
 Price Forecast: Bullish Setup Holds Above ,310 Despite Pullback")


