The main category of Forex News.
You can use the search box below to find what you need.
[wd_asp id=1]
The main category of Forex News.
You can use the search box below to find what you need.
[wd_asp id=1]
The USD/JPY forecast shows continued strength in the dollar amid geopolitical uncertainty. The greenback rose despite downbeat US wholesale inflation and ahead of the CPI report. Meanwhile, the yen remained fragile as traders worried about the outlook for Japan’s politics and monetary policy.
–Are you interested to learn more about Thailand forex brokers? Check our detailed guide-
The US dollar extended gains on Thursday as market participants eagerly awaited the US CPI report. Notably, the rally gained momentum after reports of an escalation in the Russia-Ukraine war. The conflict between the two countries spilled into Poland, which had to shoot down Russian drones. Consequently, there were worries of an escalation into other countries. As a result, traders sought safety in the dollar.
Meanwhile, data on Wednesday revealed softer-than-expected wholesale inflation, further supporting the view of a more dovish Fed.
“The market has positioned for the Fed to ease in September and potentially ease three times this year,” said Rodrigo Catril, currency strategist at National Australia Bank in Sydney. “The benign outcome from the PPI tells you pricing expectations look about right.”
Elsewhere, the yen remained subdued as Ishiba’s resignation caused uncertainty about the future. A new prime minister could assume a different stance regarding rate hikes, changing the outlook for monetary policy.
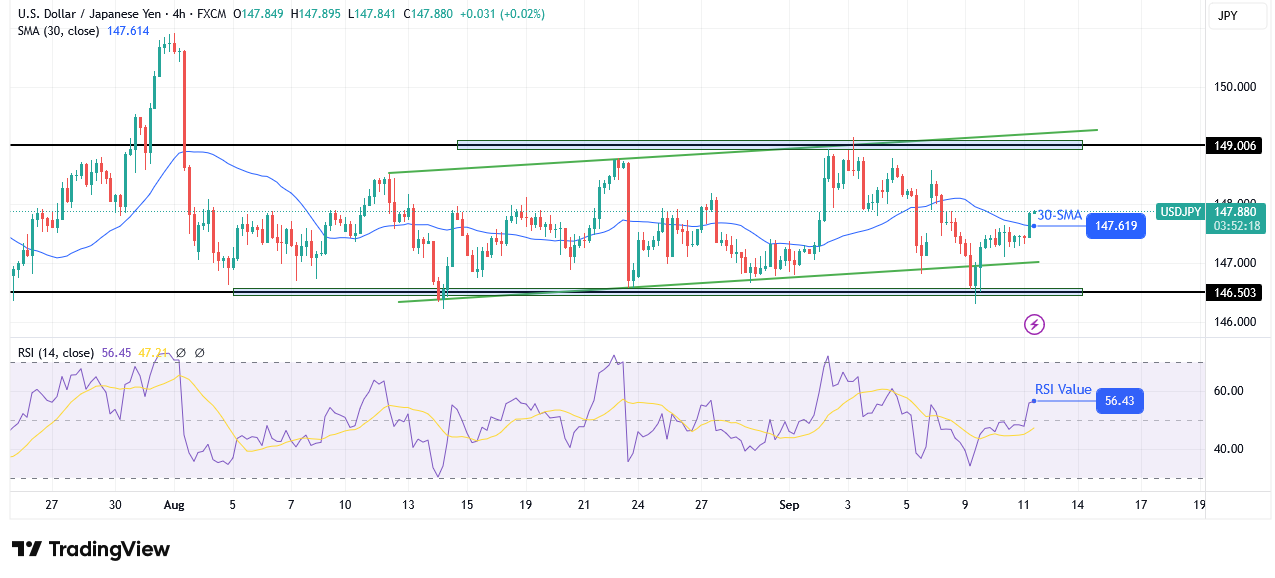
On the technical side, the USD/JPY price has broken above the 30-SMA, indicating a bullish shift in sentiment. At the same time, the RSI trades above 50, suggesting stronger bullish momentum. This is a sign that bulls have taken charge and might send the price higher.
–Are you interested to learn more about MT5 brokers? Check our detailed guide-
USD/JPY has been trading in a shallow bullish channel. Recently, bears attempted to break out of this channel. However, they failed when the price could not break below the 146.50 key support level. As a result, it rose back into the channel and broke above the 30-SMA.
With bulls in the lead, the price might soon retest the channel resistance, near the 149.00 key level. A break above this level would signal a surge in bullish momentum, leading to a steeper bullish trend. On the other hand, if the level holds firm, USD/JPY will remain in its channel.
Looking to trade forex now? Invest at eToro!
68% of retail investor accounts lose money when trading CFDs with this provider. You should consider whether you can afford to take the high risk of losing your money.
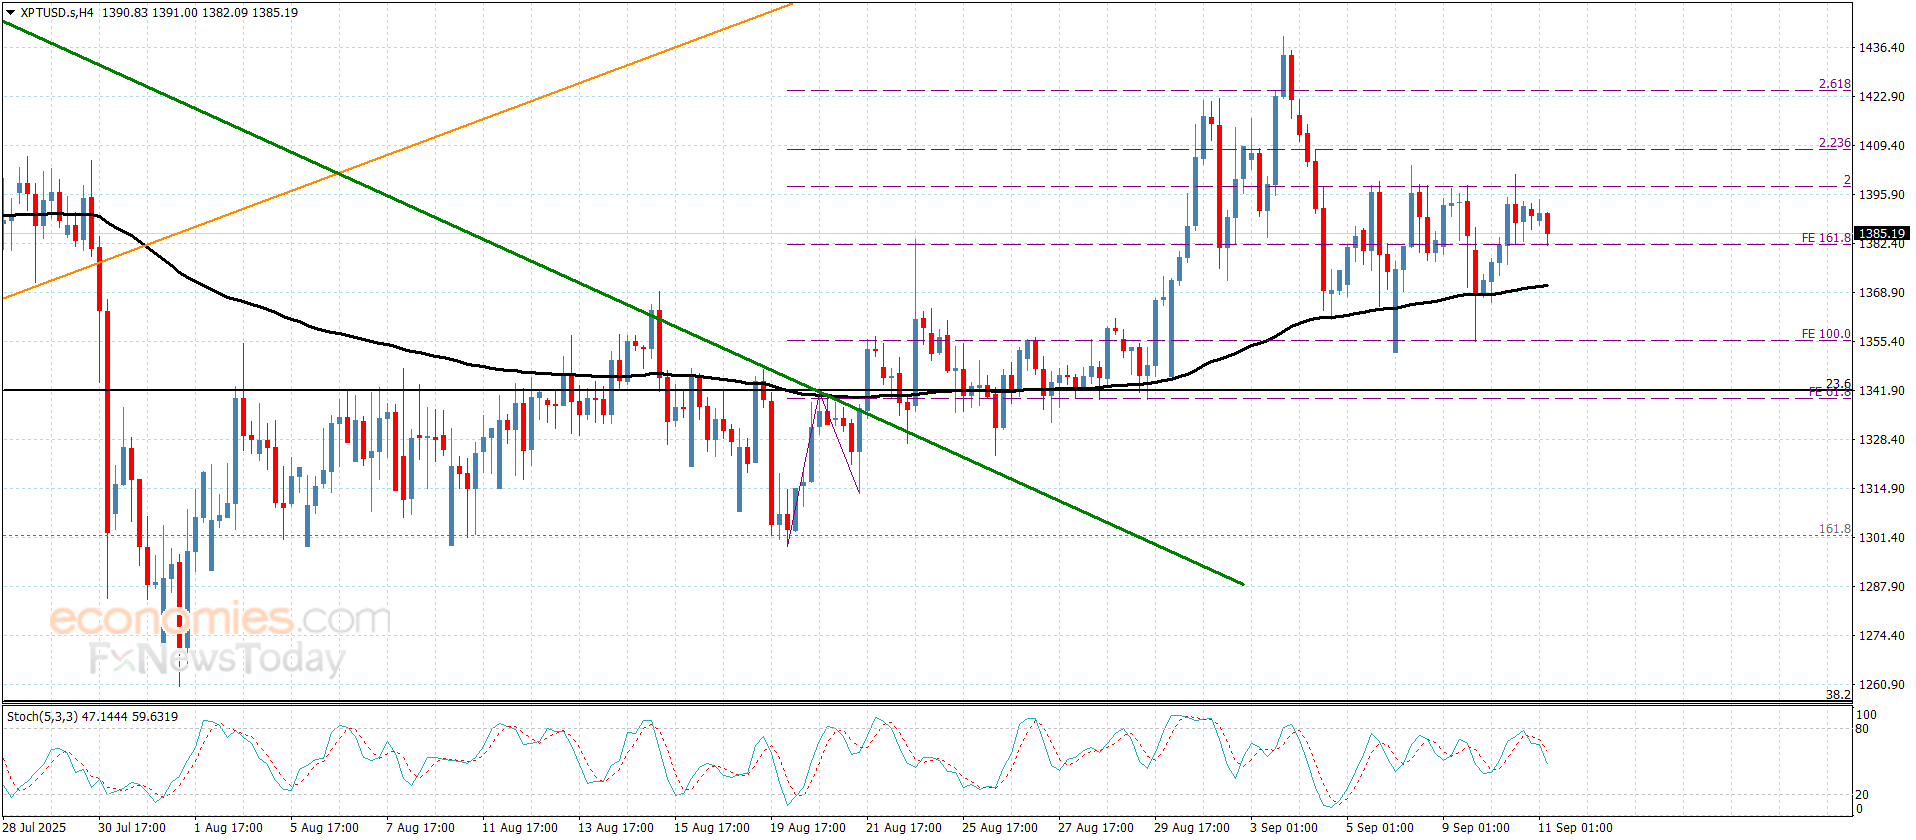
Platinum price attacked the barrier at $1400.00 yesterday, to find an exit to resume the bullish attempts, but this attempt ended by a clear failure to force it to decline temporarily towards $1381.00.
The contradiction between the main indicators might force the price to provide mixed trading until gathering extra positive momentum, to ease the mission of breaching the current barrier and begin recording extra gains by its rally to $1412.00 and $1435.00, while the attempts of changing the main trend requires achieving a real break to the support at $1340.00.
The expected trading range for today is between $1370.00 and $1412.00
Trend forecast: Fluctuated within the bullish track
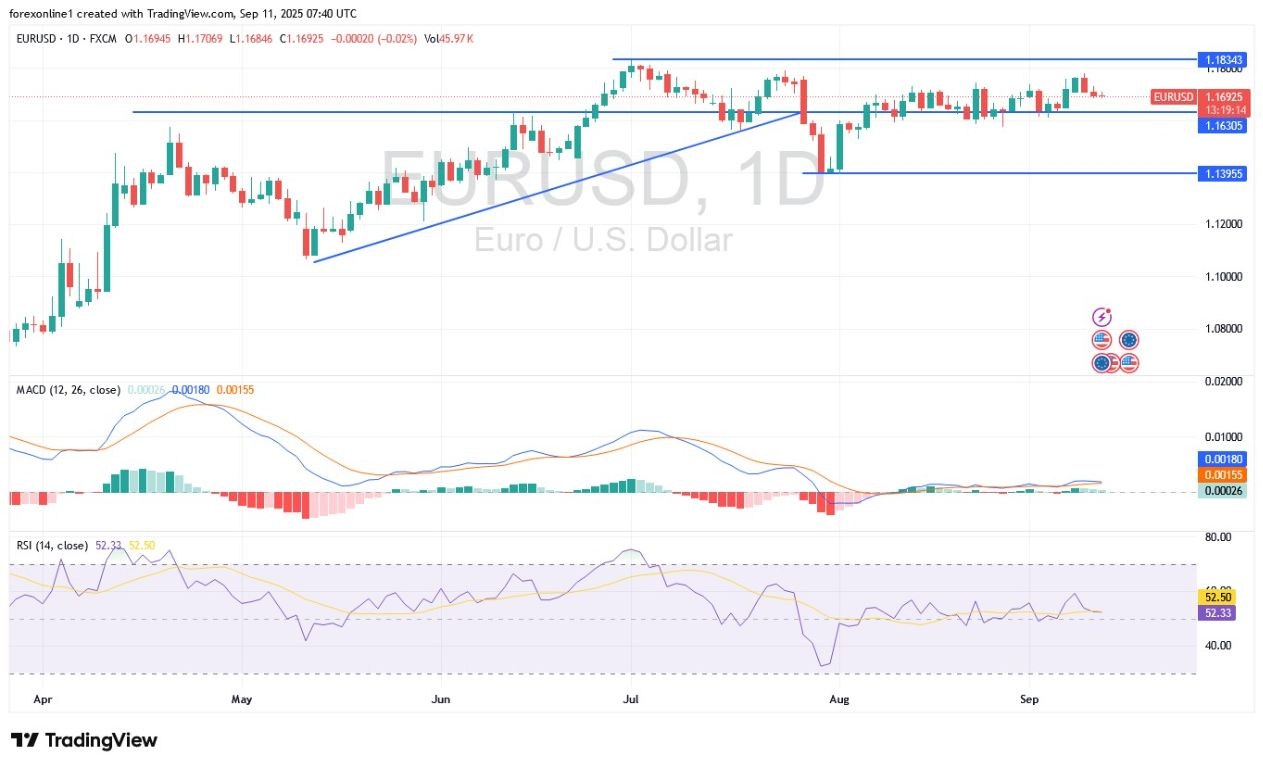
As anticipated, EUR/USD trading will remain cautious and within a narrow range until the market reacts to the release of U.S. inflation data, which is the most significant event for financial markets this week, especially after the setback from last week’s U.S. employment report. According to reliable trading platforms, attempts by EUR/USD to recover this week stalled at the 1.1779 resistance level. The pair then experienced profit-taking, which led to it settling around 1.1690 at the time of writing this analysis.

The European Central Bank (ECB) is widely expected to keep interest rates unchanged for its second consecutive meeting today, Thursday. The announcement will be at 3:15 PM, Egypt time. Policymakers are maintaining a cautious “wait-and-see” approach given the stability of inflation, the resilience of the economy, and uncertainty surrounding trade policy. The main refinancing rate is set to remain at 2.15%, while the deposit facility rate will stay at 2%. Investors will pay close attention to the ECB’s post-meeting macroeconomic projections, which will provide updated forecasts for growth and inflation. The ECB had previously cut borrowing costs by 200 basis points between June 2024 and June 2025, with the rate cuts halting in July.
Overall, financial markets currently expect interest rates to remain stable until the end of the year, with a potential return to tightening in late 2026. At the same time, Eurozone growth is projected to reach 1.2% this year, 1.1% in 2026, and 1.4% in 2027, although political instability in countries like France and Spain could cast a shadow over these forecasts.
The most important event for forex markets today is the release of U.S. inflation figures at 3:30 PM, Egypt time. The annual inflation rate in the U.S. is expected to accelerate to 2.9% in August 2025, which would be its highest level since January, following its stabilization at 2.7% in June and July. On a monthly basis, the Consumer Price Index (CPI) is expected to rise by 0.3%, surpassing the 0.2% increase in July. This rise likely reflects retailers gradually passing on higher import tariffs, along with an increase in gasoline and supermarket prices.
Conversely, rents are expected to decline. Core inflation, which excludes food and energy, is expected to remain steady at 3.1%, the same level as in July and its peak in February, with the core CPI rising 0.3% month-on-month, in line with July’s pace.
As observed on the daily chart, EUR/USD trading remains neutral. The bullish outlook will strengthen if the bulls succeed in breaking the 1.1800 resistance level, which is a key waypoint for a move toward the psychological resistance of 1.2000. The 14-day Relative Strength Index (RSI) is currently near a reading of 52, closer to the neutral line, while the MACD lines also confirm the neutral performance. Conversely, over the same period, the 1.1580 support level will remain crucial for the bears to take control of the EUR/USD trend.
Traders are advised to wait for the market’s reaction to the U.S. inflation and ECB announcements to determine the most suitable trading direction for EUR/USD, whether to buy or sell.
Ready to trade our Forex daily forecast? We’ve shortlisted the top forex brokers in the industry for you.
Platinum price attacked the barrier at $1400.00 yesterday, to find an exit to resume the bullish attempts, but this attempt ended by a clear failure to force it to decline temporarily towards $1381.00.
The contradiction between the main indicators might force the price to provide mixed trading until gathering extra positive momentum, to ease the mission of breaching the current barrier and begin recording extra gains by its rally to $1412.00 and $1435.00, while the attempts of changing the main trend requires achieving a real break to the support at $1340.00.
The expected trading range for today is between $1370.00 and $1412.00
Trend forecast: Fluctuated within the bullish track
Platinum price attacked the barrier at $1400.00 yesterday, to find an exit to resume the bullish attempts, but this attempt ended by a clear failure to force it to decline temporarily towards $1381.00.
The contradiction between the main indicators might force the price to provide mixed trading until gathering extra positive momentum, to ease the mission of breaching the current barrier and begin recording extra gains by its rally to $1412.00 and $1435.00, while the attempts of changing the main trend requires achieving a real break to the support at $1340.00.
The expected trading range for today is between $1370.00 and $1412.00
Trend forecast: Fluctuated within the bullish track
Gold price drifts higher to around $3,645 in Thursday’s early Asian session.
Rising Fed rate cut bets and geopolitical risks boost the Gold price.
The US CPI inflation report for August will be the highlight later on Thursday.
The Gold price (XAU/USD) gains momentum to near $3,645 during the early Asian session on Thursday. The precious metal edges higher on expectations of a US Federal Reserve (Fed) interest rate cut, a weaker US Dollar (USD) and global geopolitical risks. All eyes will be on the US Consumer Price Index (CPI) for August, which will be released later on Thursday.
US Producer Prices rose less than expected in August, reinforcing the view that the US central bank will deliver rate cuts at its upcoming policy meeting. This, in turn, weighs on the Greenback and underpins the USD-denominated commodity price. Lower interest rates could reduce the opportunity cost of holding Gold, supporting the non-yielding yellow metal.
Traders expect a stronger Fed easing. Money markets are now fully pricing in a 25 basis points (bps) rate cut at the Fed’s September meeting, while the chance of a larger 50 bps reduction has also risen to nearly 12%, according to the CME FedWatch tool.
Meanwhile, escalating geopolitical tensions in Europe and the Middle East also boost the safe-haven flows, benefitting the Gold price. Geopolitical risks in Europe rose after Poland shot down Russian drones that crossed into its territory in Russia’s latest attacks on Ukraine. Additionally, Israel on Tuesday launched a strike on Doha, Qatar, targeting the senior leadership of Hamas. Qatar said the attack by Israel violated international law and threatens to widen the conflict in the Middle East.
Gold traders will take more cues from the US August CPI inflation report later on Thursday. The headline CPI is expected to show an increase of 2.9% YoY in August, while the core CPI is projected to show a rise of 3.1% YoY during the same period. If the report shows a hotter-than-expected inflation, this could lift the USD and cap the upside for the precious metal price.
Platinum price attacked the barrier at $1400.00 yesterday, to find an exit to resume the bullish attempts, but this attempt ended by a clear failure to force it to decline temporarily towards $1381.00.
The contradiction between the main indicators might force the price to provide mixed trading until gathering extra positive momentum, to ease the mission of breaching the current barrier and begin recording extra gains by its rally to $1412.00 and $1435.00, while the attempts of changing the main trend requires achieving a real break to the support at $1340.00.
The expected trading range for today is between $1370.00 and $1412.00
Trend forecast: Fluctuated within the bullish track
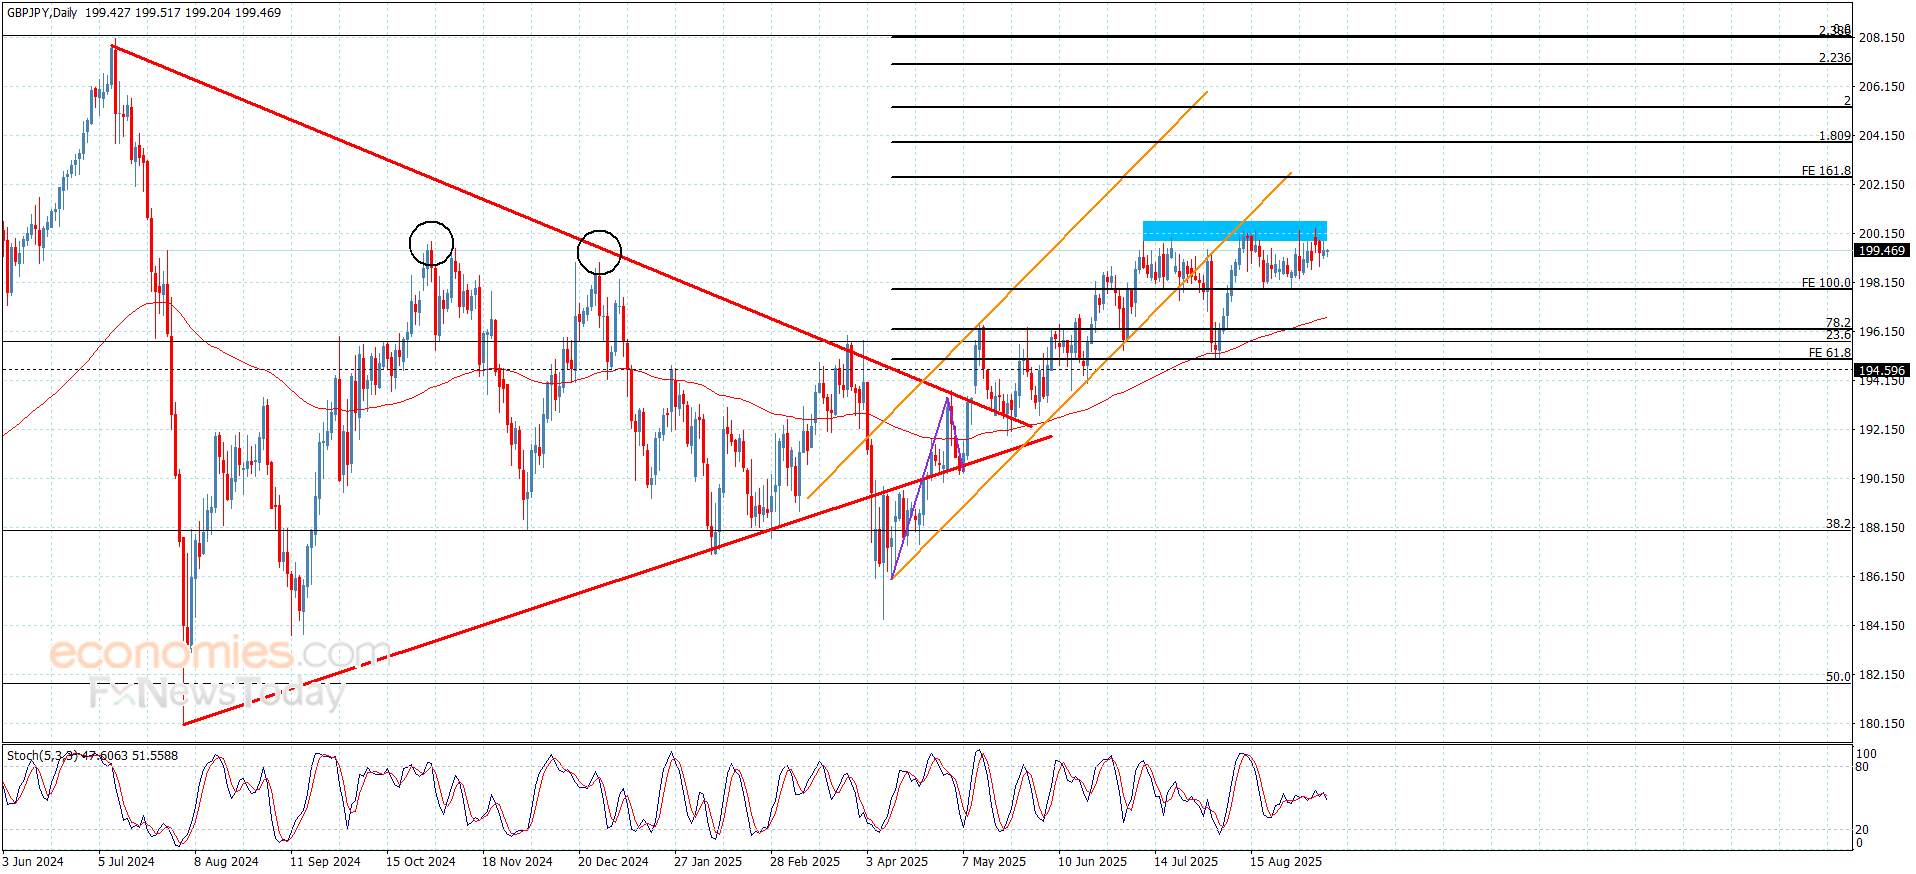
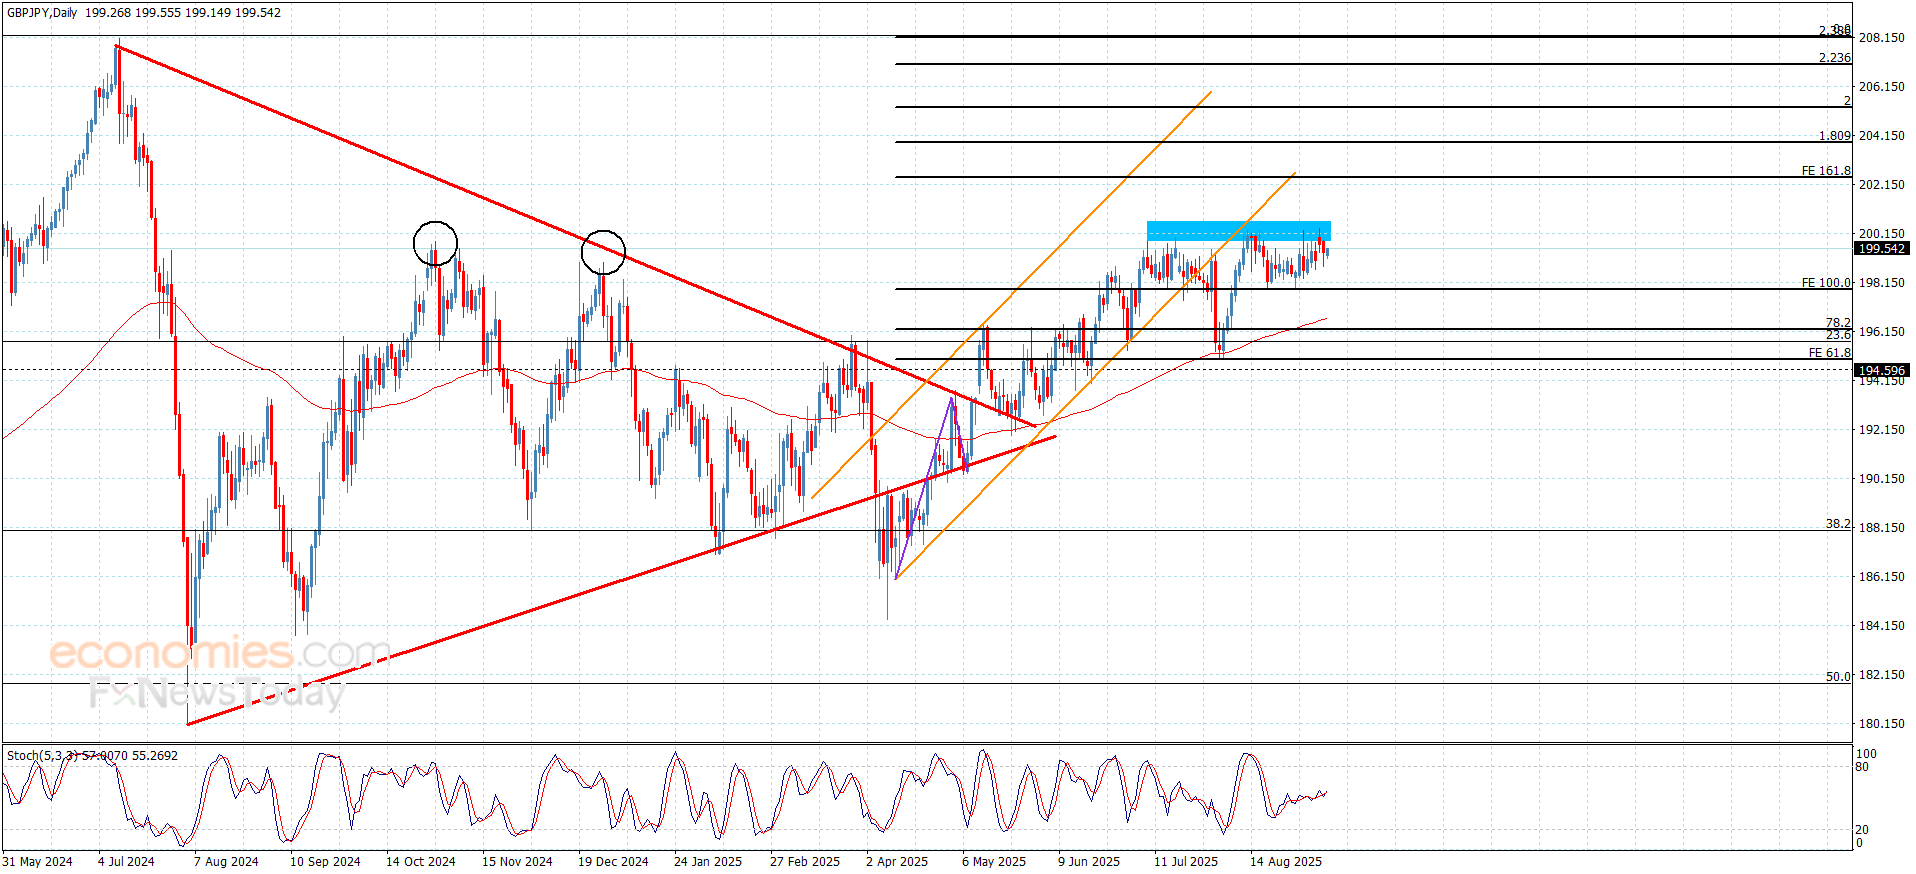
Despite the attempts of the main indicators to provide positive momentum but the stability of the GBPJPY pair below the barrier at 200.40 obstacle the chances for resuming the bullish attack, which forces it to provide sideways trading, activating the expected bearish correctional track.
While gathering the negative momentum will make the price begin targeting the negative stations by its decline to 198.60, then attempts to press on the initial support at 197.85, while the price success in breaching the barrier and holding above it will turn the bullish scenario to begin achieving clear gains by its rally to 200.90 and 201.55.
The expected trading range for today is between 198.65 and 200.30
Trend forecast: Bearish
Since the breakout to new record highs on September 2, gold has shown almost uninterrupted strength, with only one prior one-day pullback before momentum quickly resumed. A similar recovery is possible again, but price behavior now suggests the market may be ready for a deeper pullback or consolidation. The advance from the $3,311 swing low to Tuesday’s high represented an 11% gain, or $363, over just 14 trading sessions — a steep rise that increases the odds of further profit-taking before bullish continuation.
The first potential support area sits near this week’s low of $3,576, but if that level fails to hold, the 38.2% Fibonacci retracement at $3,537 is the next key zone. Below that, the prior record high of $3,500 comes into play, coinciding with the 50% retracement at $3,495. A stronger support zone rests lower, spanning the $3,451 and $3,439 swing highs that defined the prior symmetrical triangle pattern. This lower range aligns with the 61.8% retracement at $3,452 and is reinforced by dynamic support from the 20-Day moving average, now near $3,450 and rising.
While a pullback appears likely, the broader outlook for gold remains firmly bullish. The first test of the 20-Day average should attract buying interest and help maintain the uptrend. Only a decisive drop and sustained trade below the 20-Day line would weaken the bullish structure as it looks now.
With two trading sessions remaining this week, the closing price for the week may matter. A weekly close back under last week’s $3,600 high would show a failure to confirm the breakout, while a strong close above that level would reinforce the longer-term bull trend.
For a look at all of today’s economic events, check out our economic calendar.
The (ETHUSD) price continued its sideways trading in its last intraday levels, attempting to gain bullish momentum that might help it to rise, amid the continuation of the critical support level stability at $4,250, with the emergence of positive overlapping signals on the(RSI), after reaching oversold level, on the other hand, the price is under negative pressure that comes from its trading below EMA50, which prevents the price recovery in the previous session.
Get high-accuracy trading signals delivered directly to your Telegram. Subscribe to specialized packages tailored for the world’s top markets:
Full VIP signals performance report for September 1–5, 2025: