The main category of Forex News.
You can use the search box below to find what you need.
[wd_asp id=1]
The main category of Forex News.
You can use the search box below to find what you need.
[wd_asp id=1]
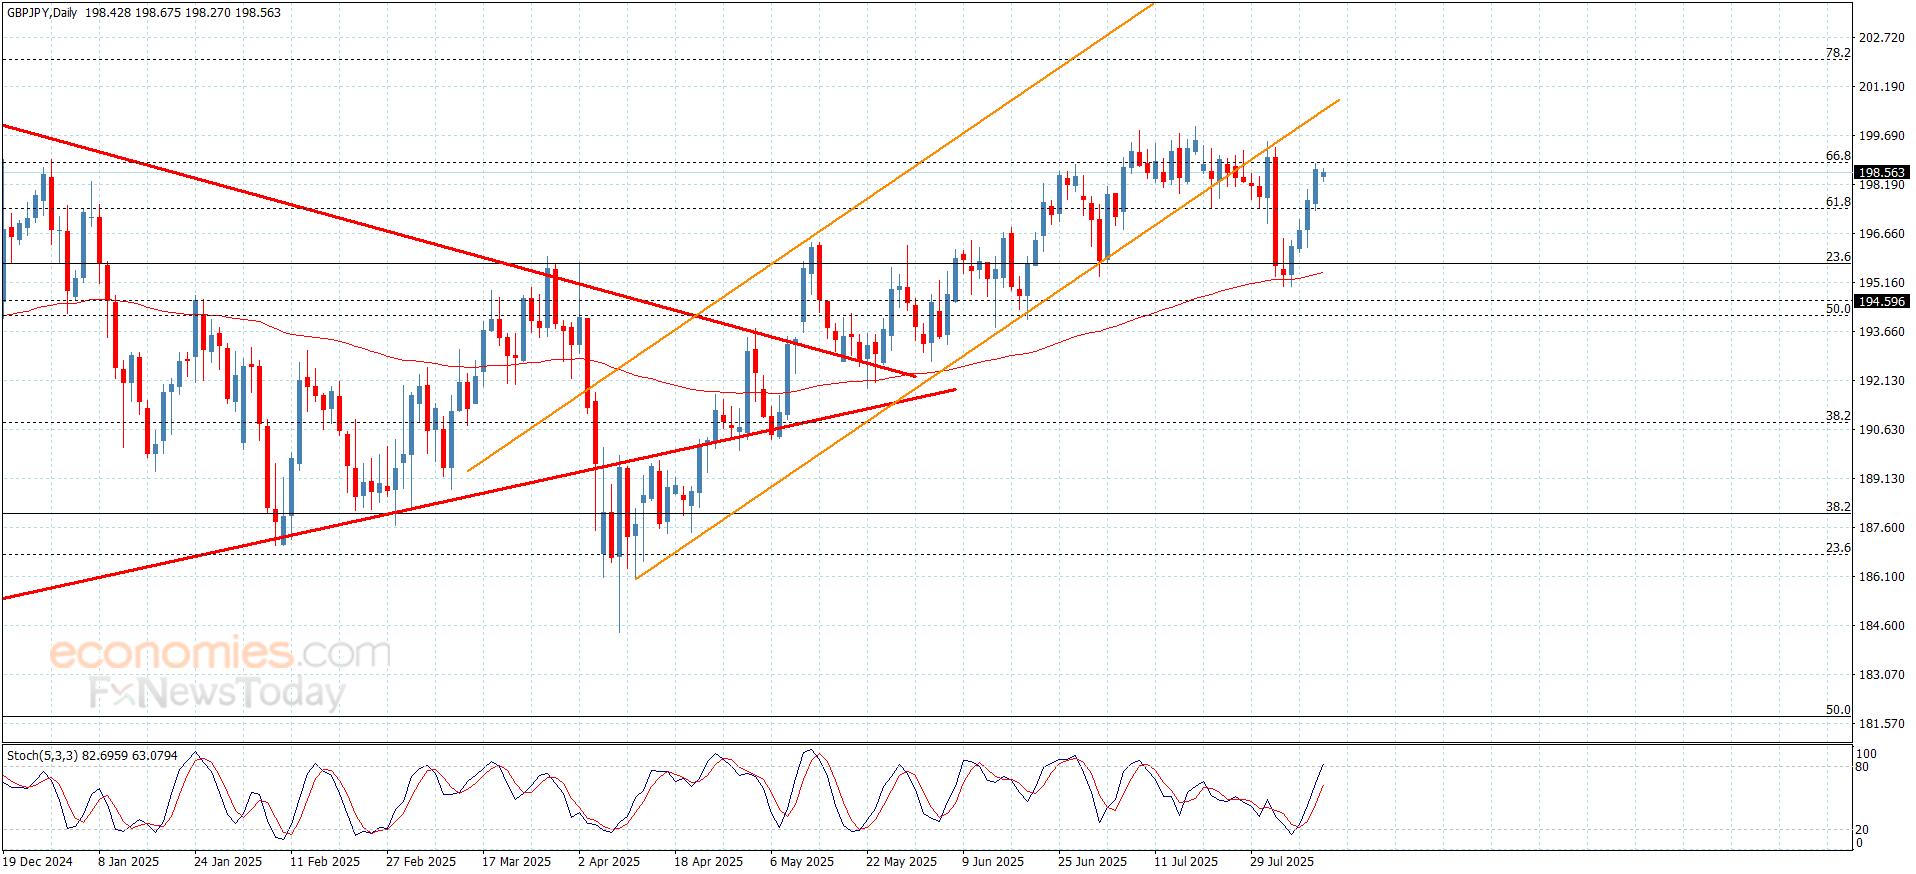
The GBPJPY pair took advantage of the positive factors that ae represented by the positive momentum from the main indicators and forming a new support at 197.45 level, forming a new bullish rally on Friday by achieving the target at 198.85, to face strong challenge by forming extra barriers by 66%Fibonacci correction level.
Stepping above the current barrier is required to resume the bullish attempts, besides providing positive close to reinforce the chances of reaching extra positive stations that might begin at 200.45, while the failure to breach will push it to renew the bearish correctional attempts, which forces it to reach 61.8%Fibonacci correction level at 197.45, and breaking it will extend the losses in the near period to 196.55 and 195.60.
The expected trading range for today is between 198.25 and 200.40
Trend forecast: Bullish
The (Brent) price settled low in its last intraday trading, attempting to break the critical support level at 66.00, amid the dominance of the main bearish trend and its trading alongside a minor bias line on the short-term basis, showing the strength of this trend and its dominance, especially with the continuation of the negative pressure that comes from its trading below EMA50, with the emergence of the negative signals on the (RSI), after reaching overbought levels.
Get high-accuracy trading signals delivered directly to your Telegram. Subscribe to specialized packages tailored for the world’s top markets:
To view the full performance report for this week, visit the following link:

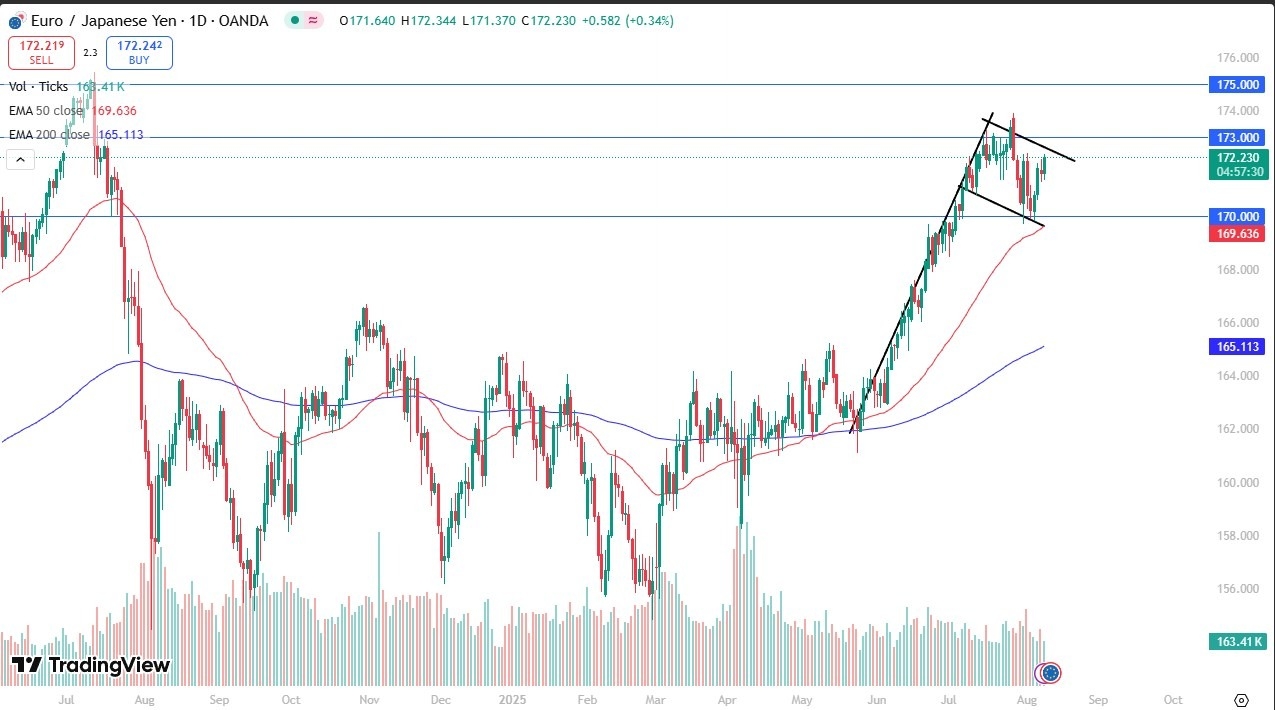
On the other hand, if we were to break down below the 50 day EMA, then I think you will probably see this market drop pretty significantly, perhaps down to the 166 yen level. Keep in mind that this is a risk appetite based currency pair, and the Japanese yen of course is represented by the Bank of Japan, which has a major issue on its hand.
In other words, it has to deal with the bond market in Japan, which is horribly unsubscribed to on some days. And in fact, there’s been days where there’s been zero bids for Japanese debt. So, with that being said, it’s not a surprise to see that the yen is struggling against a lot of currencies. And in fact, it’s even starting to struggle a little bit against the US dollar, which of course has been sold off by pretty much everybody.
So, if we can break above the 173 yen level, I can imagine a scenario where we rally another 1000 pips to about 183, maybe 182, we’ll just have to wait and see. But this is obviously a market that you get paid to hang on to as far as interest rates are concerned. So, I like buying dips, I also like buying breakouts.
Begin trading our daily forecasts and analysis. Here is a list of Forex brokers in Japan to work with.
Christopher Lewis has been trading Forex and has over 20 years experience in financial markets. Chris has been a regular contributor to Daily Forex since the early days of the site. He writes about Forex for several online publications, including FX Empire, Investing.com, and his own site, aptly named The Trader Guy. Chris favours technical analysis methods to identify his trades and likes to trade equity indices and commodities as well as Forex. He favours a longer-term trading style, and his trades often last for days or weeks.
The GBPJPY pair took advantage of the positive factors that ae represented by the positive momentum from the main indicators and forming a new support at 197.45 level, forming a new bullish rally on Friday by achieving the target at 198.85, to face strong challenge by forming extra barriers by 66%Fibonacci correction level.
Stepping above the current barrier is required to resume the bullish attempts, besides providing positive close to reinforce the chances of reaching extra positive stations that might begin at 200.45, while the failure to breach will push it to renew the bearish correctional attempts, which forces it to reach 61.8%Fibonacci correction level at 197.45, and breaking it will extend the losses in the near period to 196.55 and 195.60.
The expected trading range for today is between 198.25 and 200.40
Trend forecast: Bullish
GBP/USD moves sideways above 1.3450 after gaining more than 1% in the previous week. The pair’s technical outlook points to overbought conditions in the near term.
The table below shows the percentage change of British Pound (GBP) against listed major currencies last 7 days. British Pound was the strongest against the Swiss Franc.
| USD | EUR | GBP | JPY | CAD | AUD | NZD | CHF | |
|---|---|---|---|---|---|---|---|---|
| USD | -0.52% | -1.34% | 0.18% | -0.10% | -0.63% | -0.56% | 0.40% | |
| EUR | 0.52% | -0.77% | 0.72% | 0.43% | -0.24% | -0.05% | 0.92% | |
| GBP | 1.34% | 0.77% | 1.53% | 1.22% | 0.53% | 0.73% | 1.70% | |
| JPY | -0.18% | -0.72% | -1.53% | -0.28% | -0.96% | -0.76% | 0.38% | |
| CAD | 0.10% | -0.43% | -1.22% | 0.28% | -0.70% | -0.47% | 0.48% | |
| AUD | 0.63% | 0.24% | -0.53% | 0.96% | 0.70% | 0.20% | 1.18% | |
| NZD | 0.56% | 0.05% | -0.73% | 0.76% | 0.47% | -0.20% | 0.95% | |
| CHF | -0.40% | -0.92% | -1.70% | -0.38% | -0.48% | -1.18% | -0.95% |
The heat map shows percentage changes of major currencies against each other. The base currency is picked from the left column, while the quote currency is picked from the top row. For example, if you pick the British Pound from the left column and move along the horizontal line to the US Dollar, the percentage change displayed in the box will represent GBP (base)/USD (quote).
GBP/USD gathered bullish momentum in the second half of the previous week as Pound Sterling benefited from the Bank of England (BoE) hawkish rate cut. Speaking on the policy outlook, BoE Chief Economist Huw Pill said on Friday that there is a risk of a spill-over into more persistent inflation.
On the flip side, the US Dollar (USD) struggles to stay resilient against its peers as Federal Reserve (Fed) policymakers hint at a dovish policy stance in the last quarter of the year. Fed Governor Michelle Bowman said on Saturday that the latest weak labor market data underscores her concerns about labor market fragility and strengthens her confidence in her own forecast that three interest rate cuts will likely be appropriate this year.
Early Monday, the UK’s FTSE 100 Index gains about 0.3% and US stock index futures marginally higher on the day. In case markets remain risk-positive, especially if the US and China decides to extend the deadline for a trade deal, the USD could have a hard time gathering strength and help GBP/USD hold its ground.
On Tuesday, the UK’s Office for National Statistics will publish the employment data. A noticeable decline in the wage inflation figures could hurt Pound Sterling with the initial reaction. Later in the day, July Consumer Price Index (CPI) data from the US will be watched closely by market participants.
The Relative Strength Index (RSI) indicator on the 4-hour chart stays above 70, suggesting that there could be a technical correction before the next leg higher.
On the downside, the immediate support is located at 1.3460 (Fibonacci 50% retracement of the latest downtrend) before 1.3400-1.3390 (round level, static level, 100-period Simple Moving Average (SMA), Fibonacci 382% retracement).
Looking north, a strong resistance level seems to have formed at 1.3490-1.3500 (200-period SMA, static level, round level). In case GBP/USD rises above this area and starts using it as support, 13540 (Fibonacci 61.8% retracement) could be seen as the next resistance level ahead of 1.3600 (static level, round level).
The Pound Sterling (GBP) is the oldest currency in the world (886 AD) and the official currency of the United Kingdom. It is the fourth most traded unit for foreign exchange (FX) in the world, accounting for 12% of all transactions, averaging $630 billion a day, according to 2022 data.
Its key trading pairs are GBP/USD, also known as ‘Cable’, which accounts for 11% of FX, GBP/JPY, or the ‘Dragon’ as it is known by traders (3%), and EUR/GBP (2%). The Pound Sterling is issued by the Bank of England (BoE).
The single most important factor influencing the value of the Pound Sterling is monetary policy decided by the Bank of England. The BoE bases its decisions on whether it has achieved its primary goal of “price stability” – a steady inflation rate of around 2%. Its primary tool for achieving this is the adjustment of interest rates.
When inflation is too high, the BoE will try to rein it in by raising interest rates, making it more expensive for people and businesses to access credit. This is generally positive for GBP, as higher interest rates make the UK a more attractive place for global investors to park their money.
When inflation falls too low it is a sign economic growth is slowing. In this scenario, the BoE will consider lowering interest rates to cheapen credit so businesses will borrow more to invest in growth-generating projects.
Data releases gauge the health of the economy and can impact the value of the Pound Sterling. Indicators such as GDP, Manufacturing and Services PMIs, and employment can all influence the direction of the GBP.
A strong economy is good for Sterling. Not only does it attract more foreign investment but it may encourage the BoE to put up interest rates, which will directly strengthen GBP. Otherwise, if economic data is weak, the Pound Sterling is likely to fall.
Another significant data release for the Pound Sterling is the Trade Balance. This indicator measures the difference between what a country earns from its exports and what it spends on imports over a given period.
If a country produces highly sought-after exports, its currency will benefit purely from the extra demand created from foreign buyers seeking to purchase these goods. Therefore, a positive net Trade Balance strengthens a currency and vice versa for a negative balance.
expectations have been the primary driver of this month, making Tuesday’s report a potential catalyst for a break from the recent range.
Fed rate cut expectations have been steering USD/JPY more than moves in longer-dated yields or shifts in risk appetite this month, putting this week’s U.S. inflation reports firmly in the spotlight. With higher import tariffs starting to filter through and the risk of stronger inflation rising, the near-term bias tilts towards modest USD/JPY upside if its link to rate cut pricing holds. The charts tell a similar story.
Source: TradingView
The relationship between 2025 Fed rate cut pricing and USD/JPY has been incredibly strong over the past fortnight, with a correlation coefficient of -0.97. As market rate cut expectations have swelled, as implied by futures, USD/JPY has tended to fall—and vice versa when the opposite occurred.
Over the same period, the relationship between USD/JPY and U.S. Treasury yields, along with yield spreads between the U.S. and Japan over both short and longer durations, has been nowhere near as strong. Nor has the relationship with the or been meaningful, suggesting that, for now, risk appetite is also playing second fiddle to shifts in sentiment towards the near-term outlook for U.S. rates.
Assuming there’s no significant change in these trends or an unexpected volatility event, it puts greater emphasis on this week’s U.S. inflation reports to drive USD/JPY direction.
The key economic and market events from both the United States and Japan are shown in the calendar below. U.S. ET shown.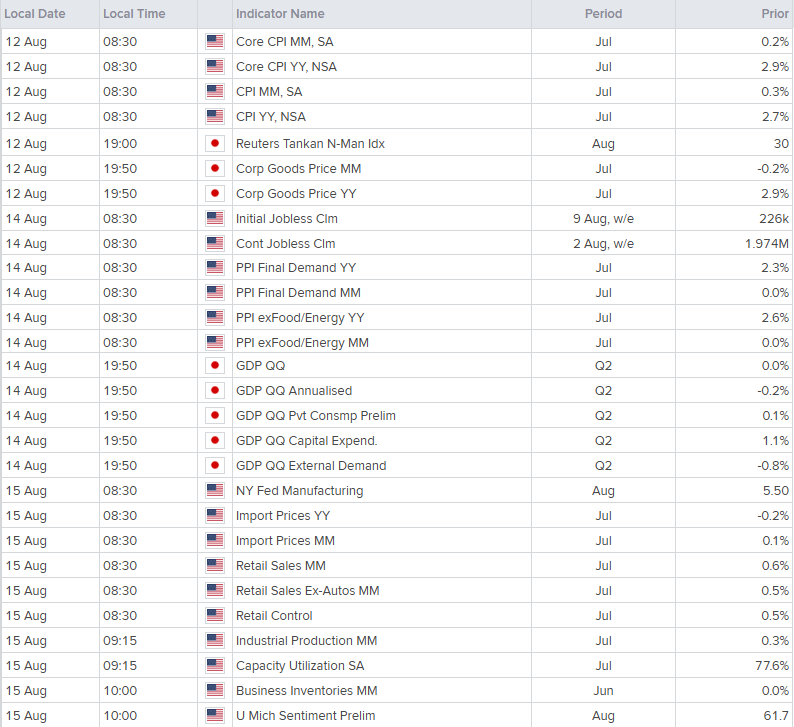
Source: LSEG
Given its historic tendency to spark significant market volatility, Tuesday’s U.S. consumer price inflation report for July is undeniably the key known risk event on the data calendar. is seen lifting 0.2% over the month, down from 0.3% in June. Without revisions to prior data, that should see the lift a tenth to 2.8%.
For the key , which excludes food and energy prices, a 0.3% increase is seen for the month. If correct, that would leave the at an uncomfortable 3%, up from 2.9% in June.
While focus on goods prices will garner much attention given the impact of higher tariff rates, don’t discount the message from services readings, which are often far more influenced by broader macroeconomic conditions, especially the labour market. If core services inflation, which excludes items such as shelter and energy services, comes in weak, that would help ease concerns that near-term inflationary effects from tariffs may become entrenched. The opposite would be true if services inflation is strong, of course.
Beyond the CPI update, Thursday’s report is also important as it will likely show what’s happening with upstream price pressures from tariffs, but also has several components that feed directly into the Federal Reserve’s preferred underlying inflation measure, the .
U.S. import prices and on Friday, along with Japanese and data on Wednesday and Friday respectively, are the other key events to watch on the data calendar.
The Federal Reserve speakers’ calendar looks relatively light at first glance, although traders should be on the lookout for unscheduled commentary throughout the week, especially after the CPI report on Tuesday. When it comes to those members who vote on interest rates this year, Schmid and Goolsbee are the ones to pay extra attention to.
Source: LSEG
Friday’s scheduled meeting between U.S. President Donald Trump and Russian President Vladimir Putin in Alaska is another key risk event that could spark volatility for USD/JPY late in the week. Given it remains unclear whether the meeting will include Ukrainian President Volodymyr Zelenskyy, expectations are understandably muted about a lasting outcome that will bring peace.
That also arguably points to asymmetric risks for risk appetite, and potentially USD/JPY given its role as a funding currency for carry trades, should a peace deal acceptable to both Russia and Ukraine be reached.
Source: TradingView
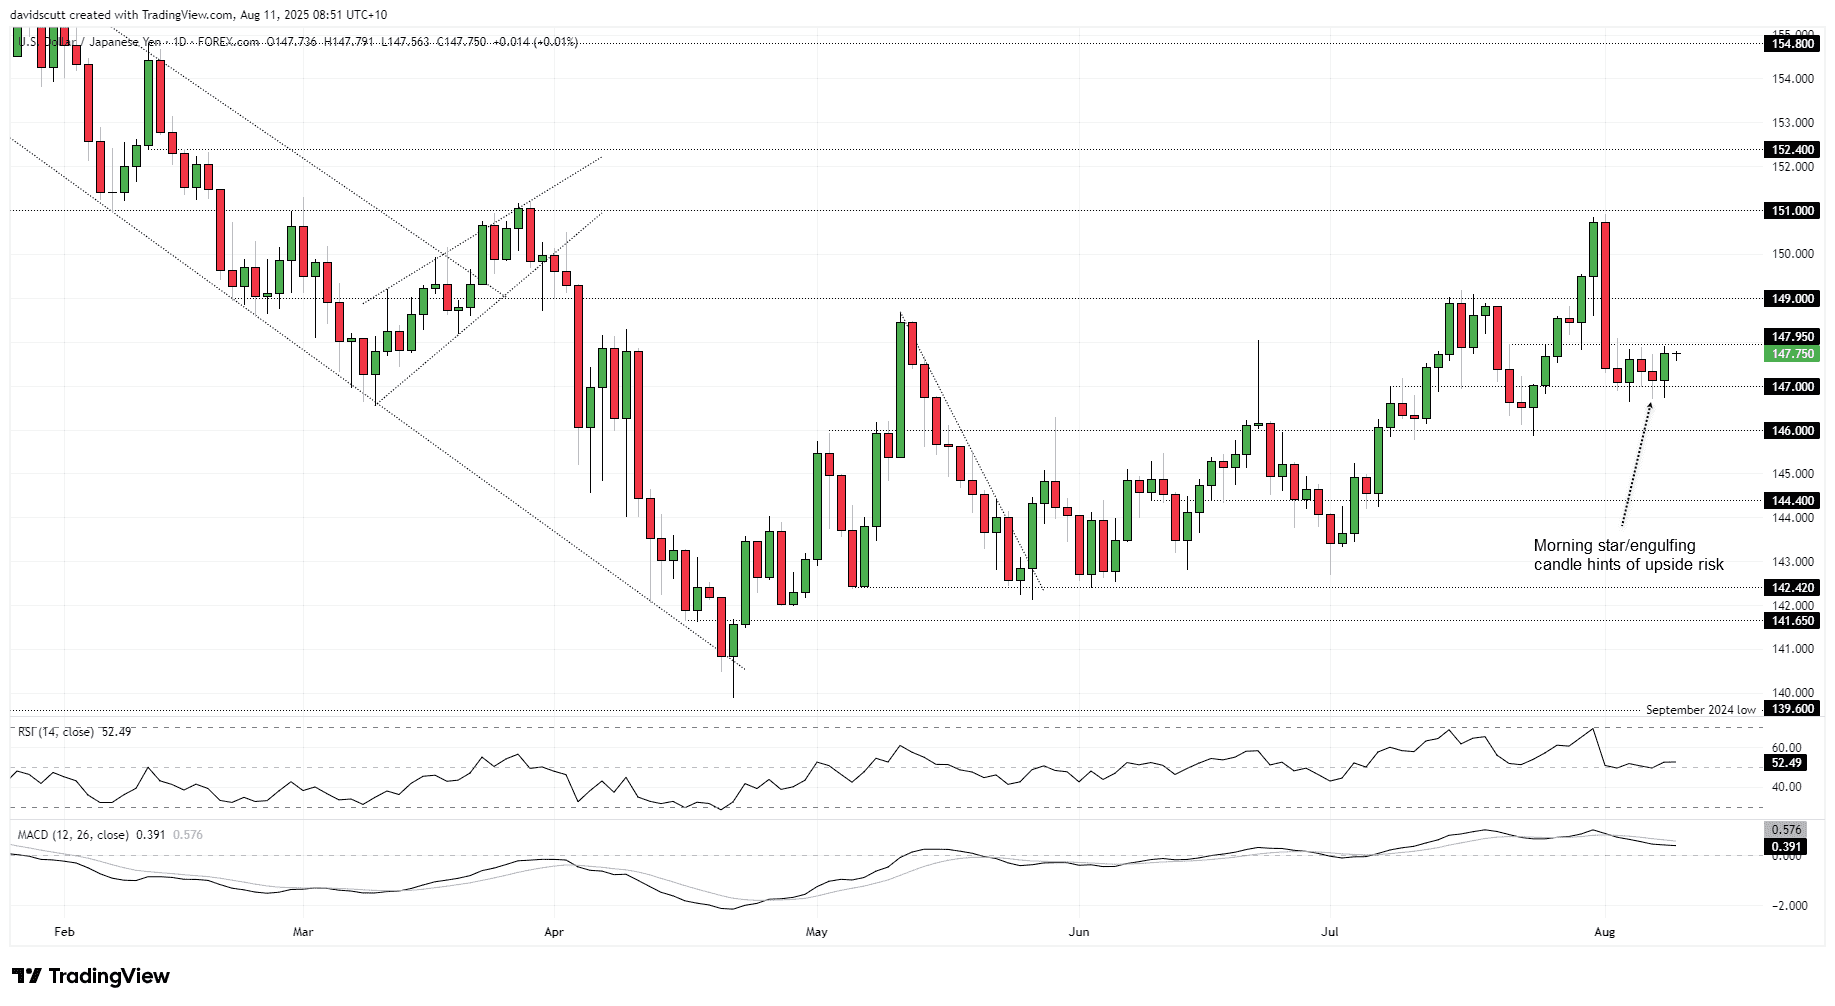
USD/JPY was rangebound last week as market expectations for Fed rate cuts stabilised, with buyers emerging on dips beneath 147.00 and sellers capping moves ahead of resistance at 147.95. They’re the two initial levels for traders to watch.
Friday’s modest bounce helped complete a three-candle morning star pattern on the daily chart, hinting that directional risks may be starting to skew higher. However, having formed within a narrow range, the signal loses some of its significance. The same applies to momentum indicators such as RSI (14) and MACD, which are providing neutral readings despite sitting in marginally bullish territory.
Above 147.95 resistance, 149.00 and 151 are the levels to watch. A close beneath 147.00 support—not just an intraday probe—may see bears target a retest of 146.00 or even 144.40.
The Gold price (XAU/USD) attracts some sellers to near $3,390 during the early Asian session on Monday. The precious metal drifts lower amid a modest recovery in the US Dollar (USD). Traders brace for the release of the US inflation report, which is due later on Tuesday.
A firmer Greenback and a broader risk-on sentiment undermine the USD-denominated commodity price, capping the price below the key psychological barrier at $3,400. Nonetheless, rising bets for a September rate cut by the US Federal Reserve (Fed) could provide some support to the non-yielding yellow metal.
Fed Governor Michelle Bowman said on Saturday that recent weak job data underscores her concerns about labor market fragility and strengthens her confidence in her projection that three interest-rate cuts will likely be appropriate in 2025. Traders are now pricing in nearly an 89% chance of a Fed rate reduction in September, with at least two rate cuts priced in by the end of the year.
Additionally, the People’s Bank of China (PBOC) added gold to its reserves in July, its ninth consecutive month of purchases, official data showed on Thursday. This headline might contribute to the precious metal’s upside. “Continued purchases by one of the world’s largest central banks signal strong underlying demand for gold,” said Zain Vawda, analyst at MarketPulse by OANDA.
Gold has played a key role in human’s history as it has been widely used as a store of value and medium of exchange. Currently, apart from its shine and usage for jewelry, the precious metal is widely seen as a safe-haven asset, meaning that it is considered a good investment during turbulent times. Gold is also widely seen as a hedge against inflation and against depreciating currencies as it doesn’t rely on any specific issuer or government.
Central banks are the biggest Gold holders. In their aim to support their currencies in turbulent times, central banks tend to diversify their reserves and buy Gold to improve the perceived strength of the economy and the currency. High Gold reserves can be a source of trust for a country’s solvency. Central banks added 1,136 tonnes of Gold worth around $70 billion to their reserves in 2022, according to data from the World Gold Council. This is the highest yearly purchase since records began. Central banks from emerging economies such as China, India and Turkey are quickly increasing their Gold reserves.
Gold has an inverse correlation with the US Dollar and US Treasuries, which are both major reserve and safe-haven assets. When the Dollar depreciates, Gold tends to rise, enabling investors and central banks to diversify their assets in turbulent times. Gold is also inversely correlated with risk assets. A rally in the stock market tends to weaken Gold price, while sell-offs in riskier markets tend to favor the precious metal.
The price can move due to a wide range of factors. Geopolitical instability or fears of a deep recession can quickly make Gold price escalate due to its safe-haven status. As a yield-less asset, Gold tends to rise with lower interest rates, while higher cost of money usually weighs down on the yellow metal. Still, most moves depend on how the US Dollar (USD) behaves as the asset is priced in dollars (XAU/USD). A strong Dollar tends to keep the price of Gold controlled, whereas a weaker Dollar is likely to push Gold prices up.
Gold markets have been bullish again during the course of the week as we broke above the $3500 level. The $3500 level has been like a ceiling in this market for some time and breaking above there obviously will attract a lot of headlines. However, it is probably worth noting that the Friday session is rolling back over so I don’t know that we have the momentum to truly clear this area quite yet. Regardless, this remains a “buy on the dips” type of market. I have no interest in shorting this market although I fully anticipate that it could pull back just a bit.
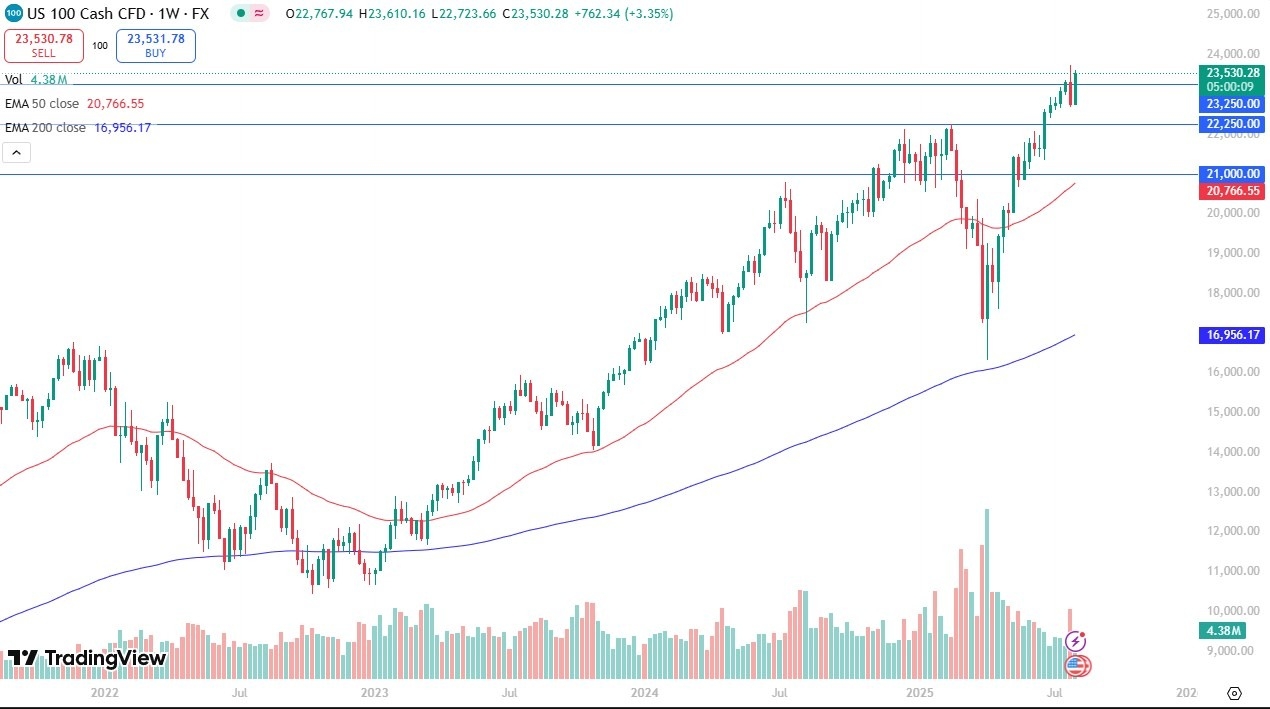
The NASDAQ 100 rallied during the course of the week, breaking above the 23,250 level again. We have essentially wiped out 80% or so of the losses from the previous week, so it does look like we might be either getting ready to consolidate in an area right around here, or perhaps we are trying to turn around and break above the top of the candlestick from the previous week. I think it does make a certain amount of sense that we see consolidation in the short term, mainly due to the fact that it is August, and the volume suddenly disappears as traders are more worried about vacation. Regardless, the one thing I won’t do is try to short this market.
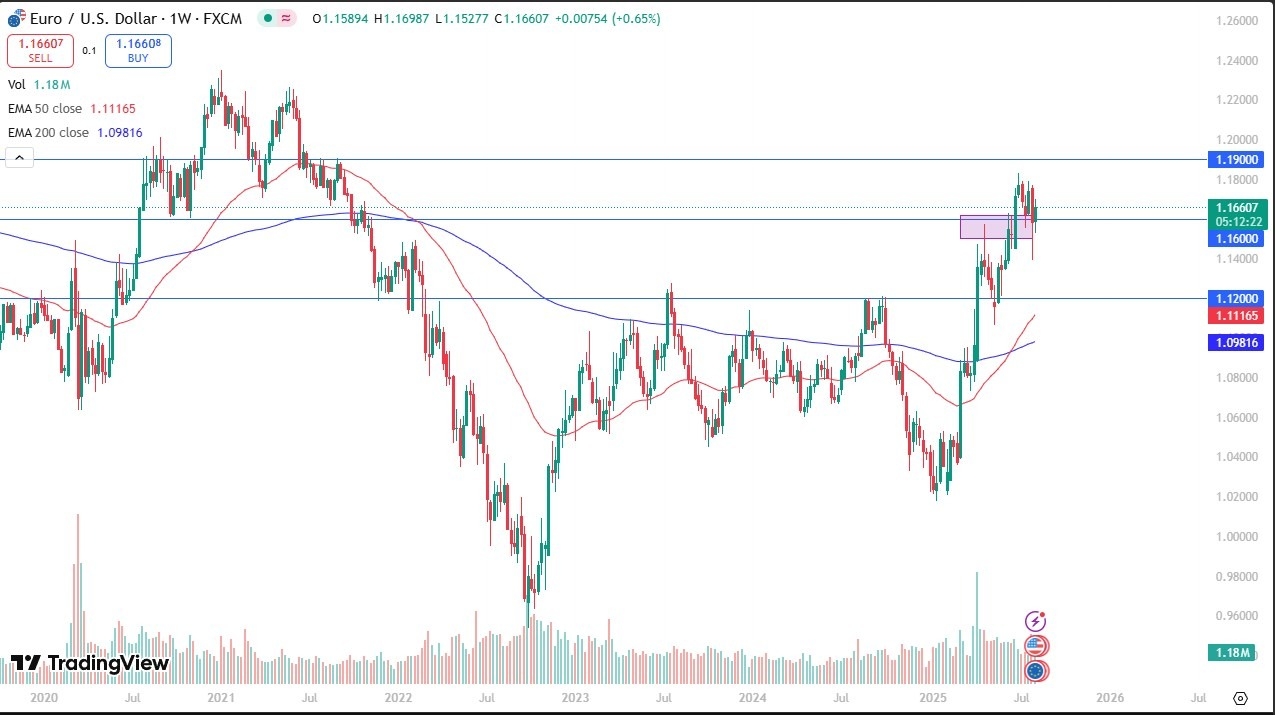
The Euro rallied during the week, but it is worth noting that we are getting a little bit softer over the last couple of weeks, as we continue to just hang out in the 1.16 level. We are still in the midst of consolidation, so I’m not ready to make some big proclamation here, but I would say that if we broke down below the bottom of the candlestick from the previous week, meaning the 1.14 level, that would be very ugly for the euro. On the other hand, if we can break above the 1.18 level, then perhaps we can go much higher.
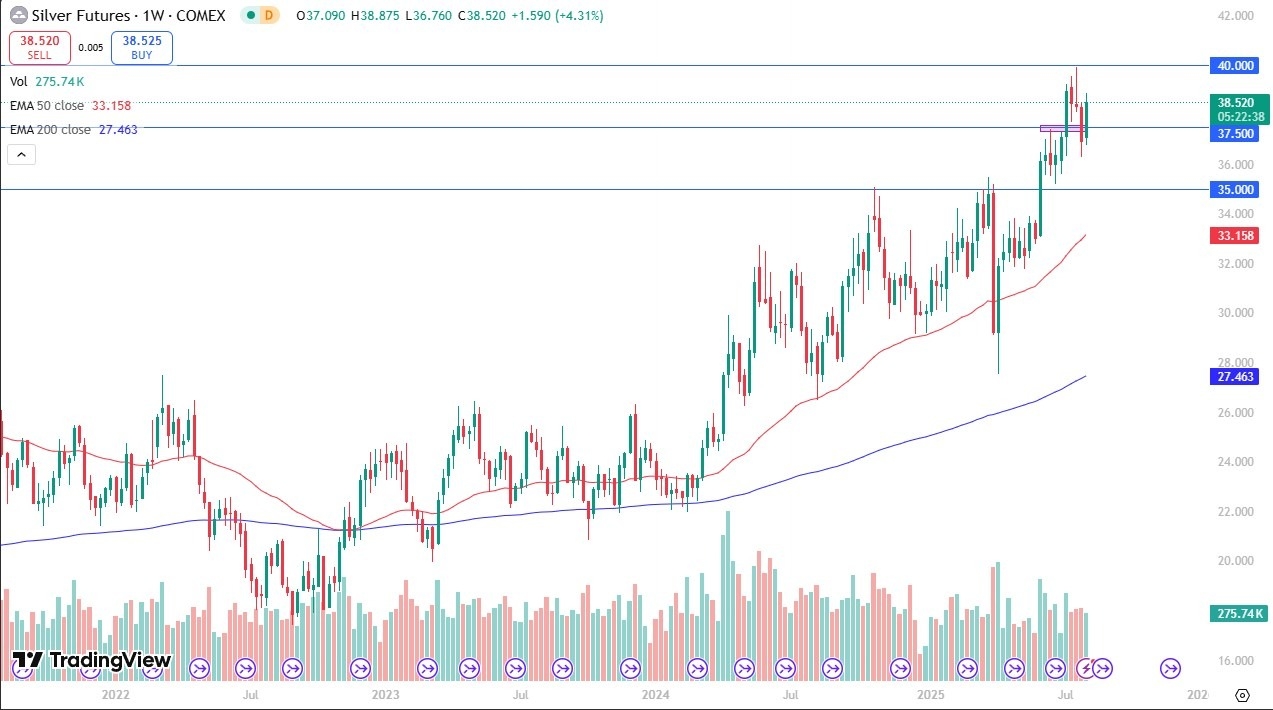
Silver has been very bullish during the course of the week as we have cleared the $37.50 level again. The $37.50 has been important multiple times on the daily chart and has offered both support and resistance. Because of this, I’m watching that very closely as the market will continue to be very noisy, but I think given enough time we will probably revisit the $40 level. If we can break above the $40 level, then it’s likely that silver will continue to go much higher were to turn around and break down below the $36.50 level, then silver may have some correction ahead.
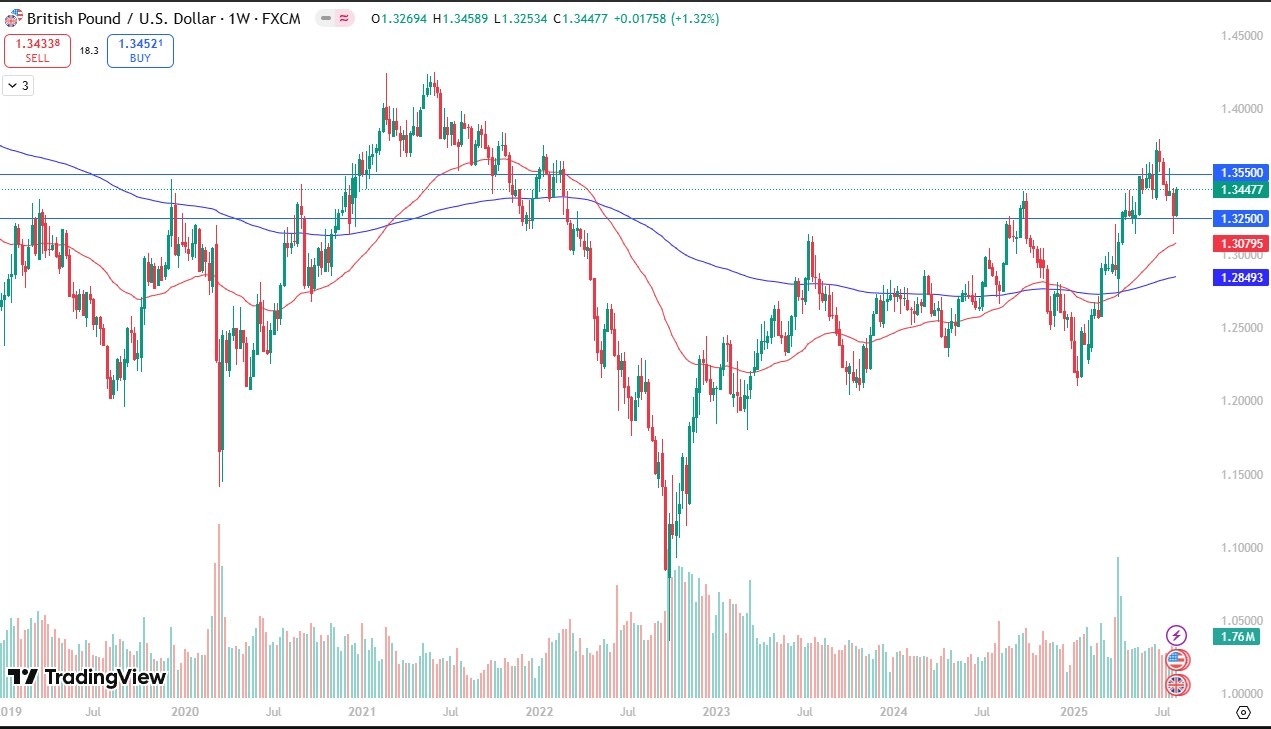 The British pound has rallied pretty significantly during the trading week as the 1.3250 level has offered a bit of a floor. Ultimately, the market looks as if it will try to get to the 1.3550 level, an area that’s been resistant. On the other hand, if we were to break down below the 1.3250 level, then it’s likely that the British pound could drop down to the 50 Week EMA. After that, we could be looking at a move down to the 1.2850 level where the 200 Week EMA currently resides.
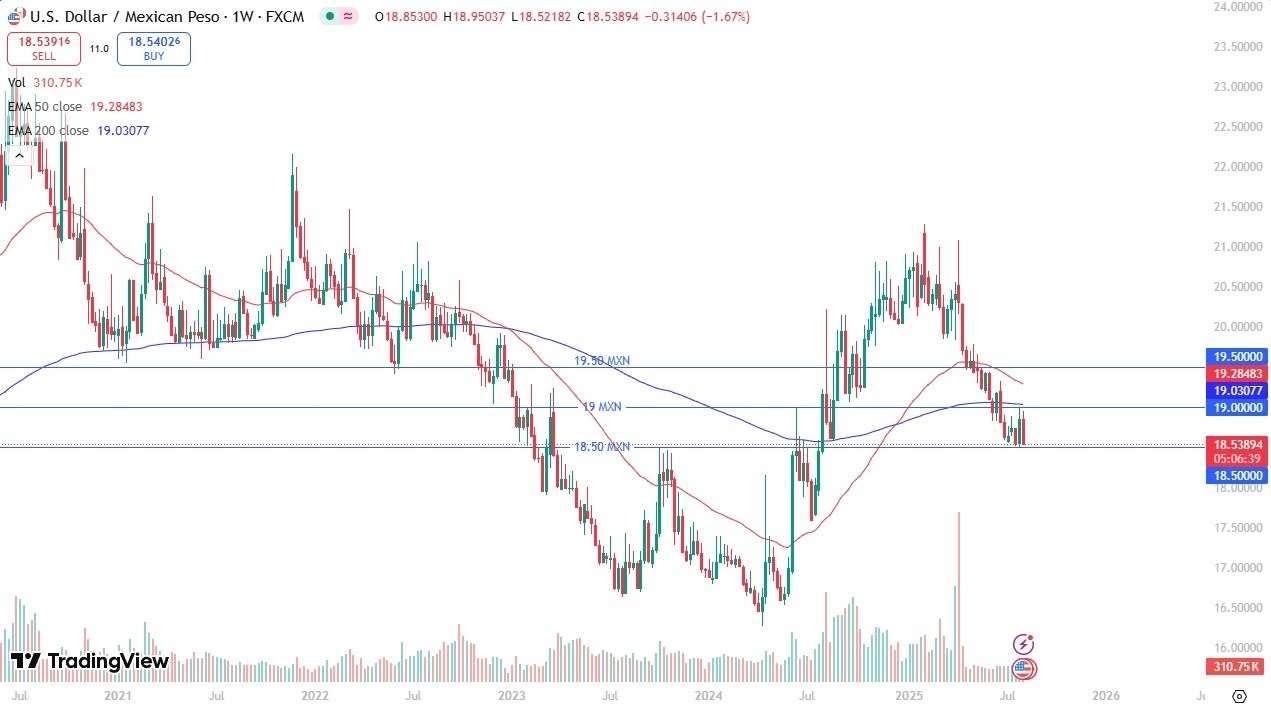
The US dollar initially tried to rally against the Mexican peso during the week, but the 19 MXN level has offered a bit of a ceiling. As we close the week, it looks like we are sitting just above the 18.50 MXN level, which opens up the move down to the 17.50 MXN level. Ultimately, this is a pair that could go as low as 16.50 MXN, but it will take some time to get down there. Keep in mind that the interest rate differential continues to favor the Mexican peso, and I think in the environment where the Mexicans were given 90 more days as an extension to tariffs, it will start to feel a bit better about the Mexican economy overall.
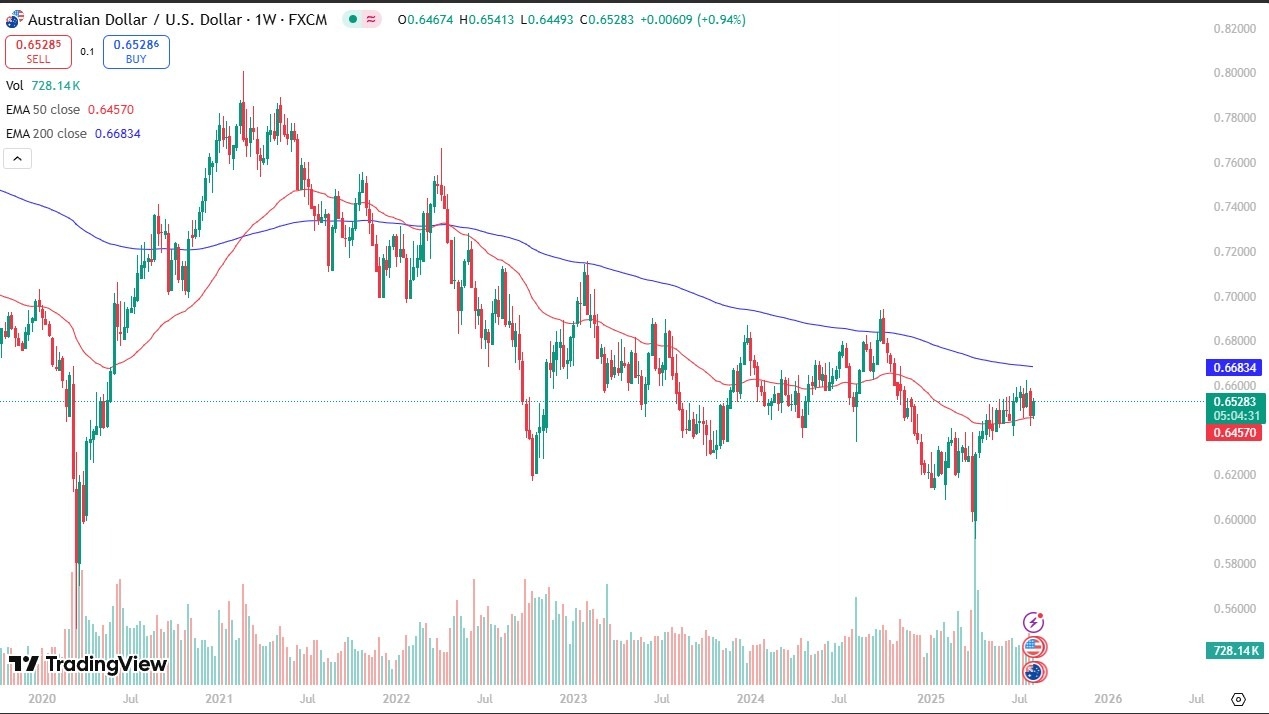
The Australian dollar has been bullish during the course of the week, but still finds itself hanging around the 0.6550 level, a place that’s been like a magnet for price all summer. If we turn around a break down below the bottom of the candlestick from the previous week, then it’s possible that the Australian dollar could drop down to the 0.62 level. On the other hand, if we can somehow break above the 0.66 level, then the Australian dollar may have a real shot at going higher. Ultimately, this is a market that has been very choppy and somewhat sideways.
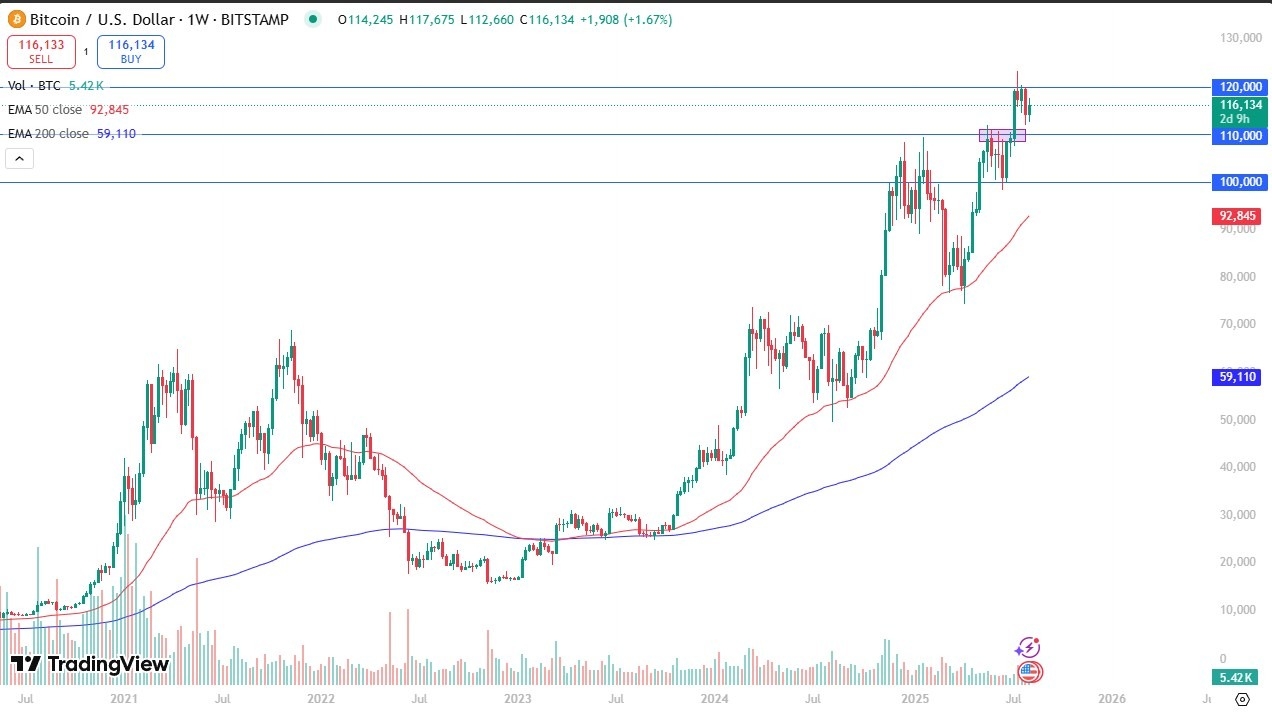
Bitcoin has gone back and forth during the course of the week, after initially pulling back. That being said, we still see the $120,000 level above is a significant barrier, and if we can break above that level, then it’s likely that Bitcoin will continue to go much higher, perhaps reaching the $130,000 level next, as this market does like to move in $10,000 increments. At this point, it looks like the $110,000 level is a bit of a floor.
Ready to trade our Forex weekly forecast? We’ve shortlisted the best forex trading accounts to choose from.
The GBP/USD weekly forecast shows a drop in BoE rate cut expectations after a divided vote at the last meeting.
The GBP/USD pair ended the week bullish as the pound rallied after an unexpected Bank of England policy meeting. At the same time, the dollar eased amid an increase in Fed rate cut expectations, allowing sterling to climb.
–Are you interested to learn more about ECN brokers? Check our detailed guide-
The BoE cut interest rates as expected last week. However, policymakers had to vote twice before deciding. Nearly half the officials were ready to keep interest rates unchanged due to the high inflation in the UK. As a result, future rate cut expectations fell and the pound rallied.
Meanwhile, in the US, data on business activity and unemployment claims further supported rate cut bets, weighing on the dollar.
Next week, the UK will release employment figures, manufacturing production, and GDP data. Meanwhile, the US will release inflation and retail sales figures. The UK economy has fared poorly according to recent economic data, especially in the labor market. Another set of downbeat employment figures could increase expectations for more BoE rate cuts, hurting the pound.
Meanwhile, in the US, rate cut bets have risen sharply due to a slowdown in the labor market. However, bets might drop with another upbeat employment report.

On the technical side, the GBP/USD price has broken above the 22-SMA, indicating a bullish shift in sentiment. At the same time, the RSI has broken above 50, suggesting stronger bullish momentum. Initially, the price had started showing signs of a downtrend. It broke below the SMA, retested it, and made a lower low.
–Are you interested to learn more about day trading brokers? Check our detailed guide-
However, at the 1.3151 support, bulls emerged with renewed strength and pushed the price above the SMA. However, bulls must now break above the 1.3451 key level. Such a move would clear the path for the price to retest the 1.3803 resistance level. Meanwhile, a break above this level would resume the previous uptrend.
However, there is also a chance that the price might fail to break above the 1.3451 resistance. In such a case, the price would drop to retest the 1.3151 support level. A break below would resume the downtrend.
Looking to trade forex now? Invest at eToro!
68% of retail investor accounts lose money when trading CFDs with this provider. You should consider whether you can afford to take the high risk of losing your money.
Silver Price advances for the fourth time in the week, poised to end above $38.00 a troy ounce and close to weekly highs of $38.50 as traders prepare for the weekend. Broad US Dollar weakness across the board and increasing bets that the Federal Reserve might reduce rates at the September meeting, supported the grey metal advance.
XAG/USD trades with daily gains of 0.24%, set to end the week up by more than 3.50%.
XAG/USD sits $1.50 shy of resting the yearly high after retreating below the 20-day Simple Moving Average (SMA) to test the 50-day SMA at 36.20 on July 31.
Since then, Silver has rallied more than 6%, sparked by the formation of a ‘bullish harami,’ confirmed by the crucial breach of the July 31 high of $37.26. The grey metal climbed sharply and cleared the 20-day SMA at $38.06, further cementing its upward bias.
However, buyers need to breach the $39.00 so they can test the YTD high of $39.52, before challenging $40.00. On the flip side, although momentum is bullish, confirmed by price action and the Relative Strength Index (RSI), traders could not price out a reversal.
If Silver dives below the 20-day SMA and $38.00, then sellers could pile on to push prices toward $37.00, aimed to test the 50-day SMA at $36.85.
Silver is a precious metal highly traded among investors. It has been historically used as a store of value and a medium of exchange. Although less popular than Gold, traders may turn to Silver to diversify their investment portfolio, for its intrinsic value or as a potential hedge during high-inflation periods. Investors can buy physical Silver, in coins or in bars, or trade it through vehicles such as Exchange Traded Funds, which track its price on international markets.
Silver prices can move due to a wide range of factors. Geopolitical instability or fears of a deep recession can make Silver price escalate due to its safe-haven status, although to a lesser extent than Gold’s. As a yieldless asset, Silver tends to rise with lower interest rates. Its moves also depend on how the US Dollar (USD) behaves as the asset is priced in dollars (XAG/USD). A strong Dollar tends to keep the price of Silver at bay, whereas a weaker Dollar is likely to propel prices up. Other factors such as investment demand, mining supply – Silver is much more abundant than Gold – and recycling rates can also affect prices.
Silver is widely used in industry, particularly in sectors such as electronics or solar energy, as it has one of the highest electric conductivity of all metals – more than Copper and Gold. A surge in demand can increase prices, while a decline tends to lower them. Dynamics in the US, Chinese and Indian economies can also contribute to price swings: for the US and particularly China, their big industrial sectors use Silver in various processes; in India, consumers’ demand for the precious metal for jewellery also plays a key role in setting prices.
Silver prices tend to follow Gold’s moves. When Gold prices rise, Silver typically follows suit, as their status as safe-haven assets is similar. The Gold/Silver ratio, which shows the number of ounces of Silver needed to equal the value of one ounce of Gold, may help to determine the relative valuation between both metals. Some investors may consider a high ratio as an indicator that Silver is undervalued, or Gold is overvalued. On the contrary, a low ratio might suggest that Gold is undervalued relative to Silver.