The main category of Forex News.
You can use the search box below to find what you need.
[wd_asp id=1]
The main category of Forex News.
You can use the search box below to find what you need.
[wd_asp id=1]
The GBP/USD weekly forecast suggests further downside as market participants prepare for a Bank of England rate cut.
The GBP/USD price had a bearish week as the dollar strengthened on upbeat data and higher tariffs. However, there was a pullback after the nonfarm payrolls report.
–Are you interested in learning more about Bitcoin price prediction? Check our detailed guide-
At the start of the week, data revealed solid private employment. At the same time, the economy grew by 3.0%, compared to the forecast of 2.5%. The data boosted the dollar. Moreover, Trump imposed higher tariffs on several countries, which sent Treasury yields and the dollar higher.
However, the dollar retreated on Friday after data revealed slower-than-expected job growth in July.
Next week’s calendar for GBP/USD is quite light. Market participants will focus on the Bank of England policy meeting, where the central bank might cut interest rates by 25-bps. The pound had a bad month in July as traders worried about the state of the UK economy.
Despite being among the first countries to sign a trade deal with the US, the UK’s currency has suffered amid poor economic data. The weak reports have led to an increase in expectations for Bank of England rate cuts.
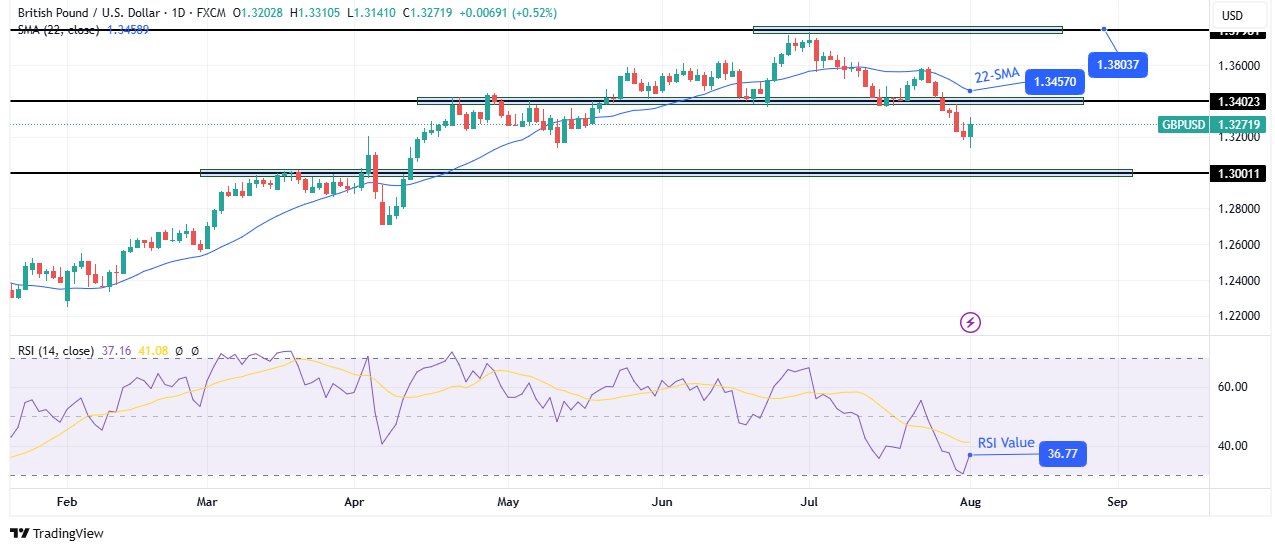
On the technical side, the GBP/USD price trades well below the 22-SMA, showing bears are in the lead. At the same time, the RSI trades below 50, indicating solid bearish momentum. At the same time, the price recently broke below the 1.3402 support level to form a lower low. This confirms a bearish trend.
–Are you interested in learning more about forex basics? Check our detailed guide-
Previously, the price was in a bullish trend that paused near the 1.3803 key level. Bears took charge by breaking below the 22-SMA and respecting it as resistance. The bearish bias is strong, especially since the price has confirmed a new downtrend.
Currently, the price has paused after making a lower low. It might pull back to retest the recently broken 1.3402 level before dropping to fresh lows. The next target for GBP/USD is at the 1.3001 key support level. A break below will strengthen the bearish bias.
Looking to trade forex now? Invest at eToro!
68% of retail investor accounts lose money when trading CFDs with this provider. You should consider whether you can afford to take the high risk of losing your money.
Silver (XAG/USD) continues to struggle under the weight of a stronger US Dollar, extending its decline from the 14-year high of $39.53 reached on July 23. At the time of writing, the white metal is trading near $36.50 during the American trading session, down nearly 4.5% so far this week, with traders turning cautious ahead of Friday’s key US Nonfarm Payrolls (NFP) report at 12:30 GMT.
Technically, on the daily chart, Silver has broken below the ascending channel that had supported its uptrend since early April, marking a clear shift in market structure. This breakdown suggests bullish momentum has faded and a deeper correction may be unfolding. The metal is now hovering just above the 50-day Exponential Moving Average (EMA) at $36.54, which acts as immediate support. A daily close below this zone could expose the next key downside target at the 100-day Simple Moving Average (SMA) near $34.65.
Momentum indicators reinforce the bearish case. On the daily chart, the Relative Strength Index (RSI) has slipped to 40, signaling weakening momentum and a slide toward oversold territory. Meanwhile, the MACD has turned negative, with a bearish crossover in place, signaling further downside risks.
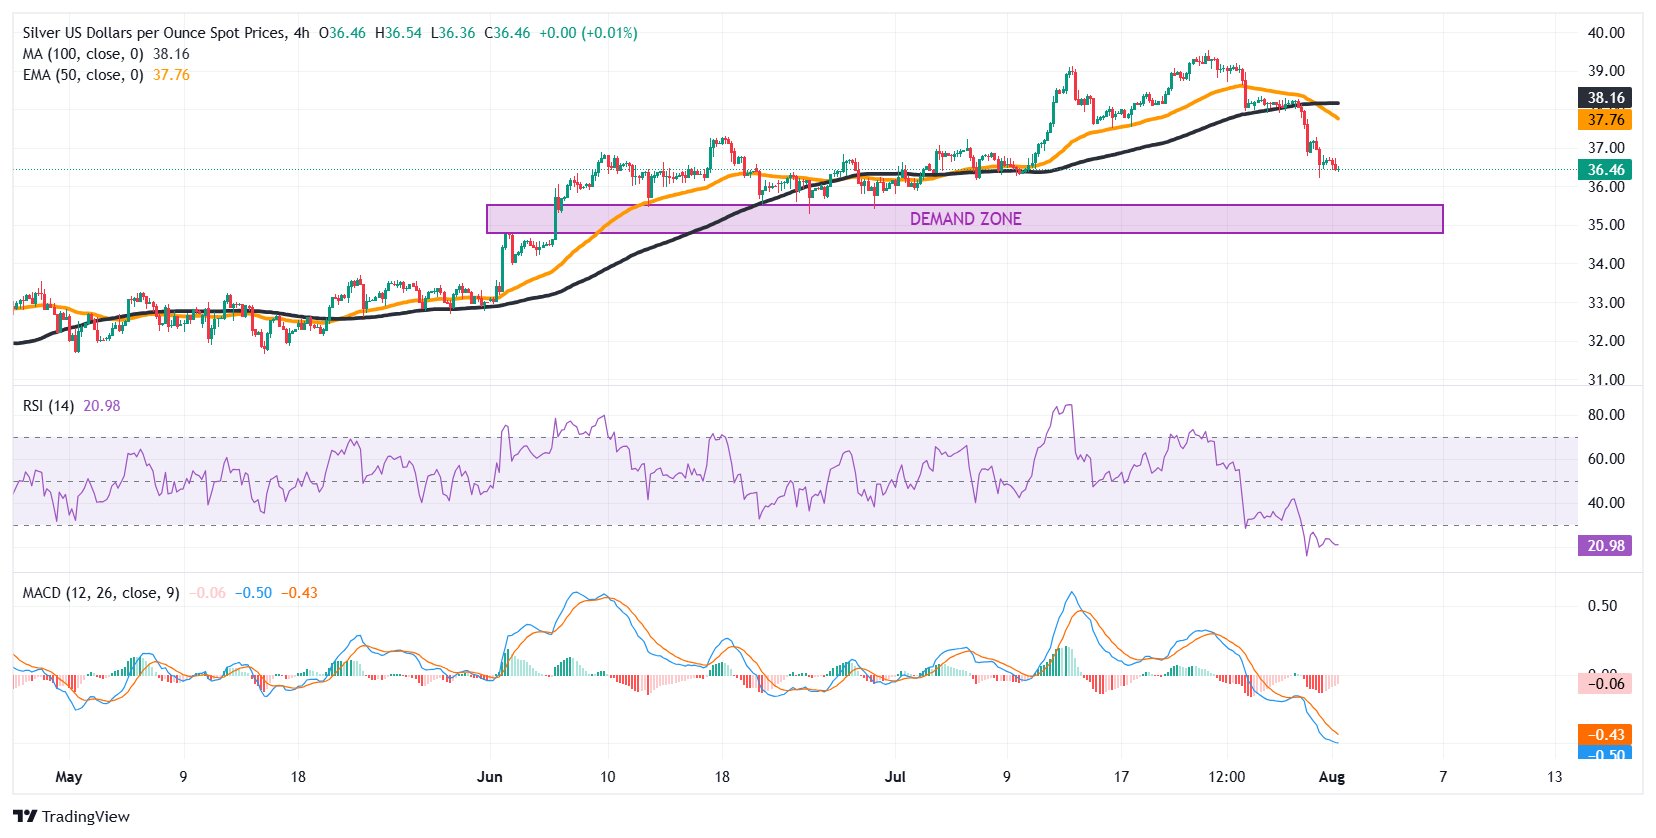
Zooming into the 4-hour timeframe, Silver has broken below both the 50-EMA and 100-SMA, underscoring persistent short-term selling pressure. Price is now approaching a key demand zone in the $35.30-$35.70 range, which could offer some near-term support. However, with the 4-hour RSI plunging to oversold levels near 21, a short-term bounce is possible. Still, the MACD remains deep in negative territory, suggesting the broader bias remains tilted to the downside — unless a softer-than-expected NFP print sparks a reversal.
Silver is a precious metal highly traded among investors. It has been historically used as a store of value and a medium of exchange. Although less popular than Gold, traders may turn to Silver to diversify their investment portfolio, for its intrinsic value or as a potential hedge during high-inflation periods. Investors can buy physical Silver, in coins or in bars, or trade it through vehicles such as Exchange Traded Funds, which track its price on international markets.
Silver prices can move due to a wide range of factors. Geopolitical instability or fears of a deep recession can make Silver price escalate due to its safe-haven status, although to a lesser extent than Gold’s. As a yieldless asset, Silver tends to rise with lower interest rates. Its moves also depend on how the US Dollar (USD) behaves as the asset is priced in dollars (XAG/USD). A strong Dollar tends to keep the price of Silver at bay, whereas a weaker Dollar is likely to propel prices up. Other factors such as investment demand, mining supply – Silver is much more abundant than Gold – and recycling rates can also affect prices.
Silver is widely used in industry, particularly in sectors such as electronics or solar energy, as it has one of the highest electric conductivity of all metals – more than Copper and Gold. A surge in demand can increase prices, while a decline tends to lower them. Dynamics in the US, Chinese and Indian economies can also contribute to price swings: for the US and particularly China, their big industrial sectors use Silver in various processes; in India, consumers’ demand for the precious metal for jewellery also plays a key role in setting prices.
Silver prices tend to follow Gold’s moves. When Gold prices rise, Silver typically follows suit, as their status as safe-haven assets is similar. The Gold/Silver ratio, which shows the number of ounces of Silver needed to equal the value of one ounce of Gold, may help to determine the relative valuation between both metals. Some investors may consider a high ratio as an indicator that Silver is undervalued, or Gold is overvalued. On the contrary, a low ratio might suggest that Gold is undervalued relative to Silver.
A decisive and sustained breakout above today’s high would put gold back into the pennant formation. Potential support would then be around the moving averages. If this scenario begins to unfold and momentum stays muted, the pennant pattern may be in the process of expanding its footprint as consolidation continues.
This week’s low establishes a higher swing low, which retains the pattern of recent higher swing lows. Moreover, the recent upside breakout of the pattern failed to follow-through and generated a lower swing high. New trendlines have been added to the expanded parameters of the pattern, while the initial boundary lines remain as dotted blue lines.
The new territory of the pennant shows that consolidation could continue for another month or so before a decisive breakout from the new parameter’s triggers, given the location of the pennant triangle apex. Key price levels are last week’s lower swing high of $3,349 and this week’s higher swing low at $3,268. Trendlines indicate a narrower price range but are less unreliable as a signal.
The weekly chart provides supporting evidence that strength could be maintained within the newly formed pennant boundaries. This week’s low found support near the long-term 20-Week MA. It was followed by a rally that looks likely to end the week in the green and near the highs for the week. Unless there is a sharp selloff before the closing of the session, gold will form a bullish hammer candlestick pattern. It is interesting to note that this bullish candlestick pattern will follow last week’s bearish shooting star pattern.
For a look at all of today’s economic events, check out our economic calendar.
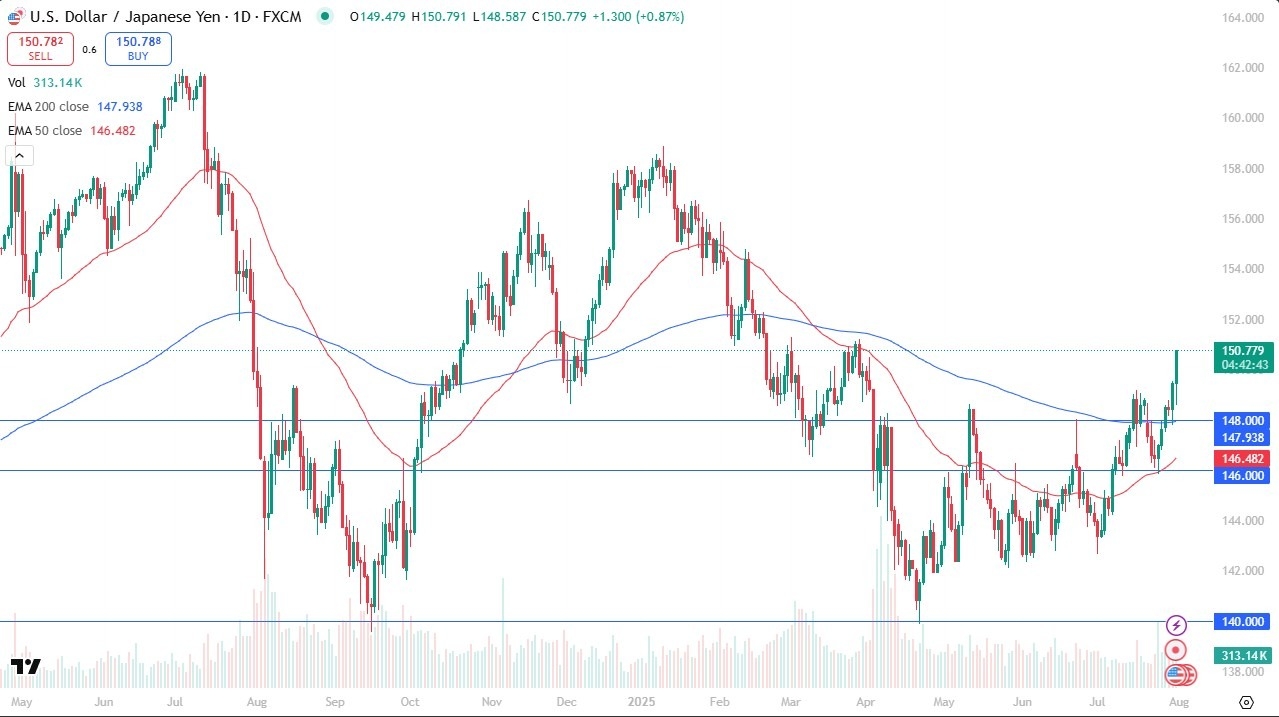
The US dollar has gotten slammed against the Japanese yen during the trading session here on Friday as well, as now it looks like the reaction is going to cause chaos. That being said, I think there’s still support underneath, and I think it’s only a matter of time before the support could come into the picture at the 200 day EMA and the 148 yen level, but we’ll just have to wait and see how that plays out. If we turn around and start rallying again, we could go looking at the 151 yen level. At this point, I still prefer the upside for now, but we’ll see how this plays out over the next couple of days.
The Australian dollar rallied and looked like it’s going to try to break the top of an inverted hammer. We’ll have to wait and see how this closes. But if it closes above the 50 day EMA, that would be a bullish sign for the Aussie. That being said, if the job situation in the United States continues to deteriorate, that actually quite often will make the US dollar stronger over the longer term because people run into buy treasuries. If the US jobs numbers and the job market starts to crumble, the rest of the world goes with it.
Typically, what we see is a month or two of strength in other places and then it starts to show up in their economy. There’s an old adage that says, when the US sneezes, the world catches a cold. I’ve been told multiple times in the last 18 years that that’s no longer true. And every time it happens, it ends up being true. So do keep that in mind. I think strength in other currencies could be a short-term thing. I can really see that environment. But over the longer term, if this keeps up, people run to the Treasury market, so keep that in mind.
For a look at all of today’s economic events, check out our economic calendar.
Important DisclaimersThe content provided on the website includes general news and publications, our personal analysis and opinions, and contents provided by third parties, which are intended for educational and research purposes only. It does not constitute, and should not be read as, any recommendation or advice to take any action whatsoever, including to make any investment or buy any product. When making any financial decision, you should perform your own due diligence checks, apply your own discretion and consult your competent advisors. The content of the website is not personally directed to you, and we does not take into account your financial situation or needs.The information contained in this website is not necessarily provided in real-time nor is it necessarily accurate. Prices provided herein may be provided by market makers and not by exchanges.Any trading or other financial decision you make shall be at your full responsibility, and you must not rely on any information provided through the website. FX Empire does not provide any warranty regarding any of the information contained in the website, and shall bear no responsibility for any trading losses you might incur as a result of using any information contained in the website.The website may include advertisements and other promotional contents, and FX Empire may receive compensation from third parties in connection with the content. FX Empire does not endorse any third party or recommends using any third party’s services, and does not assume responsibility for your use of any such third party’s website or services.FX Empire and its employees, officers, subsidiaries and associates, are not liable nor shall they be held liable for any loss or damage resulting from your use of the website or reliance on the information provided on this website.Risk DisclaimersThis website includes information about cryptocurrencies, contracts for difference (CFDs) and other financial instruments, and about brokers, exchanges and other entities trading in such instruments. Both cryptocurrencies and CFDs are complex instruments and come with a high risk of losing money. You should carefully consider whether you understand how these instruments work and whether you can afford to take the high risk of losing your money.FX Empire encourages you to perform your own research before making any investment decision, and to avoid investing in any financial instrument which you do not fully understand how it works and what are the risks involved.
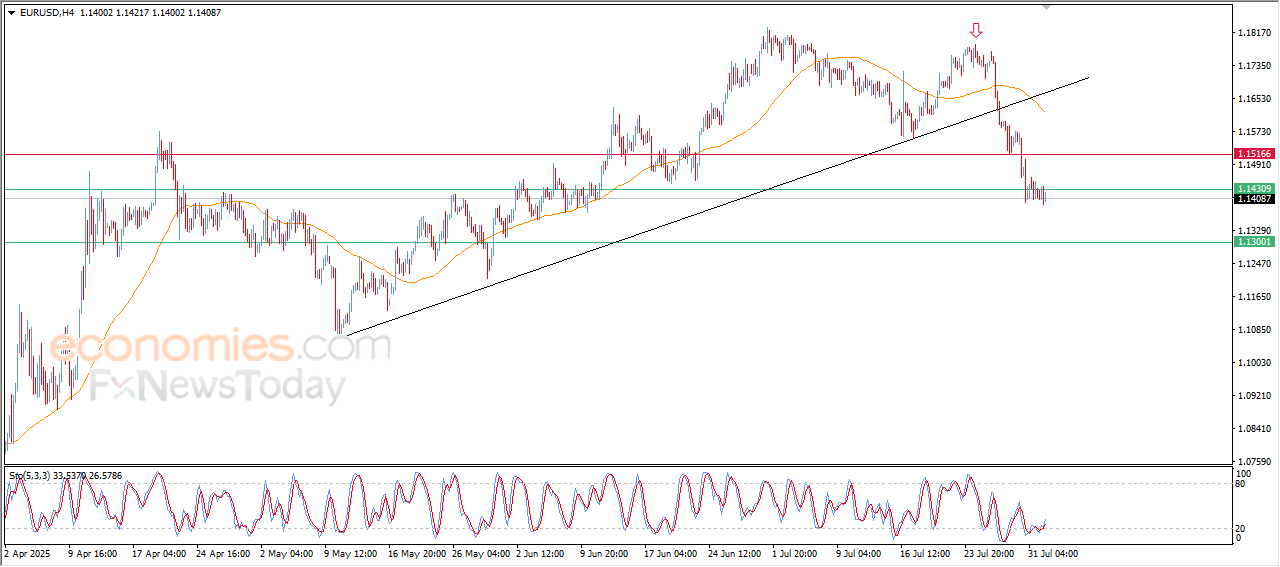
The price of (EURUSD) rose slightly in its last intraday trading, attempting to recover its early losses, to offload some of its clear oversold levels on the (RSI), especially with the emergence of positive signals that reinforce the chances for intraday stability.
This limited rise comes amid the continuation of the dominance of bearish correctional wave, indicating the superiority of the selling powers on the trading in the near-term basis, imposing restrictions on any attempts for recovery.
High-accuracy trading signals delivered directly to your Telegram. Subscribe to specialized packages tailored for the world’s most important markets – all powered by BestTradingSignal.com .
The longer the subscription, the greater the savings and the more value you get.
Weekly performance report available here: Signals Performance – Week of July 21–25, 2025
The U.S. dollar index (DXY) surged to its highest level since May 29, making gold more expensive for non-dollar holders. This currency pressure has reinforced bearish momentum for gold in the short term, with traders cautious following another firm set of U.S. macro readings. The Federal Reserve left its benchmark rate unchanged at 4.25%-4.50% on Wednesday and gave no signal for a September rate cut.
Recent U.S. economic data—GDP, jobless claims, and PCE inflation—all supported the Fed’s hawkish hold, reinforcing reluctance to pivot dovishly. “Gold remains weighed by reduced bets for Fed rate cuts for the rest of 2025,” said Han Tan, chief market analyst at Nemo.Money.
While the macro backdrop leans bearish for gold, geopolitical risks are offering partial support. Former President Donald Trump reintroduced aggressive tariffs targeting Canada, Brazil, India, and Taiwan—moves that could drag on global economic growth and potentially lift safe-haven demand.
June inflation data already reflected early tariff impacts, with price increases on some imported goods. The full economic implications remain unclear, but growing trade tensions could eventually support gold as investors hedge broader global risk.
Physical gold demand picked up in Asia this week as lower spot prices spurred buying interest, especially from Indian and Chinese markets. However, continued price swings and weak sentiment prevented a stronger rebound in physical flows. With gold hovering below key technical levels, retail interest remains tepid.
– Written by
Ben Hughes
STORY LINK GBP/USD Forecast: Pound Surges Against Dollar as US Jobs Slows Sharply
The US Dollar dived after the latest US jobs data, and the Pound to Dollar (GBP/USD) exchange rate recovered from 10-week lows near 1.3140 to just above the 1.3300 level in an immediate reaction.
Another important element, however, was a decline in equity markets and a weaker tone surrounding risk appetite with unease over US tariff developments amplifying the impact of the jobs shock.
Weaker risk appetite hampered the Pound in global markets and GBP/USD settled around 1.3265.
The latest US jobs data recorded an increase in July non-farm payrolls of 73,000 compared with market expectations of just over 100,000.
There were big revisions with the June increase downgraded to 14,000 from the provisional reading of 147,000.
For May and June, there was a huge downward revision of 258,000 jobs.
ING commented; “This puts a completely different light on what has been happening in the US economy post the 2 April ‘Liberation Day’ announcements.”

The latest ISM manufacturing business confidence data was also weaker than expected, increasing reservations over the outlook.
There has been a big shift in expectations surrounding Fed policy with markets now pricing in close to an 80% chance that rates will be cut at the September meeting compared with less than 40% ahead of the data which undermined the dollar.
Markets had been broadly unruffled by the latest tariff developments, but the payrolls revisions put a slightly different perspective on the outlook.
Trump pressure on Fed Chair Powell is also likely to intensify.
“The July employment report was a dud. Nonfarm payrolls rose by 73K in July, short of expectations and coming on the heels of sharp downward revisions to the prior two months” say economists at Wells Fargo.
“The unemployment rate rose to 4.2% from 4.1%, and the labor force participation rate ticked lower for the third straight month,” added Sarah House, Senior Economist at Wells Fargo.
“Coming into today’s report, our base case forecast was that the FOMC would cut the federal funds rate by 25 bps at its September, October and December meetings, with no additional rate cuts in 2026. Based on today’s data, we are inclined to leave that projection unchanged for now.”

The latest US jobs data delivered a stark reassessment of recent labour market strength.
International Money Transfer? Ask our resident FX expert a money transfer question or try John’s new, free, no-obligation personal service! ,where he helps every step of the way,
ensuring you get the best exchange rates on your currency requirements.
TAGS: Pound Dollar Forecasts

If you take the measured move of the previous ascending triangle that we broke out of, we’re probably looking at about 156.5 yen, all things being equal though. I think this is a situation where any pullback that we get will end up being a buying opportunity as the federal reserve looks likely to remain somewhat tight while the Japanese central bank has no choice but to be loose, as the bond market in Japan is in trouble recently. That being said, the jobs number on Friday morning may cause a bit of a pullback.
I look at that as an opportunity to get long yet again. I’ve got no interest whatsoever in shorting. I do think that the 148 yen level, which is also the two hundred day EMA will offer a significant amount of support. Again, I won’t short this pair.
I believe that the us dollar is making a huge turnaround against most currencies, and the Japanese yen is especially vulnerable at this point in time. However, I also expect to see that the US dollar will more likely than not move in the same direction against almost everything.
Want to trade our USD/JPY forex analysis and predictions? Here’s a list of forex brokers in Japan to check out.
Christopher Lewis has been trading Forex and has over 20 years experience in financial markets. Chris has been a regular contributor to Daily Forex since the early days of the site. He writes about Forex for several online publications, including FX Empire, Investing.com, and his own site, aptly named The Trader Guy. Chris favours technical analysis methods to identify his trades and likes to trade equity indices and commodities as well as Forex. He favours a longer-term trading style, and his trades often last for days or weeks.
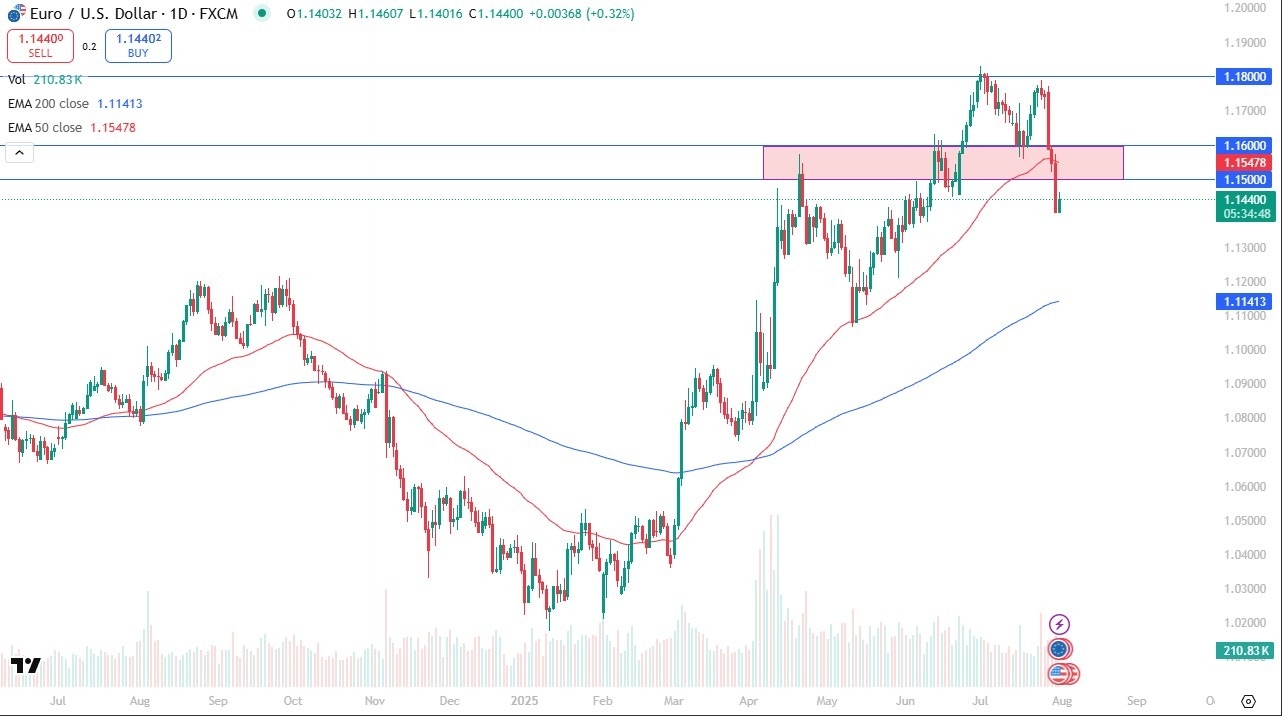
Because of this, we have to ask the question as to whether or not we are about to see a breakdown. The market broke down below the 1.15 level, and the 50 Day EMA, both of which are very negative turns of event. The market being sub 1.15 is rather telling, and I think you’ve got a situation where people are going to be looking for some type of continuation. The jobs number on Friday could be the next catalyst, we don’t know, but quite frankly if the jobs number comes out hotter than anticipated, this will be yet another reason to think that the Federal Reserve will stay hawkish and stay away from cutting rates. On the other hand, the Europeans have to deal with quite a bit of energy dependence on the United States, and that’s something that we may have to watch from a longer-term standpoint.
On the other hand, if we were to break out to the upside, it’s not until we recapture the 50 Day EMA at the very least that I would consider buying. In that environment, we would probably see the US dollar drop significantly against most currencies, not just the Euro. Ultimately, this is a situation where it’s likely that the Euro would just be benefiting from US dollar weakness rather than any real strength at that point. Ultimately, I think this is a market that continues lower if the jobs number comes out significantly higher than the expected 106,000 jobs added in the United States.
Ready to trade our daily Forex analysis? We’ve made a list of the best forex demo accounts worth trading with.
Christopher Lewis has been trading Forex and has over 20 years experience in financial markets. Chris has been a regular contributor to Daily Forex since the early days of the site. He writes about Forex for several online publications, including FX Empire, Investing.com, and his own site, aptly named The Trader Guy. Chris favours technical analysis methods to identify his trades and likes to trade equity indices and commodities as well as Forex. He favours a longer-term trading style, and his trades often last for days or weeks.