The main category of Forex News.
You can use the search box below to find what you need.
[wd_asp id=1]
The main category of Forex News.
You can use the search box below to find what you need.
[wd_asp id=1]
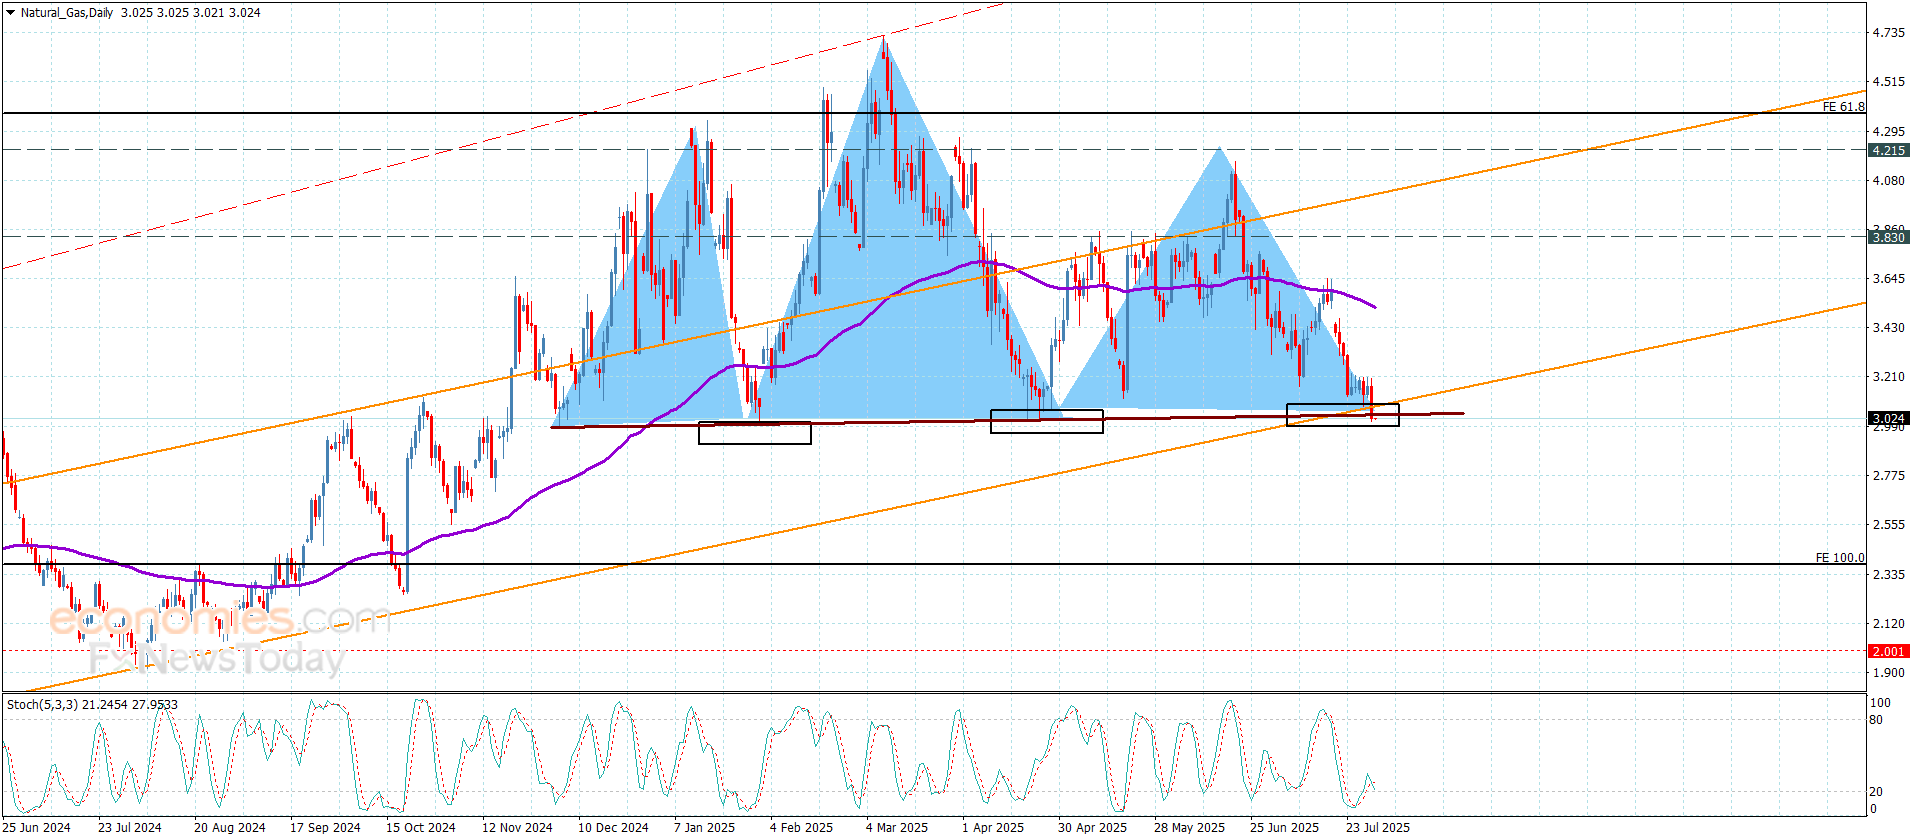
Natural gas price returned to form new negative trading affected by stochastic negativity, providing strong pressures on the critical support at $3.050, which represents the head and shoulders pattern.
Note that breaking the current support will confirm activating the negative pattern, to move to a new negative track, forcing it to suffer several losses by reaching $2.710 and $2.390, for regaining the bullish bias we recommend waiting for providing positive close above $3.320 to ease achieving several gains that might begin at $3.450 and $3.610.
The expected trading range for today is between $2.710 and $3.150.
Trend forecast: Bearish
Important DisclaimersThe content provided on the website includes general news and publications, our personal analysis and opinions, and contents provided by third parties, which are intended for educational and research purposes only. It does not constitute, and should not be read as, any recommendation or advice to take any action whatsoever, including to make any investment or buy any product. When making any financial decision, you should perform your own due diligence checks, apply your own discretion and consult your competent advisors. The content of the website is not personally directed to you, and we does not take into account your financial situation or needs.The information contained in this website is not necessarily provided in real-time nor is it necessarily accurate. Prices provided herein may be provided by market makers and not by exchanges.Any trading or other financial decision you make shall be at your full responsibility, and you must not rely on any information provided through the website. FX Empire does not provide any warranty regarding any of the information contained in the website, and shall bear no responsibility for any trading losses you might incur as a result of using any information contained in the website.The website may include advertisements and other promotional contents, and FX Empire may receive compensation from third parties in connection with the content. FX Empire does not endorse any third party or recommends using any third party’s services, and does not assume responsibility for your use of any such third party’s website or services.FX Empire and its employees, officers, subsidiaries and associates, are not liable nor shall they be held liable for any loss or damage resulting from your use of the website or reliance on the information provided on this website.Risk DisclaimersThis website includes information about cryptocurrencies, contracts for difference (CFDs) and other financial instruments, and about brokers, exchanges and other entities trading in such instruments. Both cryptocurrencies and CFDs are complex instruments and come with a high risk of losing money. You should carefully consider whether you understand how these instruments work and whether you can afford to take the high risk of losing your money.FX Empire encourages you to perform your own research before making any investment decision, and to avoid investing in any financial instrument which you do not fully understand how it works and what are the risks involved.
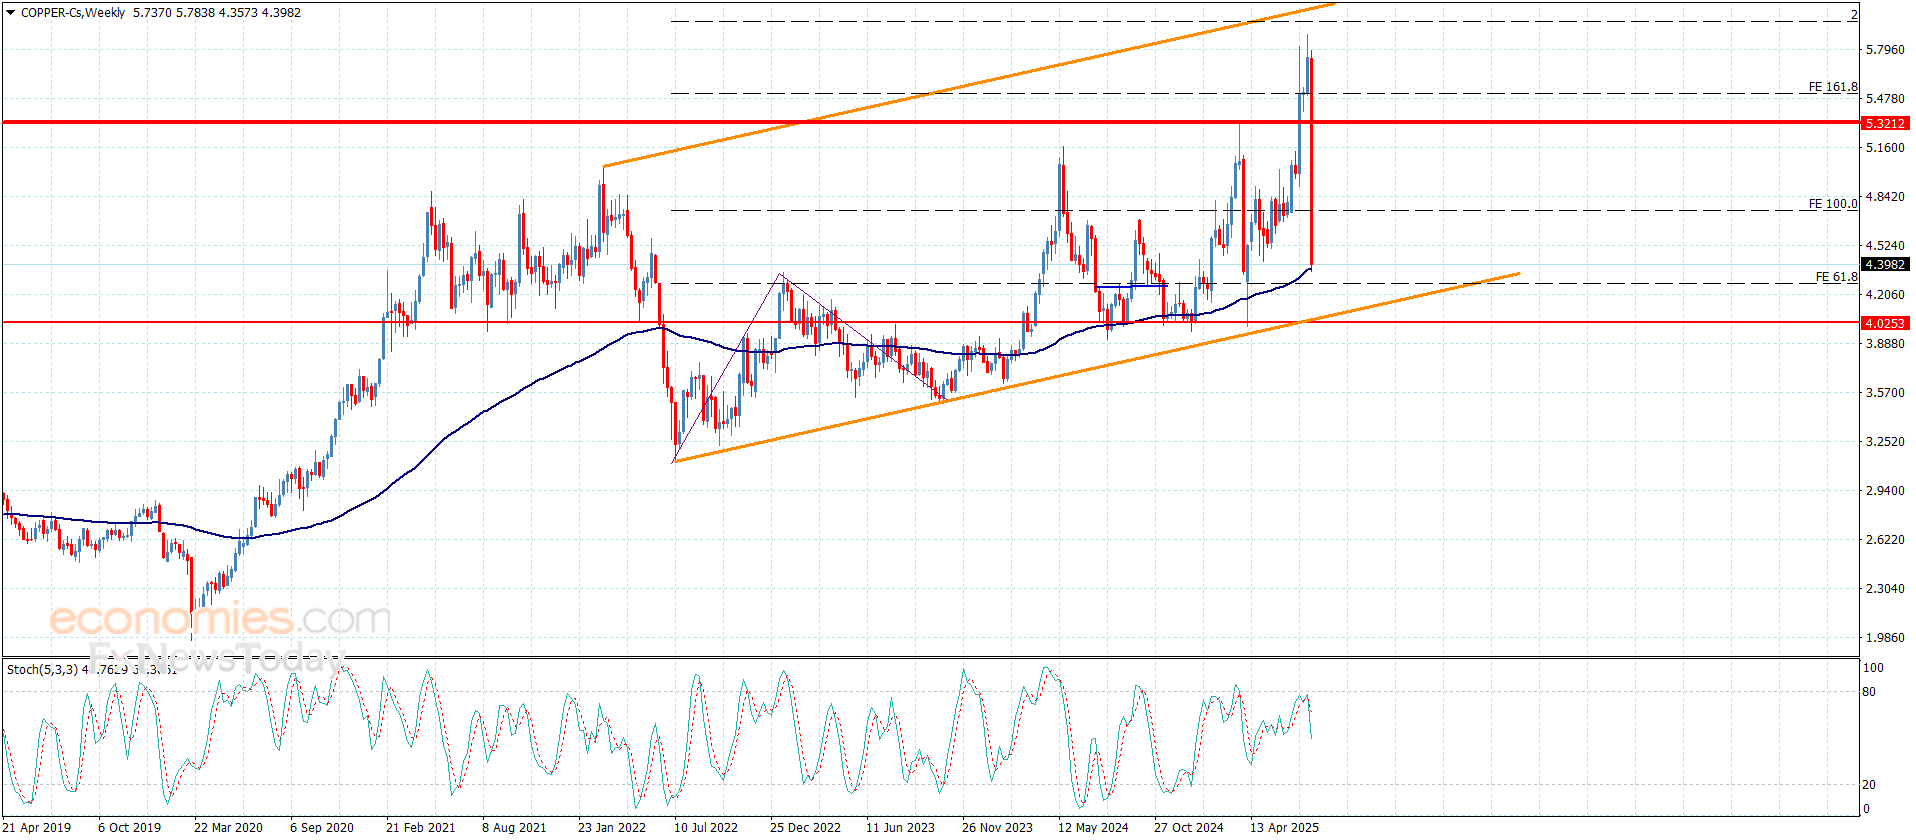
Copper price is under strong bearish pressure to push it to decline below the support at $5.3200, to lose most of its previous gains to reach $4.3900, to face the moving average of 55.
Despite the main stability within the main bullish channel’s levels, the contradiction between the main indicators may increase the chances for suffering extra losses by targeting 161%Fibonacci extension level at $4.2650, while renewing the bullish attempts requires stepping above $4.7400 level, providing chance for recording gains again.
The expected trading range for today is between $4.2600 and $4.5200
Trend forecast: Fluctuated within the bullish track
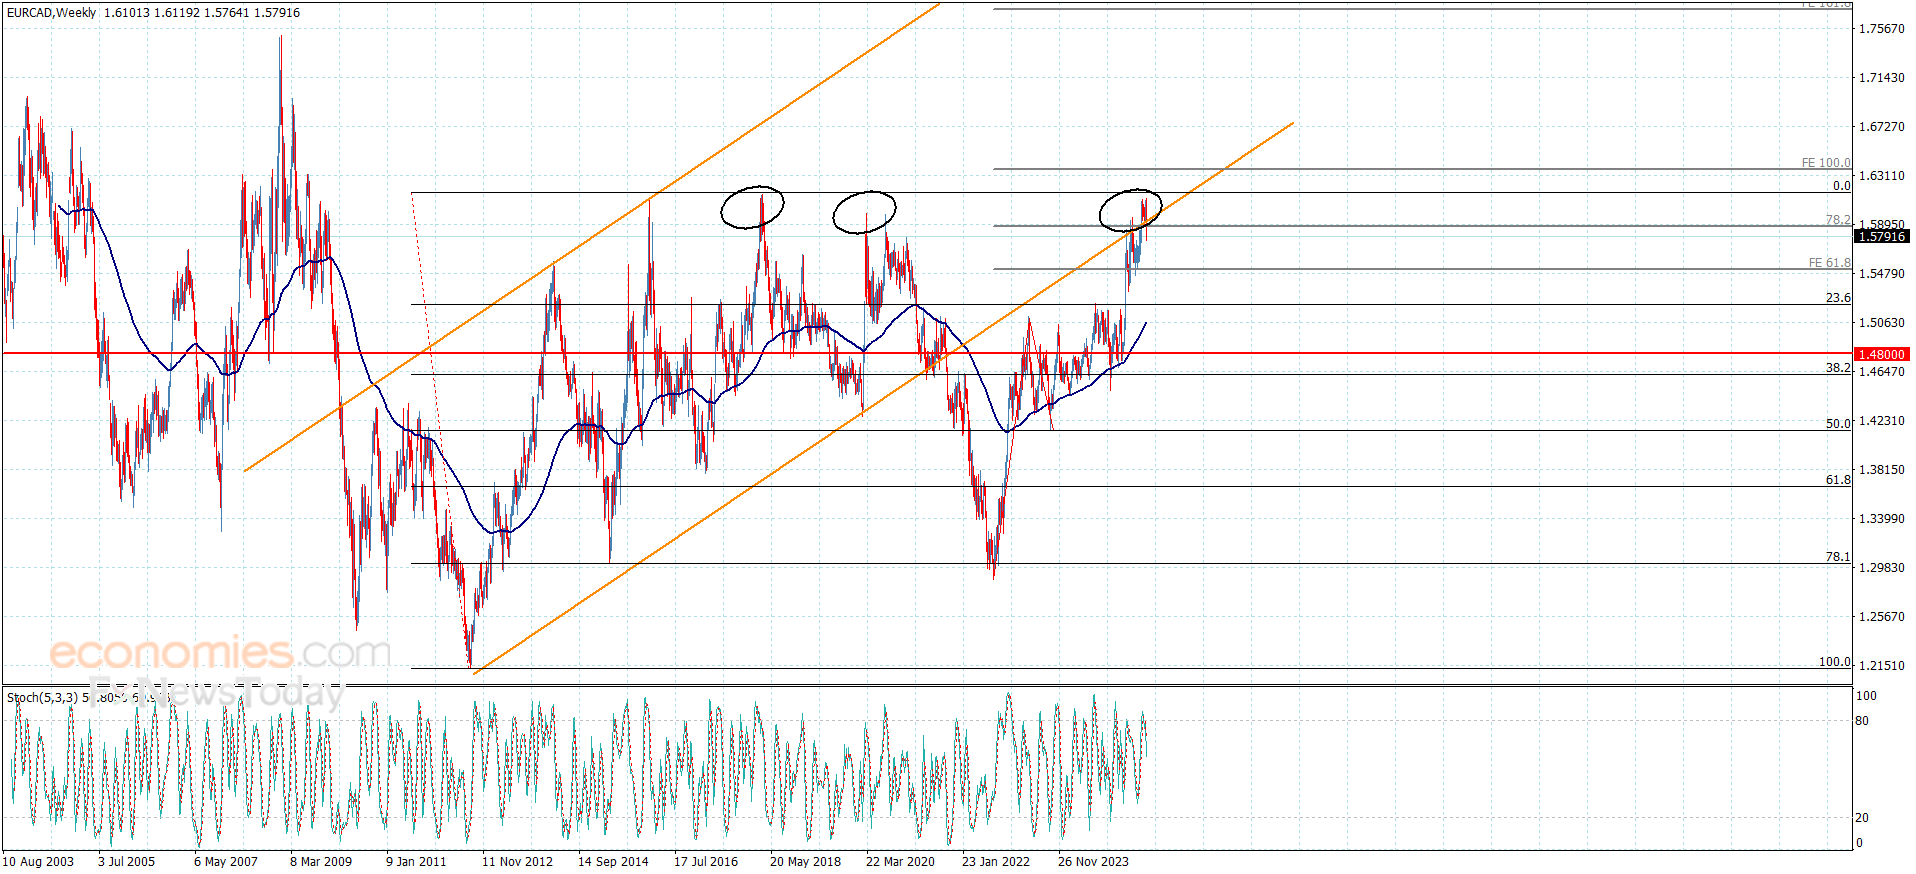
The EURCAD attempted to regain the bullish bias by its rally above the broken bullish channel’s support at 1.5945 level, achieving some of the gains by its rally to 1.1600, to face a strong rejection due to entering zones of high liquidity absorption, to rebound to the downside strongly towards 1.5775, confirming its exit from the bullish track again.
Forming a strong resistance at 1.5930 level against the current trading and providing negative momentum by stochastic, these factors make us prefer the bearish bias dominance, which might target 1.5660 level, reaching the extra support at 1.5530 level.
The expected trading range for today is between 1.5660 and 1.5860
Trend forecast: Bearish
Copper price is under strong bearish pressure to push it to decline below the support at $5.3200, to lose most of its previous gains to reach $4.3900, to face the moving average of 55.
Despite the main stability within the main bullish channel’s levels, the contradiction between the main indicators may increase the chances for suffering extra losses by targeting 161%Fibonacci extension level at $4.2650, while renewing the bullish attempts requires stepping above $4.7400 level, providing chance for recording gains again.
The expected trading range for today is between $4.2600 and $4.5200
Trend forecast: Fluctuated within the bullish track
Copper price is under strong bearish pressure to push it to decline below the support at $5.3200, to lose most of its previous gains to reach $4.3900, to face the moving average of 55.
Despite the main stability within the main bullish channel’s levels, the contradiction between the main indicators may increase the chances for suffering extra losses by targeting 161%Fibonacci extension level at $4.2650, while renewing the bullish attempts requires stepping above $4.7400 level, providing chance for recording gains again.
The expected trading range for today is between $4.2600 and $4.5200
Trend forecast: Fluctuated within the bullish track
GBP/USD lost about 0.8% on Wednesday and touched its lowest level since mid-May, closing the fifth consecutive trading day in negative territory. The pair struggles to gather recovery momentum and trades at around 1.3250 in the European session on Thursday.
The table below shows the percentage change of British Pound (GBP) against listed major currencies this week. British Pound was the weakest against the US Dollar.
| USD | EUR | GBP | JPY | CAD | AUD | NZD | CHF | |
|---|---|---|---|---|---|---|---|---|
| USD | 2.73% | 1.40% | 1.27% | 0.98% | 1.86% | 1.73% | 1.97% | |
| EUR | -2.73% | -1.32% | -1.40% | -1.72% | -0.85% | -0.98% | -0.75% | |
| GBP | -1.40% | 1.32% | -0.26% | -0.40% | 0.47% | 0.35% | 0.57% | |
| JPY | -1.27% | 1.40% | 0.26% | -0.29% | 0.55% | 0.44% | 0.84% | |
| CAD | -0.98% | 1.72% | 0.40% | 0.29% | 0.86% | 0.75% | 0.98% | |
| AUD | -1.86% | 0.85% | -0.47% | -0.55% | -0.86% | -0.12% | 0.10% | |
| NZD | -1.73% | 0.98% | -0.35% | -0.44% | -0.75% | 0.12% | 0.23% | |
| CHF | -1.97% | 0.75% | -0.57% | -0.84% | -0.98% | -0.10% | -0.23% |
The heat map shows percentage changes of major currencies against each other. The base currency is picked from the left column, while the quote currency is picked from the top row. For example, if you pick the British Pound from the left column and move along the horizontal line to the US Dollar, the percentage change displayed in the box will represent GBP (base)/USD (quote).
Robust macroeconomic data releases from the United States (US) and the Federal Reserve’s (Fed) cautious tone on policy-easing fuelled a bullish rally in the US Dollar (USD) midweek, causing GBP/USD to decline sharply.
The US Bureau of Economic Analysis’ (BEA) first estimate showed that the United States’ (US) economy staged an impressive comeback following the 0.5% contraction seen in the first quarter. The Gross Domestic Product (GDP) grew at an annual rate of 3% in the second quarter, surpassing the market expectation of 2.4%. Additionally, ADP Employment Change came in at 104,000 in July, beating analysts’ estimate of 78,000 by a wide margin.
Later in the day, the Fed announced that it maintained the policy rate at the range of 4.25%-4.5% in a widely expected decision. The policy statement showed that Governor Christopher Waller and Governor Michelle Bowman dissented, preferring a 25 basis points (bps) rate cut, which was also anticipated.
In the post-meeting press conference, Fed Chairman Jerome Powell refrained from confirming a rate cut at the next meeting in September, citing heathy conditions in the labor market and explaining that the current policy stance as being appropriate to guard against inflation risks. Moreover, Powell said that the policy was not holding back the economy despite being still modestly restrictive.
According go the CME FedWatch Tool, the probability of a 25 basis points Fed rate cut in September dropped toward 40% from above-60% before the Fed event. In turn, US Treasury bond yields pushed higher and the USD outperformed its rivals during the American trading hours.
The BEA will release Personal Consumption Expenditures (PCE) Price Index data for June on Thursday. Powell said that they expect the annual PCE inflation and Core PCE inflation to come in at 2.5% and 2.7%, respectively. Weekly Initial Jobless Claims will also be featured in the US economic calendar. Ahead of Friday’s critical July employment report, investors could remain hesitant to take large positions based on this data.
It’s important to note that month-end flows on the last day of July could ramp up volatility toward the end of the European session and trigger irregular movements in the pair.
The Relative Strength Index (RSI) indicator on the 4-hour chart stays below 30 after the short-lasting recovery attempt, suggesting that GBP/USD remains technically oversold.
On the upside, 1.3300 (Fibonacci 78.6% retracement of the latest uptrend) aligns as the first resistance level before 1.3330 (static level) and 1.3400 (Fibonacci 61.8% retracement). Looking south, support levels could be seen at 1.3230 (static level), 1.3200 (static level, round level) and 1.3160 (beginning point of the uptrend).
The Pound Sterling (GBP) is the oldest currency in the world (886 AD) and the official currency of the United Kingdom. It is the fourth most traded unit for foreign exchange (FX) in the world, accounting for 12% of all transactions, averaging $630 billion a day, according to 2022 data.
Its key trading pairs are GBP/USD, also known as ‘Cable’, which accounts for 11% of FX, GBP/JPY, or the ‘Dragon’ as it is known by traders (3%), and EUR/GBP (2%). The Pound Sterling is issued by the Bank of England (BoE).
The single most important factor influencing the value of the Pound Sterling is monetary policy decided by the Bank of England. The BoE bases its decisions on whether it has achieved its primary goal of “price stability” – a steady inflation rate of around 2%. Its primary tool for achieving this is the adjustment of interest rates.
When inflation is too high, the BoE will try to rein it in by raising interest rates, making it more expensive for people and businesses to access credit. This is generally positive for GBP, as higher interest rates make the UK a more attractive place for global investors to park their money.
When inflation falls too low it is a sign economic growth is slowing. In this scenario, the BoE will consider lowering interest rates to cheapen credit so businesses will borrow more to invest in growth-generating projects.
Data releases gauge the health of the economy and can impact the value of the Pound Sterling. Indicators such as GDP, Manufacturing and Services PMIs, and employment can all influence the direction of the GBP.
A strong economy is good for Sterling. Not only does it attract more foreign investment but it may encourage the BoE to put up interest rates, which will directly strengthen GBP. Otherwise, if economic data is weak, the Pound Sterling is likely to fall.
Another significant data release for the Pound Sterling is the Trade Balance. This indicator measures the difference between what a country earns from its exports and what it spends on imports over a given period.
If a country produces highly sought-after exports, its currency will benefit purely from the extra demand created from foreign buyers seeking to purchase these goods. Therefore, a positive net Trade Balance strengthens a currency and vice versa for a negative balance.
Copper price is under strong bearish pressure to push it to decline below the support at $5.3200, to lose most of its previous gains to reach $4.3900, to face the moving average of 55.
Despite the main stability within the main bullish channel’s levels, the contradiction between the main indicators may increase the chances for suffering extra losses by targeting 161%Fibonacci extension level at $4.2650, while renewing the bullish attempts requires stepping above $4.7400 level, providing chance for recording gains again.
The expected trading range for today is between $4.2600 and $4.5200
Trend forecast: Fluctuated within the bullish track
This week’s USD/JPY price action perfectly validated the top-down approach we discussed during the webinar. Check the video below for reference:
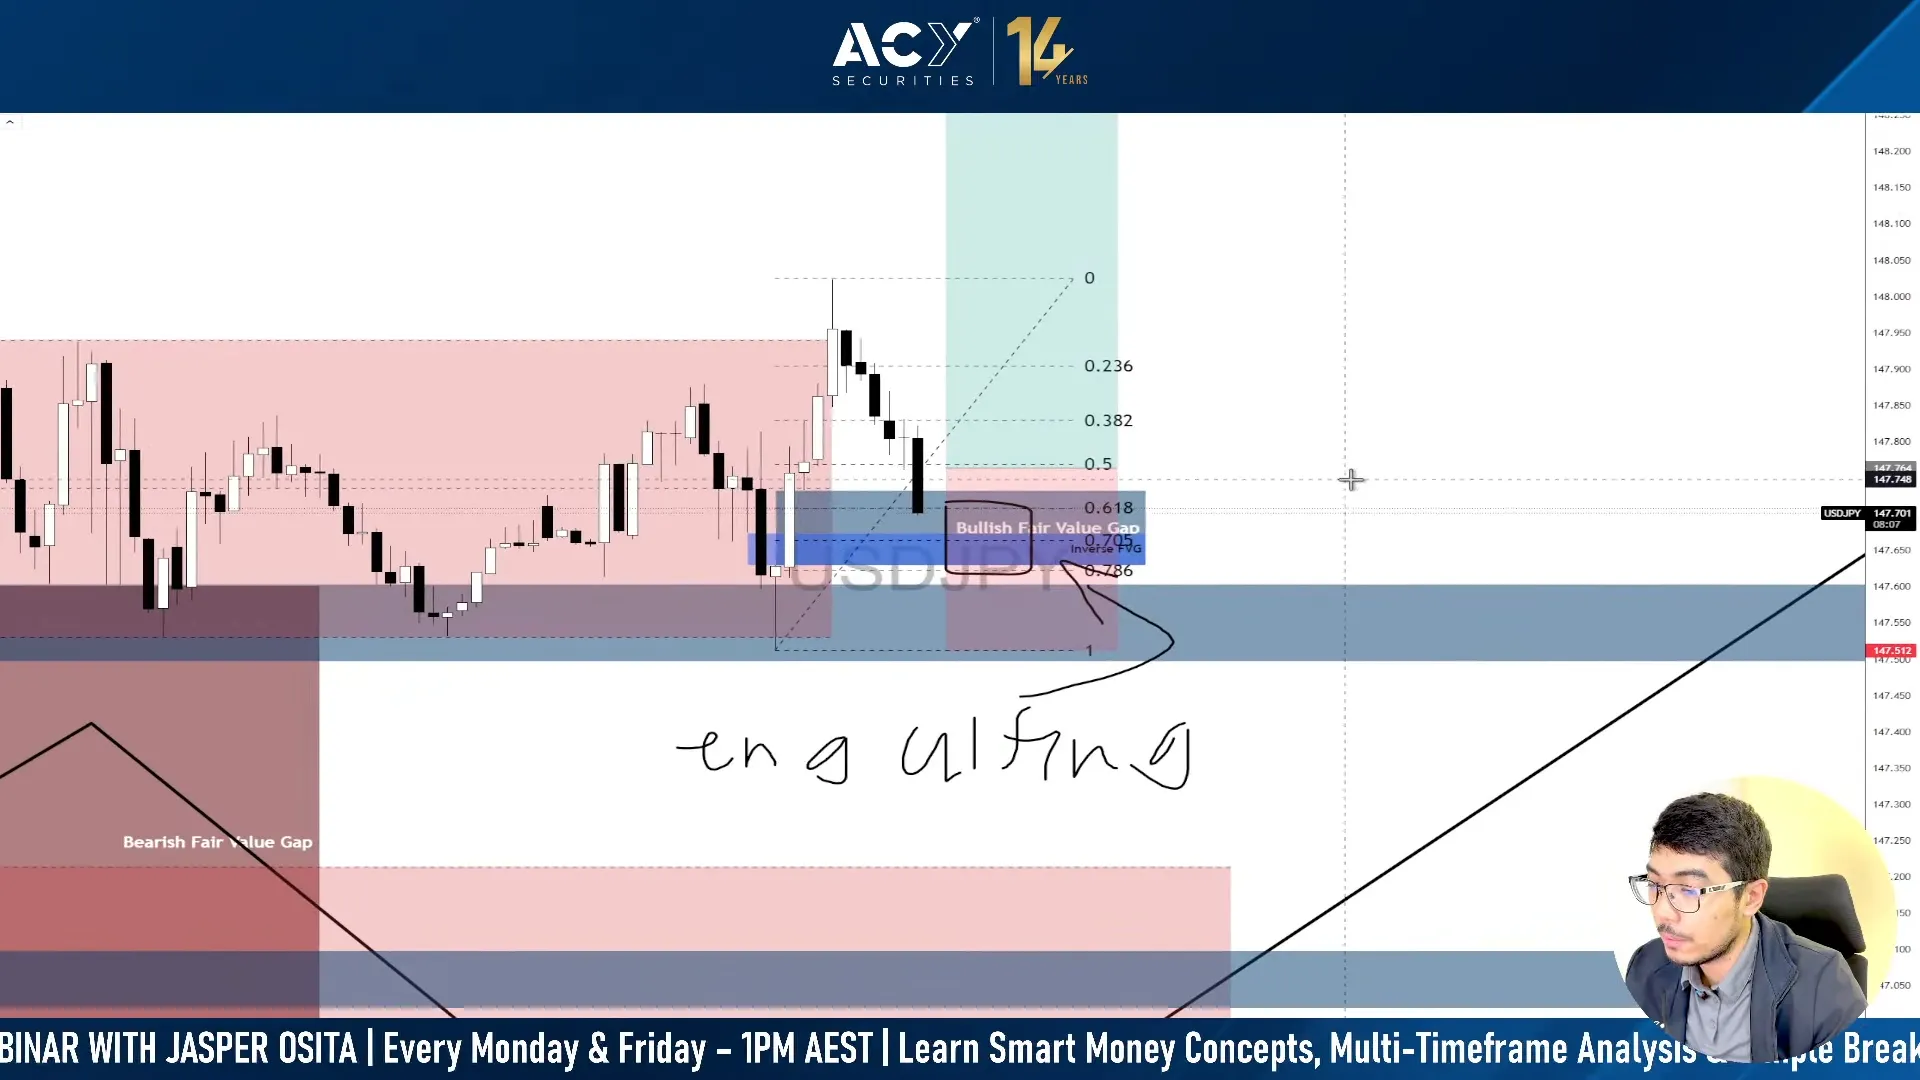
We began our analysis on the 4-hour chart, identifying a key Bullish Fair Value Gap (FVG) around the 147.50–147.60 zone. With the 4-hour timeframe providing the directional bias, we then dropped down to the 15-minute chart to refine our entry.
The plan was straightforward:
What followed was a textbook Smart Money Concepts execution:
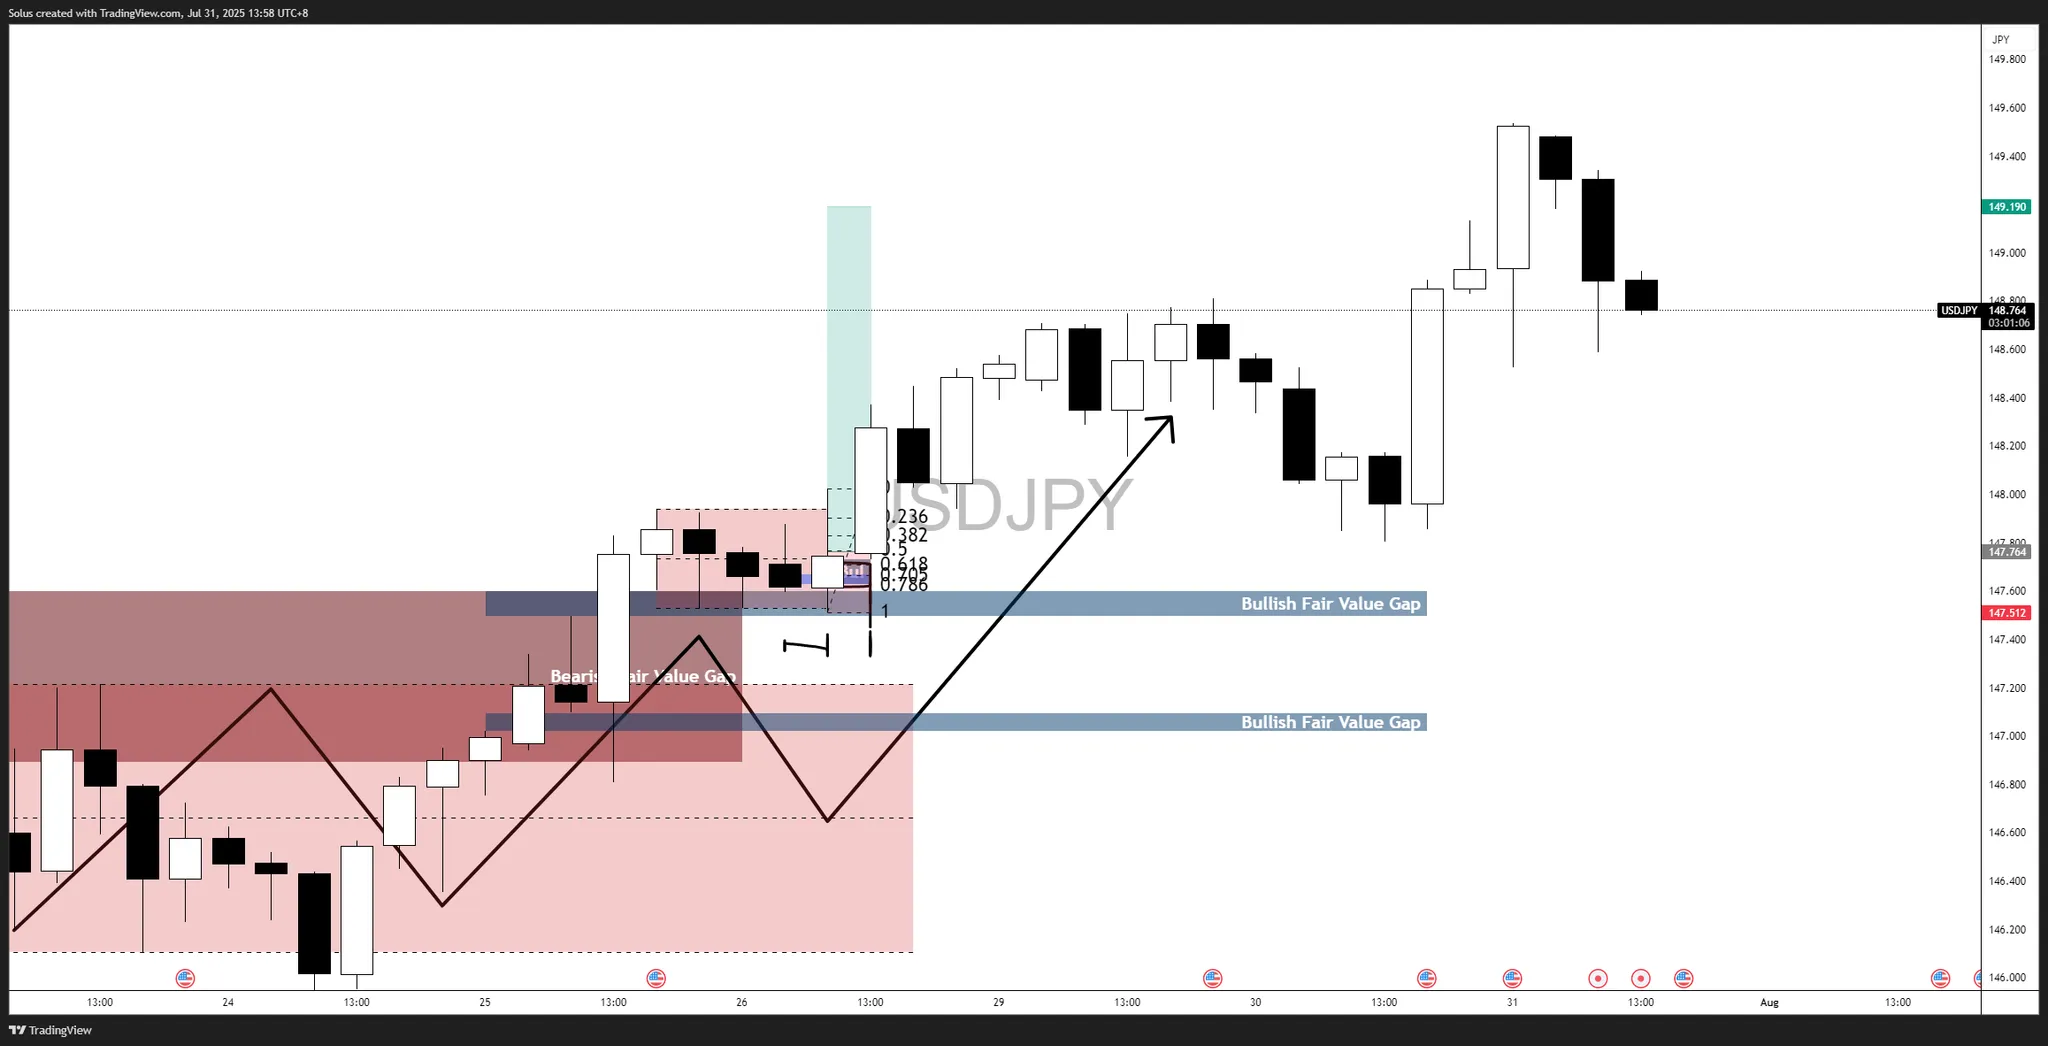
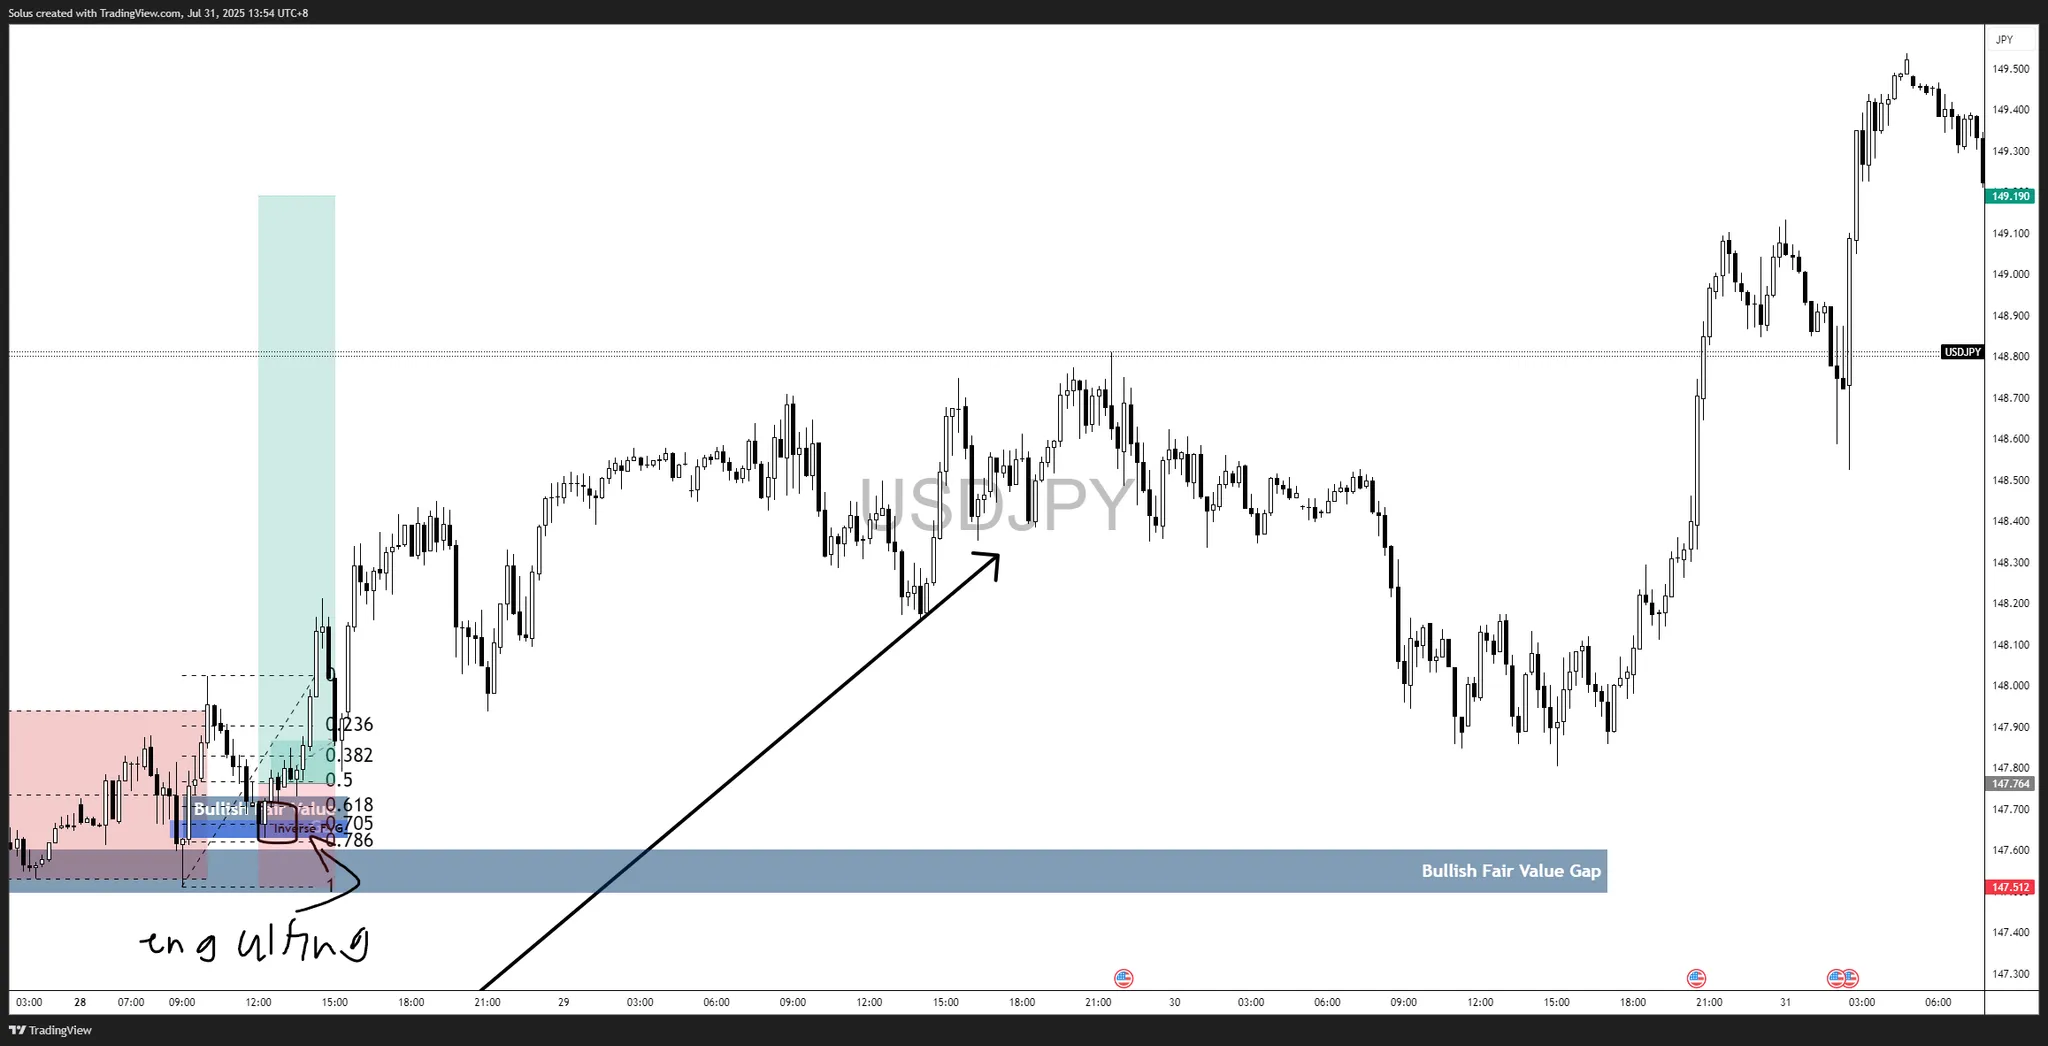
This is the power of starting with a strong anchor timeframe and only dropping lower to fine-tune the entry.
The macro backdrop added conviction to our bullish bias:
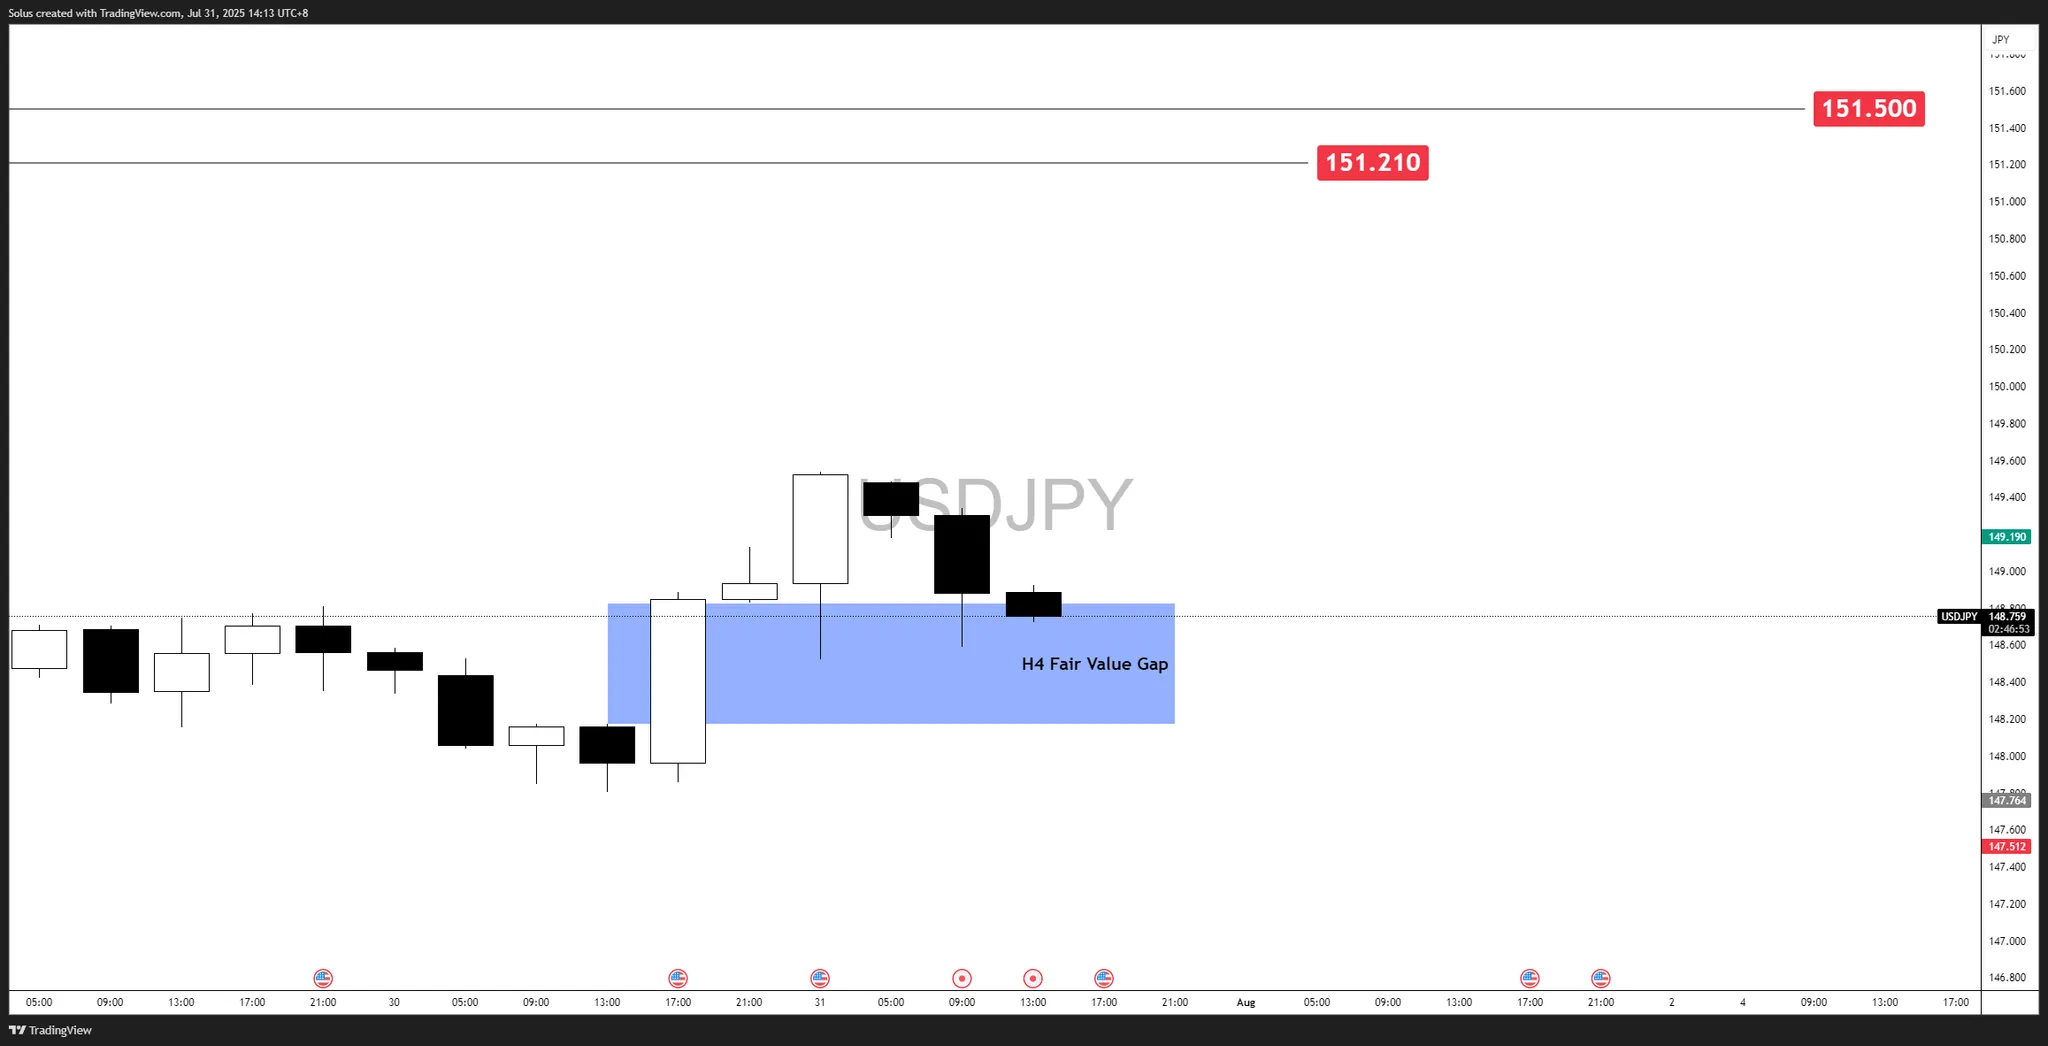
USD/JPY is currently testing the newly created 4-hour Fair Value Gap (FVG) zone at 148.173–148.828, which remains the key support area in the short term. Price has already respected this zone once, and it is now serving as a base for the next potential leg higher.
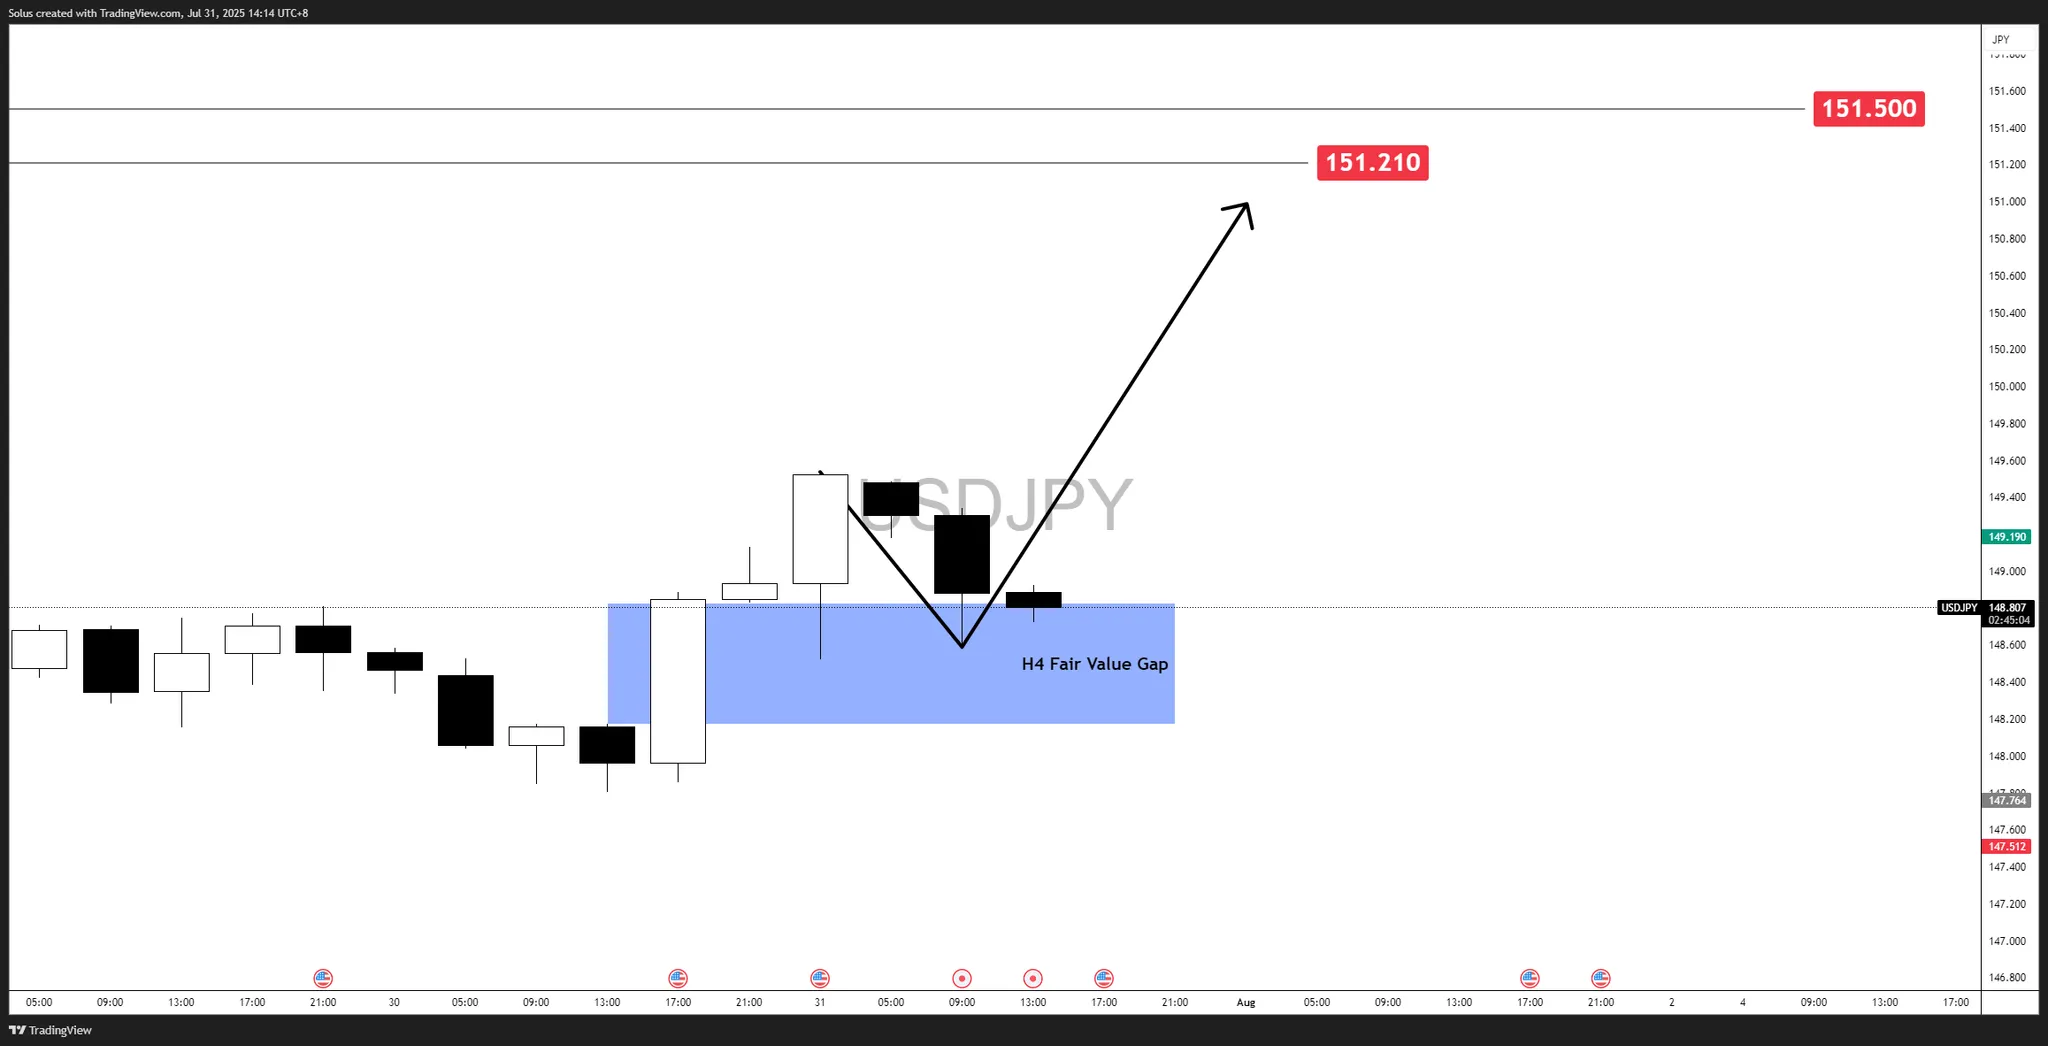
If price holds its ground at the 4-hour Fair Value Gap (FVG) zone at 148.173–148.828, and price uses this area as a launchpad for the next upward leg. This scenario aligns with the existing bullish structure and broader dollar strength.
Targets:
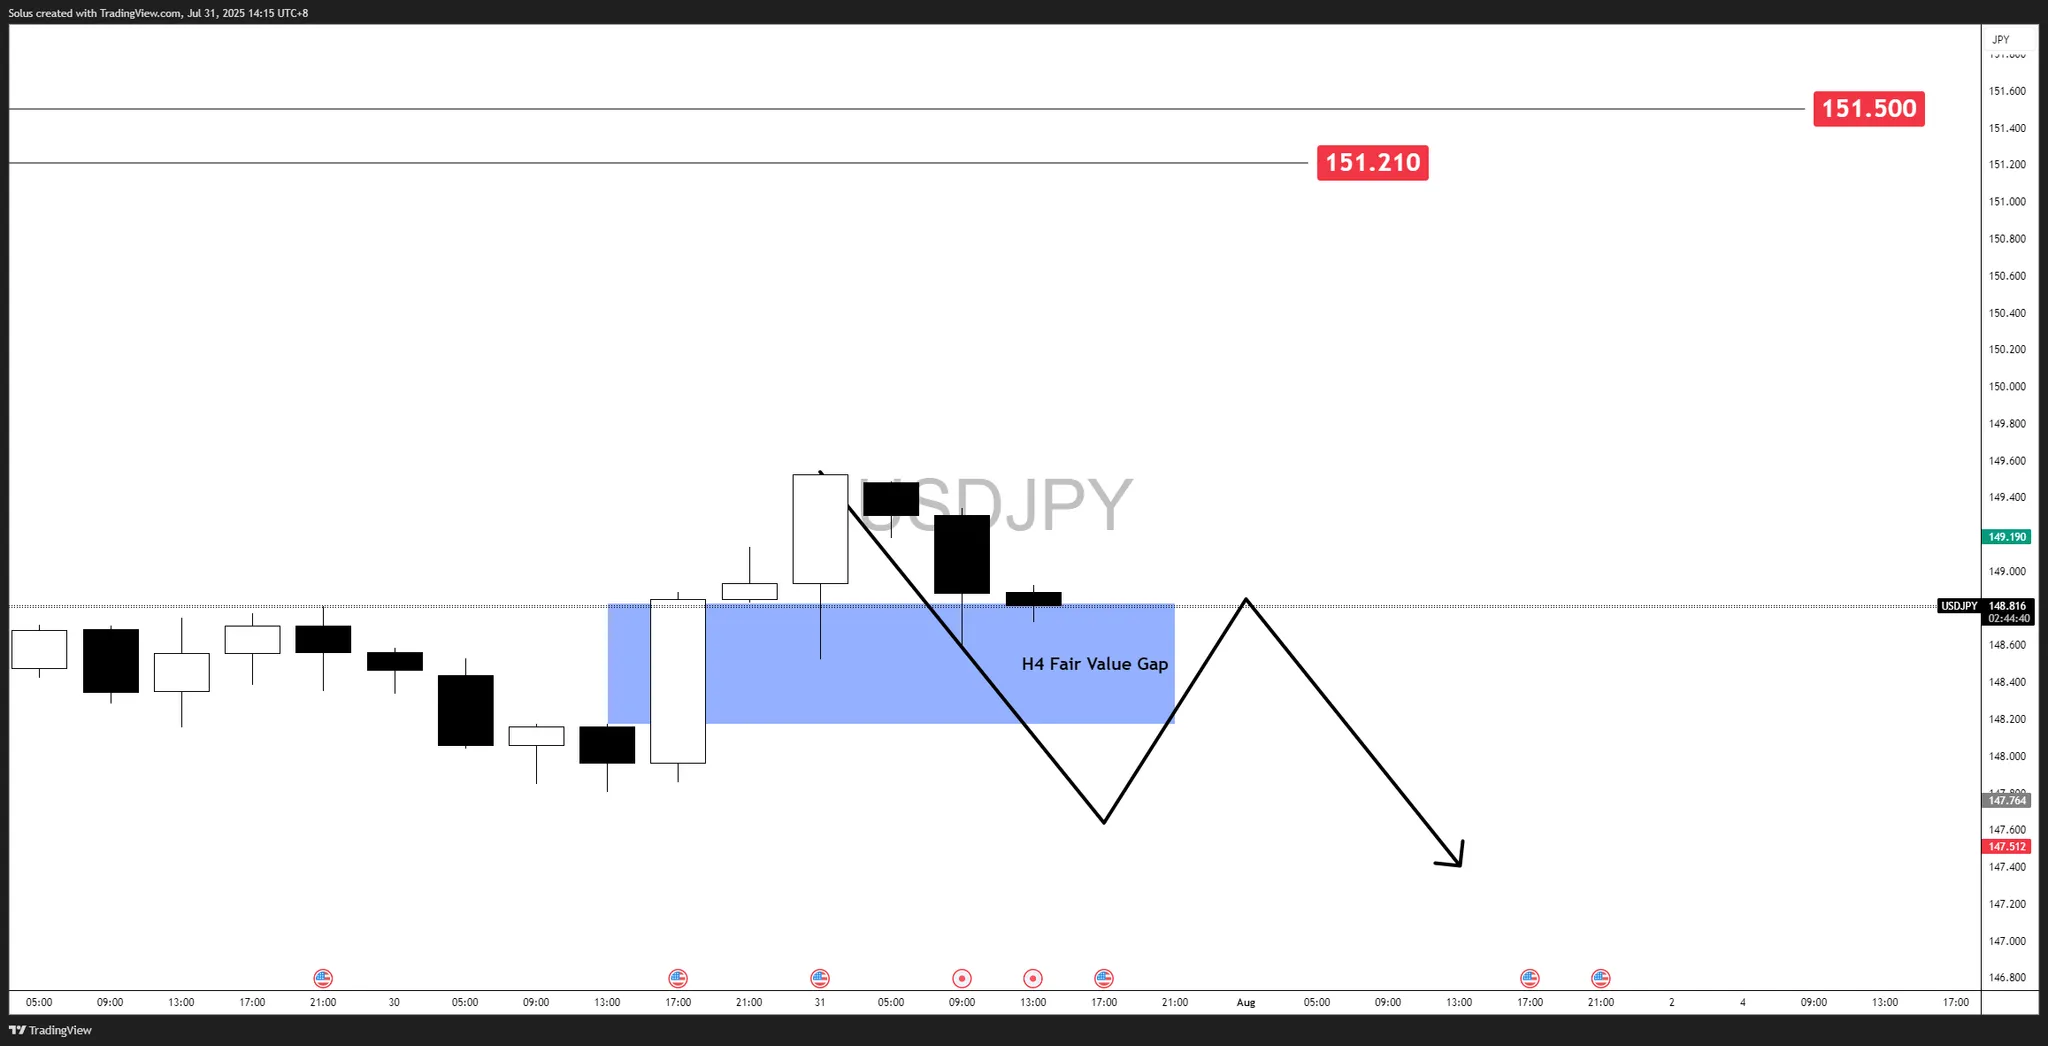
If buyers fail to hold the 4-hour FVG zone, it would signal a potential shift in short-term sentiment. Price breaking below 148.00 could trigger a deeper retracement, erasing the recent bullish momentum.
Targets:
The deciding factor for which scenario plays out on USD/JPY will ultimately come down to the U.S. dollar’s strength or weakness. With the NFP report due tomorrow, another round of volatility is possible, and traders should be prepared for sharp swings as the market reprices expectations.
To stay on the right side of the move, use the same process we followed in the recent setup:
By aligning higher timeframe structure with lower timeframe confirmation, you avoid being caught in the noise and can execute with conviction when the market shows its hand.
The decisive breakdown from a consolidation top puts the near-term bull trend in gold at risk of a deeper correction. Unless there is a relatively quick recovery it looks like gold is heading next towards the higher swing low of $3,247 from late-June. If that fails as support, the higher swing low at $3,121 becomes a potential target.
Since the initial pullback from the April record high of $3,500 completed a 38.2% Fibonacci retracement before another advance began, there is a good chance a deeper retracement may be completed in the current correction, given today’s bearish price action. A 50% retracement will be completed at $3,041 and a 61.8% Fibonacci retracement is at $2,933.
Given the clear failure of the 50-Day MA as support for today, the 200-Day MA, now at $3,000, becomes a potential downside target. Since it is rising it will eventually converge and surpass the 50% retracement area. There is also a falling ABCD pattern that has been added to the chart to help assess potential lower targets. It shows an initial downside target of $3,072, a little below the last retracement low (B) and near the 50% level. That is where the decline in price for the falling CD leg matches the decline in the first AB downswing. Once that happens, a potential pivot level is identified.
For a look at all of today’s economic events, check out our economic calendar.