The main category of Forex News.
You can use the search box below to find what you need.
[wd_asp id=1]
The main category of Forex News.
You can use the search box below to find what you need.
[wd_asp id=1]
🎯 GBP/EUR year-ahead forecast: Consensus targets from our survey of over 30 investment bank projections. 📩 Request your copy.
Image © Adobe Images
Analysts at Nomura reiterate their ‘long’ EUR/GBP trade following this week’s release of UK employment and inflation data.
The call for further pound sterling weakness follows a set of soft UK data readings that mean UK interest rates will steadily fall towards those of the Eurozone in the coming months. “There is still scope for further rate convergence between EUR and GBP,” says Dominic Bunning, strategist at Nomura.
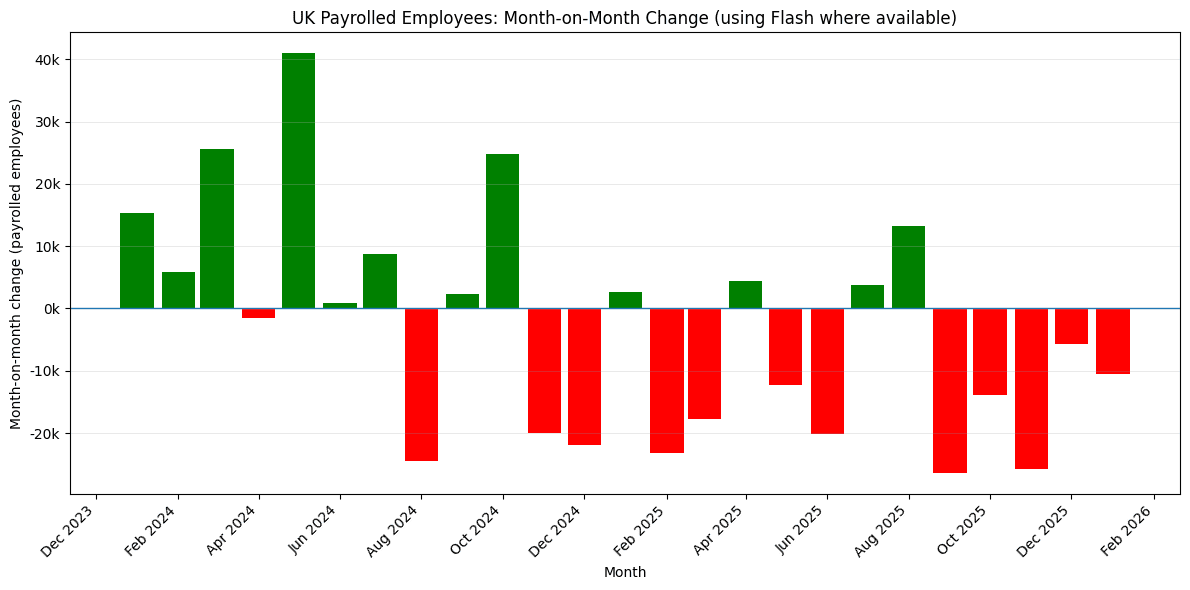
The pound to euro exchange rate is down half a per cent this week, with most of those declines following Tuesday’s news that the UK unemployment rate had risen to 5.2% in December, a five-year high.
“The UK unemployment rate has risen much further than most of its developed market peers,” says Bunning.
Find out how much you could save on your international transfer
Estimated saving compared to high street banks:
£2,500.00
Compare Rates from Leading Providers →
Free • No obligation • Takes 2 minutes
The Bank of England will lower interest rates again in March and money market pricing shows investors see another reduction by mid-year, a move that will offer the economy some support. But the European Central Bank (ECB) has ended its rate cutting cycle, meaning UK interest rates will fall closer to those in the Eurozone.
That convergence will naturally weigh on pound sterling.
Nomura’s trade to sell the pound against the euro was raised to a 5/5 conviction in January, and Wednesday’s strategy update from the bank reaffirms the stance, targeting a move in EUR/GBP to 0.8950, which gives a GBP/EUR target at 1.1170.
✳️ Secure today’s exchange rate for a future payment. You may also book an order to trigger your purchase when your ideal rate is achieved. Learn more.
The odds of an interest rate reduction in March rose to a near certainty after headline CPI inflation fell to 3.0% in January, according to an ONS report released Wednesday.
Markets see another rate cut after that – taking Bank Rate to a resting point at 3.25% – before year-end, but analysts at Peel Hunt think inflation dynamics mean a further reduction is possible, meaning markets will have to adjust expectations further, which would weigh on sterling.
Kallum Pickering, economist at Peel Hunt, says this week’s data confirms a clear downward trend in UK headline inflation towards the BoE’s 2% target.
“Looking at annualised data, which gives a better measure of current price pressures, the BoE is now undershooting its target. Given known lags with monetary policy, the clear risk now is that the bank has fallen behind the curve and will need to play catch up – skewing risks towards more than the two cuts money markets see for this year,” he explains.
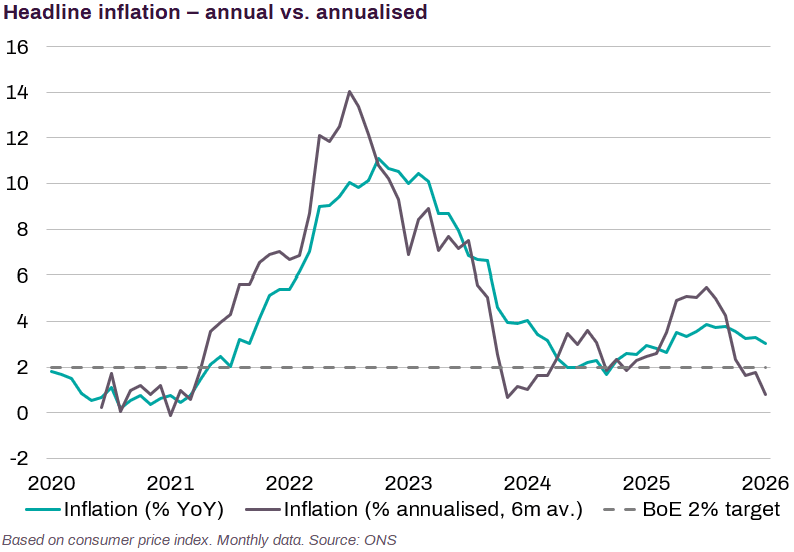
Image courtesy of Peel Hunt’s Kallum Pickering.
🎯 GBP/EUR year-ahead forecast: Consensus targets from our survey of over 30 investment bank projections. 📩 Request your copy.
However, some analysts think there’s a limit to the extent the Bank of England repricing can exert pressure on the pound.
“Our economist sees a terminal of 3.25% by June, whereas markets price that by year-end. An additional cut could be brought forward into H1, but it will be hard for BoE to ease much more than that with neutral around 3%… This puts a floor under BoE driven GBP weakness in our view,” says a new foreign exchange research note from JP Morgan.
Dig beneath the headlines of Wednesday’s inflation data and there are warning signs that the Bank of England will continue to struggle with stubborn inflation dynamics.
“It was the services sector where inflation can be stickier that continued to post above-expectations price increases,” says Lloyds Bank in a note covering the inflation release. Services inflation read at 4.4%, which is well above a level consistent with a sustained fall in inflation to the 2.0% target.
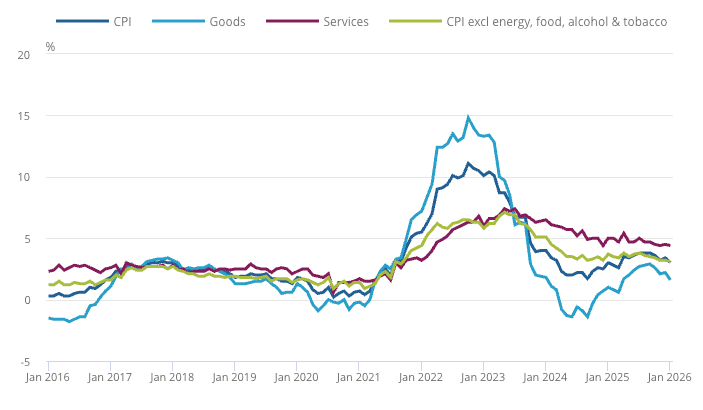
Above: Services inflation must fall further if CPI is to fall to 2.0% on a sustainable basis.
“Business surveys suggest that underlying cost pressures remain sticky, and medium-term inflation expectations are still too high for comfort,” says the IEA in their response to Wednesday’s data.
Oxford Economics raised its UK inflation forecasts following the figures, “partly due to us factoring in new regulatory price announcements over the past month, some of which have been slightly higher than anticipated.”
“Our forecast means we now see CPI inflation averaging 2.6% this year and next, up from 2.3% and 2.5% previously,” says Oxford Economics.
Such stubborn inflation would prevent the Bank of England from cutting on more than two occasions this year, limiting the extent of GBP weakness.
A new research note from Handelsbanken says UK inflation will rise again by the year-end, with persistence re-emerging as a challenge for policymakers, meaning the Bank of England is likely to keep policy relatively tight compared with several peers.
“This keeps front-end rate differentials elevated and provides cyclical support for GBP through the carry channel,” says the note.
To be sure, a number of headwinds blow against the pound, but a Bank of England hamstrung by inflation could well put a limit below the degree of weakness the currency is exposed to.
🎯 GBP/EUR year-ahead forecast: Consensus targets from our survey of over 30 investment bank projections. 📩 Request your copy.
The CHFJPY benefited by the repeated stability above the bullish channel’s support at 198.05 level, activating the bullish attack, to record several gains by reaching 200.85 attempting to settle above %50 Fibonacci correction level.
Providing bullish momentum by the main indicators will support our bullish expectation, to keep waiting for the price to reach $61.8Fibonacci correction level at 201.30, which might form an important obstacle against the bullish attempts, to push the price to provide mixed trading before breaching this barrier.
The expected trading range for today is between 199.85 and 201.30
Trend forecast: Bullish
– Written by
Frank Davies
STORY LINK GBP/USD Price Forecast: Pound Sterling Firms After Fed Minutes
The Pound US Dollar (GBP/USD) exchange rate was rangebound on Thursday morning after falling to its lowest level in roughly three weeks during the previous session.
At the time of writing, GBP/USD was trading close to $1.3486, showing minimal movement from Thursday’s opening levels.
The US Dollar traded unevenly through Thursday’s European session as investors continued analysing the minutes from the Federal Reserve’s latest policy meeting.
Initially, the publication lent support to the ‘Greenback’, revealing broad agreement among policymakers to keep interest rates unchanged while also indicating that some officials remain open to further tightening should inflationary pressures persist.
However, enthusiasm for the US currency faded as upon further reading the minutes suggested US authorities reviewed exchange rate movements earlier in the year, fuelling speculation that policymakers may be more comfortable with a softer Dollar if required to support economic conditions.
The Pound lacked clear direction as domestic political concerns continued to weigh on market sentiment.
Renewed scrutiny surrounding Prime Minister Keir Starmer followed another policy reversal regarding delays to local elections, adding to doubts about the government’s stability ahead of the upcoming Gorton and Denton by-election.
Get better rates and lower fees on your next international money transfer.
Compare TorFX with top UK banks in seconds and see how much you could save.
At the same time, expectations that the Bank of England could soon begin loosening monetary policy continued to cap Sterling demand. Recent UK employment and inflation releases have strengthened market conviction that a rate cut as soon as March remains likely.
Volatility in the Pound to US Dollar (GBP/USD) exchange rate may increase toward the end of the week with several key economic releases scheduled on both sides of the Atlantic.
Markets will closely watch the latest US GDP estimate for the final quarter of 2025, which is forecast to show growth cooling following the disruption caused by the extended government shutdown. A stronger-than-expected reading, however, could provide renewed support for the US Dollar, given the resilience previously shown by the US economy.
Meanwhile, upcoming UK PMI surveys are expected to indicate slower expansion within the services sector, while retail sales growth is also projected to weaken. Should these forecasts materialise, Sterling may face additional downside pressure heading into the weekend.

International Money Transfer? Ask our resident FX expert a money transfer question or try John’s new, free, no-obligation personal service! ,where he helps every step of the way,
ensuring you get the best exchange rates on your currency requirements.
TAGS: Pound Dollar Forecasts
Silver price (XAG/USD) extends its gains for the second successive session, trading around $78.00 per troy ounce during the Asian hours on Thursday. The precious metal Silver receives support from rising safe-haven demand amid persistent tensions between the United States (US) and Iran.
US-Iran talks remain unresolved, with Tehran citing a “general agreement” on the framework of a potential nuclear deal with US officials. Vice President JD Vance said Iran failed to meet US red lines, while President Donald Trump reiterated that military action remains an option. Reports indicate any US strike could turn into a prolonged campaign, with Israel advocating regime change in the Islamic Republic.
Meanwhile, Ukraine and Russia ended two days of peace talks in Geneva without progress. President Volodymyr Zelenskiy accused Moscow of stalling US-led efforts to end the four-year conflict. Trump has repeatedly pressed Ukraine to accept a deal that may involve significant concessions, as Russian forces continue striking energy infrastructure and advancing on the battlefield.
However, gains in dollar-denominated Silver may be capped as the US Dollar (USD) stays firm amid hawkish signals from the Federal Reserve (Fed). A stronger Greenback often reflects higher US yields, increasing the opportunity cost of holding non-yielding assets like Silver. The grey metal also becomes more expensive for holders of other currencies, reducing global demand.
Federal Open Market Committee (FOMC) Minutes from the January meeting revived speculation about potential rate hikes if inflation remains elevated. While most policymakers supported keeping rates unchanged, only a few favored a cut, and officials indicated they could ease policy if inflation moderates as expected. Traders modestly pared Fed rate cut bets but still expect two 25 basis points reductions before year-end.
Silver is a precious metal highly traded among investors. It has been historically used as a store of value and a medium of exchange. Although less popular than Gold, traders may turn to Silver to diversify their investment portfolio, for its intrinsic value or as a potential hedge during high-inflation periods. Investors can buy physical Silver, in coins or in bars, or trade it through vehicles such as Exchange Traded Funds, which track its price on international markets.
Silver prices can move due to a wide range of factors. Geopolitical instability or fears of a deep recession can make Silver price escalate due to its safe-haven status, although to a lesser extent than Gold’s. As a yieldless asset, Silver tends to rise with lower interest rates. Its moves also depend on how the US Dollar (USD) behaves as the asset is priced in dollars (XAG/USD). A strong Dollar tends to keep the price of Silver at bay, whereas a weaker Dollar is likely to propel prices up. Other factors such as investment demand, mining supply – Silver is much more abundant than Gold – and recycling rates can also affect prices.
Silver is widely used in industry, particularly in sectors such as electronics or solar energy, as it has one of the highest electric conductivity of all metals – more than Copper and Gold. A surge in demand can increase prices, while a decline tends to lower them. Dynamics in the US, Chinese and Indian economies can also contribute to price swings: for the US and particularly China, their big industrial sectors use Silver in various processes; in India, consumers’ demand for the precious metal for jewellery also plays a key role in setting prices.
Silver prices tend to follow Gold’s moves. When Gold prices rise, Silver typically follows suit, as their status as safe-haven assets is similar. The Gold/Silver ratio, which shows the number of ounces of Silver needed to equal the value of one ounce of Gold, may help to determine the relative valuation between both metals. Some investors may consider a high ratio as an indicator that Silver is undervalued, or Gold is overvalued. On the contrary, a low ratio might suggest that Gold is undervalued relative to Silver.
Important DisclaimersFXEmpire is owned and operated by Empire Media Network LTD., Company Registration Number 514641786, registered at 7 Jabotinsky Road, Ramat Gan 5252007, Israel. The content provided on this website includes general news and publications, our personal analysis and opinions, and materials provided by third parties. This content is intended for educational and research purposes only. It does not constitute, and should not be interpreted as, a recommendation or advice to take any action, including making any investment or purchasing any product. Before making any financial decision, you should conduct your own due diligence, exercise your own discretion, and consult with competent advisors. The content on this website is not personally directed to you, and we do not take into account your individual financial situation or needs. The information contained on this website is not necessarily provided in real time, nor is it guaranteed to be accurate. Prices displayed may be provided by market makers and not by exchanges. Any trading or other financial decision you make is entirely your own responsibility, and you must not rely solely on any information provided through the website. FXEmpire does not provide any warranty regarding the accuracy, completeness, or reliability of any information contained on the website and shall bear no responsibility for any trading losses you may incur as a result of using such information. The website may include advertisements and other promotional content. FXEmpire may receive compensation from third parties in connection with such content. FXEmpire does not endorse, recommend, or assume responsibility for the use of any third-party services or websites. Empire Media Network LTD., its employees, officers, subsidiaries, and affiliates shall not be liable for any loss or damage resulting from your use of the website or reliance on the information provided herein.Risk DisclaimersThis website contains information about cryptocurrencies, contracts for difference (CFDs), and other financial instruments, as well as about brokers, exchanges, and other entities trading in such instruments. Both cryptocurrencies and CFDs are complex instruments and involve a high risk of losing money. You should carefully consider whether you understand how these instruments work and whether you can afford to take the high risk of losing your money. FX Empire encourages you to conduct your own research before making any investment decision and to avoid investing in any financial instrument unless you fully understand how it works and the risks involved.
Despite forming bullish wave by copper price and its stability near $5/7500, but it couldn’t confirm its readiness to activate the bullish attack, due to the continuation of the main indicators’ contradiction, besides the stability of the price below $5.9700 barrier.
Providing mixed trading when gathering extra negative momentum will make reach $5.5100 support, forming confirmation key for the main trend in upcoming trading, breaking this support will force it to resume the corrective decline, to expect reaching $5.3600 followed by $5.1000.
The expected trading range for today is between $5.5500 and $5.8500
Trend forecast: Bearish
The Euro fell during trading on Wednesday, as we continue to ask questions about the overall strength or weakness of the US dollar.
The Euro fell during trading on Wednesday as it looks like we are threatening the 1.18 level. The 1.18 level of course is a large round psychologically significant figure that a lot of people will be watching. I recognize this as a market that potentially will be testing the 50-day EMA and it’s worth watching what the US dollar is doing in general as it has a major influence here.
After all, this is one of the most heavily traded forex pairs that you have available to you and therefore this has a lot of weight on the US Dollar Index and in general the overall risk appetite around the world. What I am seeing during the session is a flood of money coming into the United States again and that of course drives down the Euro because Europeans are buying US stocks.
If we break down below the 50-day EMA, that could send the market down to the 1.16 level and possibly even the 200-day EMA. On a break to the upside, if we can break above the 1.19 level it opens up the 1.21 level and perhaps, if we get a little bit of momentum building there, then the potential measured move of the previous consolidation which could send this pair to the 1.23 level.
The 1.23 level has been important multiple times in the past and I think it will be very difficult to break above. Nonetheless, the dollar short positioning is at a 14-year high and generally speaking, when you get that extreme, the dollar fights back. That might be what we’re starting to see here and if we break down below the 50-day EMA, you can even make an argument that we just made a lower high, which of course is a bearish sign.

Ready to trade our daily Forex analysis? We’ve made this forex brokers list for you to check out.
Christopher Lewis has been trading Forex and has over 20 years experience in financial markets. Chris has been a regular contributor to Daily Forex since the early days of the site. He writes about Forex for several online publications, including FX Empire, Investing.com, and his own site, aptly named The Trader Guy. Chris favours technical analysis methods to identify his trades and likes to trade equity indices and commodities as well as Forex. He favours a longer-term trading style, and his trades often last for days or weeks.
Gold struggles below $5,000 in Thursday’s Asian trades as buyers take a breather after the 2% rally on Wednesday.
Gold stood tall on Wednesday, despite the solid recovery in the US Dollar (USD) and US Treasury bond yields, fuelled by somewhat hawkish Minutes of the US Federal Reserve’s (Fed) January monetary policy meeting.
The Minutes suggested that the Fed remains in no rush to cut interest rates, with several policymakers open to rate hikes if inflation remains elevated, others inclined to support further cuts if inflation recedes.
However, the markets’ pricing for three 25 basis points (bps) Fed rate cuts this year remained intact, which seems to have supported the non-yielding Gold.
The main catalyst behind Gold’s upswing was the return of haven demand due to renewed geopolitical tensions. Two days of peace talks in Geneva between Ukraine and Russia ended without a breakthrough. Ukraine’s President Volodymyr Zelenskiy said he was dissatisfied with the outcome.
Meanwhile, CBS News reported, citing sources familiar with internal discussions, a potential US military strike on Iran could come as early as Saturday.
This comes after Iran’s Foreign Minister Abbas Araqchi said on Tuesday that Tehran has agreed with the US ‘on guiding principles’ for the deal, following their Geneva talks.
Against this backdrop, Gold seems to continue its recent upside but the US Dollar could have an upper hand heading toward Friday’s US PCE inflation and Gross Domestic Product (GDP) data.
The Greenback also draws support from the latest data released by the US Treasury Department, which showed a net inflow of $44.9 billion in Treasury International Capital (TIC) for December 2025. The data increased foreign appetite for US assets.
Next of note for Gold traders remains the US Jobless Claims, Pending Home Sales data and Fedspeak scheduled later in the North American session on Thursday.
The 21-day Simple Moving Average (SMA) rises above the 50-, 100- and 200-day SMAs, preserving a bullish alignment. Price holds below the 21-day SMA at $5,001.04 but remains above the 50-day SMA at $4,688.83 and the longer baselines, keeping the broader bias upward. The Relative Strength Index (14) sits at 53 (neutral), reflecting steady momentum. Measured from the $5,597.89 high to the $4,401.99 low, the 50% retracement at $4,999.94 acts as immediate resistance.
A daily close above $4,999.94 would expose the 61.8% retracement at $5,141.05, where recovery attempts could stall. Failure to reclaim the 21-day SMA would leave the rebound vulnerable, bringing the 38.2% retracement at $4,858.82 into view, while the rising 100-day SMA at $4,393.61 underpins the medium-term trend.
(The technical analysis of this story was written with the help of an AI tool.)
Gold has played a key role in human’s history as it has been widely used as a store of value and medium of exchange. Currently, apart from its shine and usage for jewelry, the precious metal is widely seen as a safe-haven asset, meaning that it is considered a good investment during turbulent times. Gold is also widely seen as a hedge against inflation and against depreciating currencies as it doesn’t rely on any specific issuer or government.
Central banks are the biggest Gold holders. In their aim to support their currencies in turbulent times, central banks tend to diversify their reserves and buy Gold to improve the perceived strength of the economy and the currency. High Gold reserves can be a source of trust for a country’s solvency. Central banks added 1,136 tonnes of Gold worth around $70 billion to their reserves in 2022, according to data from the World Gold Council. This is the highest yearly purchase since records began. Central banks from emerging economies such as China, India and Turkey are quickly increasing their Gold reserves.
Gold has an inverse correlation with the US Dollar and US Treasuries, which are both major reserve and safe-haven assets. When the Dollar depreciates, Gold tends to rise, enabling investors and central banks to diversify their assets in turbulent times. Gold is also inversely correlated with risk assets. A rally in the stock market tends to weaken Gold price, while sell-offs in riskier markets tend to favor the precious metal.
The price can move due to a wide range of factors. Geopolitical instability or fears of a deep recession can quickly make Gold price escalate due to its safe-haven status. As a yield-less asset, Gold tends to rise with lower interest rates, while higher cost of money usually weighs down on the yellow metal. Still, most moves depend on how the US Dollar (USD) behaves as the asset is priced in dollars (XAU/USD). A strong Dollar tends to keep the price of Gold controlled, whereas a weaker Dollar is likely to push Gold prices up.
The GBPJPY pair ended the negative movement by reaching 207.60 level, to begin activating with stochastic positivity to rally towards 209.30 directly, to press on the barrier to find an exit to end the negative scenario in the current trading.
Note that providing positive close for the upcoming four hours above 209.15 level is important to confirm its readiness to begin bullish attack, to expect targeting 210.65 level initially, to extend the trading towards 211.70, while the failure to breach it will force the price to form new bearish waves to reach 208.25
The expected trading range for today is between 209.00 and 210.65
Trend forecast: Bullish
The CHFJPY benefited by the repeated stability above the bullish channel’s support at 198.05 level, activating the bullish attack, to record several gains by reaching 200.85 attempting to settle above %50 Fibonacci correction level.
Providing bullish momentum by the main indicators will support our bullish expectation, to keep waiting for the price to reach $61.8Fibonacci correction level at 201.30, which might form an important obstacle against the bullish attempts, to push the price to provide mixed trading before breaching this barrier.
The expected trading range for today is between 199.85 and 201.30
Trend forecast: Bullish


