The main category of Forex News.
You can use the search box below to find what you need.
[wd_asp id=1]
The main category of Forex News.
You can use the search box below to find what you need.
[wd_asp id=1]
The EURJPY pair didn’t settle above the bullish channel’s resistance at 171.85, due to its neediness to the positive momentum, which forces it to form a temporary rebound by targeting 171.20 level, then begin forming sideways trading attempting to gather the required positive momentum.
To recommend waiting for confirming breaching the current resistance, to reinforce the chances for forming a new bullish attack, to target the positive stations near 172.85 and 173.45, while the breach failure might force it to form a new correctional rebound, to suffer some losses by reaching 170.45 and 169.65.
The expected trading range for today is between 171.20 and 172.85
Trend forecast: Bullish

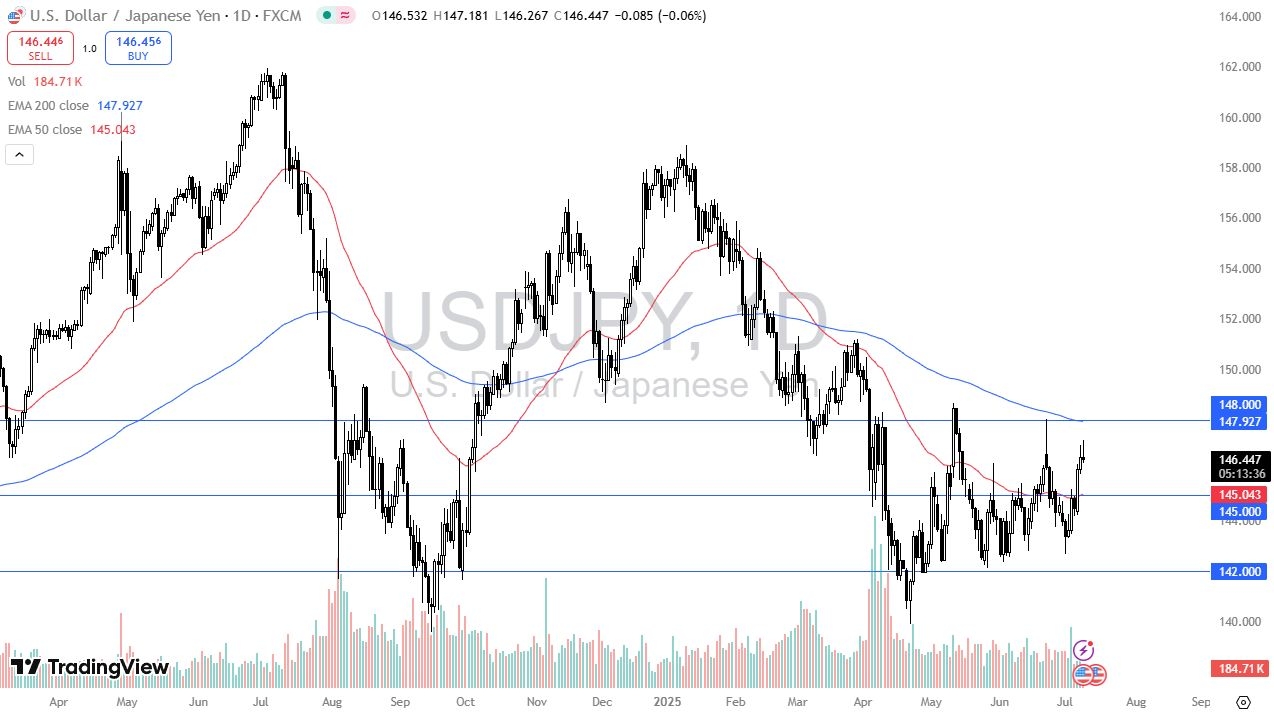
I believe that the interest rate differential will eventually propel the US dollar higher against Japanese yen, especially considering the fact that the Japanese bond market is a bit of a disaster at the moment. The Bank of Japan may have to step in and start buying bonds, which is essentially the same thing as quantitative easing, so that could really play havoc on the Japanese yen. That being said, they have not done it yet, so there is a little bit of hesitation and there are a lot of questions asked of whether or not they would actually do it. Or, you also have to keep in mind that we are in a downtrend to get this is area, and typically speaking, consolidation leads to continuation. However, the fundamentals don’t necessarily scream that we should be selling off.
When we do pull back, I’ll be looking for buying opportunities underneath current levels, such as the ¥145 region, followed by the ¥142 region. Ultimately, I think it’s only a matter of time before we see value hunters coming back into the market, but if we were to break above the ¥148 level, then we snap through the 200 Day EMA, which of course would be very bullish to say the least. If that were to happen, then I would anticipate that we have a longer-term “buy-and-hold” type of market. Ultimately, I think we do see a lot of volatility, but I’ll be looking to buy the dip here as we should continue to go back and forth in this range in the short term, before finally breaking out and making a bigger move.
Want to trade our USD/JPY forex analysis and predictions? Here’s a list of forex brokers in Japan to check out.
Christopher Lewis has been trading Forex and has over 20 years experience in financial markets. Chris has been a regular contributor to Daily Forex since the early days of the site. He writes about Forex for several online publications, including FX Empire, Investing.com, and his own site, aptly named The Trader Guy. Chris favours technical analysis methods to identify his trades and likes to trade equity indices and commodities as well as Forex. He favours a longer-term trading style, and his trades often last for days or weeks.
Platinum price attempted to face the negative pressures by providing repeated positive closes above 2.00%Fibonacci extended level at $1330.00 level, forming extra support against the bearish correctional attempts.
The stability of the extra support, we will begin preferring the bullish attempts that targets $1375.00, then attempt to press on the barrier near $1420.00, while breaking the current support will force it to suffer extra losses that might extend to $1315.00 and $1301,00.
The expected trading range for today is between $1330.00 and $1375.00
Trend forecast: Bullish
The EUR/GBP rate is influenced primarily by central bank policies, economic data, political stability, and external market trends. Understanding these factors can help traders anticipate potential movements in the pair.
Monetary policy decisions by the Bank of England (BoE) and the European Central Bank (ECB) can significantly affect EUR/GBP movements. If the ECB signals a more hawkish stance or tightens policy relative to the BoE, capital flows may favour euro-denominated assets, potentially strengthening the euro against the pound.
Conversely, if UK rates are higher, sterling may find support as investors seek greater returns. Traders closely monitor GDP growth, CPI inflation, employment data, purchasing managers’ indices (PMIs), and wage growth, as these indicators influence central bank actions and market expectations.
Economic indicators such as GDP growth rates, inflation figures (CPI), and trade balances directly affect EUR/GBP. Stronger-than-expected eurozone data can enhance the appeal of the euro, while resilient UK data may support the pound.
For instance, if eurozone growth or inflation outpaces expectations, markets may anticipate tighter ECB policy, underpinning the euro and pushing EUR/GBP higher. Similarly, positive surprises in UK data could lend support to sterling, resulting in a lower EUR/GBP rate.
Government policies and political stability indirectly influence EUR/GBP. Pro-business policies, trade agreements, and stable governance typically increase currency confidence. Political uncertainty or abrupt policy shifts, however, can trigger volatility. The UK has signed trade agreements with several major economies in recent years, though a comprehensive deal with the US has not yet been concluded.
Ongoing discussions and agreements with the eurozone and India have contributed to market sentiment, but traders remain vigilant to political developments.
Stock market performance and global risk sentiment also influence EUR/GBP exchange rates. In periods of market optimism, investors may favour higher-yielding or riskier assets, which could benefit the pound if UK assets are attractive.
In contrast, during bouts of risk aversion, flows may move into perceived safe havens such as the US dollar or Swiss franc, though the euro can also benefit given the size and relative stability of the eurozone. Commodity market swings may have an indirect effect on the pair, particularly where they impact risk sentiment or sectors tied to the UK or eurozone economies.
Learn more in our forex CFD trading guide.
Nonetheless, the behavior of crude oil the past couple of days shows demand remains strong. Yesterday, crude oil pulled back to find support at the 200-Day MA and bounced. Notice that the 200-Day MA was shown as resistance on two days last week. Once it is successfully tested as support the rising trend may be ready to proceed. Buyers took back control today, as a higher daily low was established and today’s closing price looks likely to be in the top third of the day’s trading range. Moreover, crude oil looks set to end Tuesday’s session at its highest daily closing price since the beginning of February.
Strength was also shown during the rally on a bullish reversal signal that triggered above the lower swing high at $72.49 last Friday. The breakout was confirmed by a daily close above that level on Friday. Today’s closing price above that level will further confirm strength. In addition, a solid top downtrend line was broken over the past few days.
That breakout will likely be confirmed by today’s closing price above that level. What this shows is that demand for crude oil remains strong. Therefore, a breakout above last week’s high of $76.29 could occur before a deeper pullback. If it does, the lower swing high at $80.76 marks the next upside target.
The 200-Day MA remains key near-term support crude oil. If prices stay above that line, the potential for a new high breakout remains. So far, the pattern that has developed is a double inside day. This shows diminishing volatility as the trend takes a rest and gains are digested. Typically, similar patterns can lead to a bullish continuation signal. However, given the wide trading ranges of the past few days, a breakout above the $76.29 high could see another spike in volatility.
For a look at all of today’s economic events, check out our economic calendar.
An attempt to test support around the lower boundary line of the pennant occurred today. But the day’s low didn’t quite reach it. If the pennant boundaries are maintained, then a rally from the lower area of the pennant could lead to an upside breakout of the pattern. Given the structure of the pennant, an upside breakout could trigger on the next rally, or resistance is seen and followed by a pullback first. A breakout above Tuesday’s high of $3,346 would put natural gas back above the 20-Day MA, as well as the 50-Day line. But a bullish reversal will not be indicated until there is a rise above the recent lower swing high at $3,366.
Although an initial pennant breakout signal will occur on a rally above the top boundary line, the recent swing high of $3,451 should provide a more reliable price level as a swing high will be broken. Gold has been consolidating for several months near the highs of the long-term uptrend. Consolidation has occurred in a relatively bullish position, primarily retaining support above the 38.2% Fibonacci retracement level.
Notice that the pullback low of the pennant at $2,121 in May found support around the 38.2% level, along with the 50-Day MA. And it has not been approached again since then. This shows underlying buying strength being maintained, along with a bullish trend structure.
Regardless of the potential for an eventual upside pennant breakout, a drop below last week’s swing low of $3,243 will show weaking and a breakdown of the pennant. That would put gold in a position to retest support around the 38.2% retracement and possibly fall through it to the 50% retracement level at $3,041, if not lower.
For a look at all of today’s economic events, check out our economic calendar.
July 9, 2025 – Written by James Fuller
STORY LINK Pound to US Dollar Forecast: GBP/USD Faces Critical Tests Ahead
The Pound to Dollar exchange rate (GBP/USD) dipped to 2-week lows at 1.3530 on Tuesday before recovering ground, but failed to hold above 1.3600 and traded just below this level.
Sustained losses below 1.3550 would trigger fresh speculation that the Pound has peaked.
According to UoB; “Downward momentum continues to build, albeit not by much. That said, the likelihood of GBP dropping to 1.3510 is increasing. Overall, only a breach of 1.3680 (‘strong resistance’ level was at 1.3700 yesterday) would indicate that the current downward bias has faded.”
Scotiabank remains bullish on the GBP/USD outlook, but uneasy over recent moves; “we look to a near-term range defined by 1.3550 support and 1.3650 resistance.”
Longer-term Bank of America is still forecasting GBP/USD will strengthen to 1.41 at the end of 2025.
Markets remain wary over the UK fiscal position. Confidence in the UK bond market remains fragile with the 10-year yield trading above 4.60% which will maintain upward pressure on debt-servicing costs.
If global bond yields continue to increase, there will be further upward pressure on UK debt-servicing with the risk of further bond selling and a doom loop.

According to ING; “We find it difficult to find factors that would bring a halt to the strong upward momentum in 30Y global rates from a structural perspective. The fiscal concerns are broad-based, with also the US and UK worrying investors.”
Scotiabank added; “market participants remain concerned about domestic political developments and ongoing uncertainty related to the fiscal outlook as UK yields hit fresh highs.”
Global turbulence sparked by US tariff policies would pose further risks.
In its latest Financial Stability Report (FSR) the Bank of England warned over damage from global trade wars.
Bank of England Governor Bailey commented; “There has been a notable change in the usual correlation patterns between the dollar and other US assets, including equities and government bond yields.”
He added; “And given these developments, the risk of sharp falls in risky asset prices, abrupt shifts in asset allocation and a more prolonged breakdown in historical correlations remains high, and vulnerabilities in market-based finance could amplify such moves which could impact the availability and cost of credit here in the UK.”
Federal Reserve policy will be a key element, especially with President Trump intensifying his attacks on Chair Powell and calling for his immediate resignation.

At this stage, markets see only around a 5% chance that rates will be cut this month with the chances of a September cut declining to around 65%.
Market pricing could change sharply if political pressure on the Fed escalates and Trump nominates a very dovish candidate to replace Powell.
Standard Chartered did note that any controversial nominations could face a tough Congressional battle; “Any future board nominee has to get through the Senate Finance Committee where Republicans have a one-vote majority.”
It added; “Thom Tillis, a conservative Republican senator on the committee, voted against the fiscal package and will not be running for re-election in 2026. He is unlikely to give a pass to a candidate he considers unqualified.”
MUFG noted that the Fed debate has been damaging; “These developments are all factors that have been undermining investor confidence over recent months.”
The bank does consider that a considerable amount of dollar negatives have now been priced in; “It’s why we are forecasting a far more modest dollar decline in H2 (-2%) than the 10.7% drop in H1.”
International Money Transfer? Ask our resident FX expert a money transfer question or try John’s new, free, no-obligation personal service! ,where he helps every step of the way,
ensuring you get the best exchange rates on your currency requirements.
TAGS: Pound Dollar Forecasts
Today’s low was close to hitting the 78.6% level and it may have been close enough to consider it reached. However, given the drop below the trend line and deeper decline below the 200-Day MA, now at $3.42, the $3.10 swing low is at risk of being broken. That would trigger another bearish reversal signal. As noted previously, there is a lower target for natural gas, around $2.97 to $2.95.
That zone consists of an initial target for a falling ABCD pattern (purple) and an AVWAP level measured from the 2024 trend low, respectively. Notice that natural gas reversed from support around the AVWAP line twice previously, once in April and in October 2024.
Despite the potential for the $2.97 price area being reached, there is also a long-term uptrend line (purple) that touches an August 2024 swing low at $1.88. Since it is a long-term line it should show signs of support, if approached. The uptrend line is currently a little below the $2.95 AVWAP line but will match that level by the end of July. Keep in mind that trendline signals should be confirmed by other technical signals as there can be more than one placement for the line.
An assessment of previous bearish corrections since the January swing high shows a 31.6% decline from the January swing high and a 32.8% decline from the March 31 lower swing high. Note that the March downswing was the second leg down from the $4.90 trend high. So, the full bearish correction was larger with a 41.7% decline in a relatively short period. A 32.8% drop for the current downswing will complete around $2.79.
For a look at all of today’s economic events, check out our economic calendar.
July 9, 2025 – Written by Tim Boyer
STORY LINK Euro to Dollar Forecast: Fed Changes to Drive EUR/USD Gains Above 1.20
The Euro to Dollar exchange rate (EUR/USD) dipped to 10-day lows just below 1.1700 on Tuesday before trading just above this level.
Tariff developments will remain a key short-term focus while the issue of Federal Reserve personnel and independence could have huge dollar implications.
UoB sees a significant shift; “The EUR strength from late last month has ended. While there has been no significant increase in downward momentum, the current pullback in EUR could extend to 1.1660.”
On a medium-term view, Danske Bank expects Fed changes will contribute to EUR/USD gains to above 1.20.
The US and EU are continuing trade negotiations with an element of confidence that some form of framework deal will be agreed over the next few days.
The agricultural sector will inevitably be a very contentious element and could trigger a breakdown in negotiations with the US imposing a tariff level.
There would be mixed market implications with damage to the US and Euro-Zone economies.
According to ING; “Tariffs on the EU would mark an important escalation that can also harm the dollar, offsetting the hit on the euro. Anyway, the market’s baseline will probably remain that a EU-US deal should be agreed by the 1 August deadline, and EUR/USD may not drift far from the 1.16-1.18 area unless US data surprise in either direction.”
Uncertainty will still a key market element.
Kyle Rodda, senior financial markets analyst at Capital.com commented; “The delay in the imposition of new tariffs on some of the U.S.’s major trading partners to August 1 has simultaneously kicked the proverbial can down the road and supported the notion that the loftier tariff rates are a negotiating ploy.”
He added; “As a result, the markets have been left hanging, and waiting for a stronger catalyst to drive the next move.”
Ray Attrill, head of FX strategy at the National Australia Bank noted; “The market’s second take on the reciprocal tariff announcements was actually dollar negative on the view that there was as much harm, or more harm, going to be inflicted on the U.S. from these actions as elsewhere.”
He also focussed on uncertainty; “It makes markets reluctant to take a kind of positional view as to how this may play out, given uncertainty still reigns.”
Federal Reserve minutes from the June policy meeting will be released later on Wednesday.
“According to ING; “The consensus expectation is probably that two members, Bowman and Waller, will have flagged their dissent at the meeting before delivering dovish comments to the media a few days later. But if the minutes show a greater dovish front, then the dollar could take a hit as the bar for data to justify a summer cut would be lower.”
Wider Federal Reserve developments could also be a key element for currency markets and the dollar.
President Trump has stepped-up his criticism of Fed Chair Powell and called for him to resign immediately.
There is also evidence that Trump will open up a potential route to get Powell dismissed by accusing him of misleading Congress.
There have also been reports that Administration economic advisor Hassett is a main contender to replace Powell.
Fears over a politicised Fed could cause major dollar damage.
Danske Bank focussed on a potential lack of experience if there are big changes; “the USD historically trades weaker when experience in the Federal Reserve board drops and that will likely happen over the coming year.”
International Money Transfer? Ask our resident FX expert a money transfer question or try John’s new, free, no-obligation personal service! ,where he helps every step of the way,
ensuring you get the best exchange rates on your currency requirements.
TAGS: Euro Dollar Forecasts
Log in or register to access precise data.
* For commercial use only
Production and consumption
4
Trade
8
Refining
4
Companies
7
Global overview
8
Prices
4
* For commercial use only
Interfax Russia. (September 6, 2024). Price forecast for the Urals crude oil from 2024 to 2027 (in U.S. dollars per barrel) [Graph]. In Statista. Retrieved July 09, 2025, from https://www.statista.com/statistics/253153/urals-crude-oil-price-forecast/?__sso_cookie_checker=failed
Interfax Russia. “Price forecast for the Urals crude oil from 2024 to 2027 (in U.S. dollars per barrel).” Chart. September 6, 2024. Statista. Accessed July 09, 2025. https://www.statista.com/statistics/253153/urals-crude-oil-price-forecast/?__sso_cookie_checker=failed
Interfax Russia. (2024). Price forecast for the Urals crude oil from 2024 to 2027 (in U.S. dollars per barrel). Statista. Statista Inc.. Accessed: July 09, 2025. https://www.statista.com/statistics/253153/urals-crude-oil-price-forecast/?__sso_cookie_checker=failed
Interfax Russia. “Price Forecast for The Urals Crude Oil from 2024 to 2027 (in U.S. Dollars per Barrel).” Statista, Statista Inc., 6 Sep 2024, https://www.statista.com/statistics/253153/urals-crude-oil-price-forecast/?__sso_cookie_checker=failed
Interfax Russia, Price forecast for the Urals crude oil from 2024 to 2027 (in U.S. dollars per barrel) Statista, https://www.statista.com/statistics/253153/urals-crude-oil-price-forecast/?__sso_cookie_checker=failed (last visited July 09, 2025)
Price forecast for the Urals crude oil from 2024 to 2027 (in U.S. dollars per barrel) [Graph], Interfax Russia, September 6, 2024. [Online]. Available: https://www.statista.com/statistics/253153/urals-crude-oil-price-forecast/?__sso_cookie_checker=failed