The main category of Forex News.
You can use the search box below to find what you need.
[wd_asp id=1]
The main category of Forex News.
You can use the search box below to find what you need.
[wd_asp id=1]
During Thursday’s European session, USD/JPY extended its recovery, briefly approaching 145.22 before pulling back. The pair found support from renewed risk appetite, partly driven by a fresh trade agreement between the U.S. and Vietnam. That deal eased some global trade anxiety, cutting into demand for the safe-haven Japanese Yen.
At the same time, tensions between the U.S. and Japan are flaring. Former President Donald Trump renewed tariff threats, warning of duties as high as 35% on Japanese goods, citing Tokyo’s unwillingness to buy U.S. rice. These comments came as trade talks between the two nations stalled ahead of the July 9 deadline. While risk-on sentiment helped push USD/JPY higher, geopolitical stress and trade friction are beginning to cap gains.
On the monetary policy front, the Bank of Japan remains one of the few central banks still discussing tightening. Governor Kazuo Ueda recently reinforced that rates remain below neutral and may need to rise further, especially with inflation staying above the BoJ’s 2% target for over three years. These expectations continue to provide a floor for the Yen.
In contrast, the U.S. dollar is starting to lose ground as Fed expectations turn dovish.
After June’s ADP report showed a shocking drop of 33,000 private payrolls, all eyes turned to Friday’s Nonfarm Payrolls, which printed at 147,000—slightly above estimates but not strong enough to reverse softening sentiment. Unemployment ticked up to 4.1%, while wage growth slowed to 0.2%, indicating cooling inflation.
Market pricing now reflects about a 25% chance of a July rate cut, and expectations for two cuts before year-end are solidifying. Political pressure isn’t helping either, Trump’s public remarks about Powell’s leadership and potential resignation calls have stirred concerns about the Fed’s independence, which is additionally weakening the dollar’s appeal.
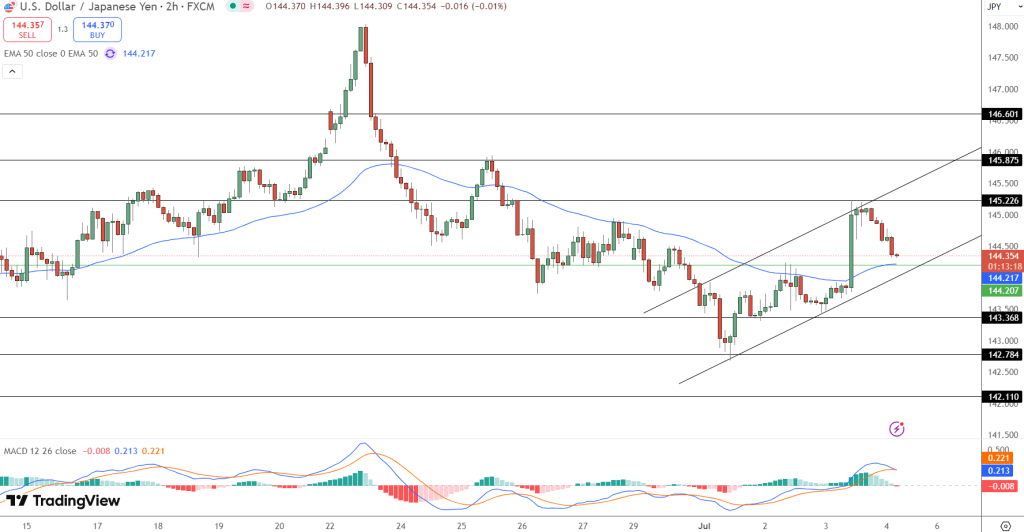
the USD/JPY pair is now trading near 144.35, pulling back from the 145.22 resistance. Price remains within a rising channel, but the pair is testing a critical zone where short-term sentiment could shift.
Trade Setup:
From my experience, this is a textbook test of momentum versus structure. If bulls defend 144.20 with conviction, another push toward 145.87 is likely. But if that zone breaks, the focus shifts sharply toward downside targets. With conflicting macro themes in play, confirmation and risk management are more important than ever.

Arslan Butt
Lead Markets Analyst – Multi-Asset (FX, Commodities, Crypto)
Arslan Butt serves as the Lead Commodities and Indices Analyst, bringing a wealth of expertise to the field. With an MBA in Behavioral Finance and active progress towards a Ph.D., Arslan possesses a deep understanding of market dynamics.
His professional journey includes a significant role as a senior analyst at a leading brokerage firm, complementing his extensive experience as a market analyst and day trader. Adept in educating others, Arslan has a commendable track record as an instructor and public speaker.
His incisive analyses, particularly within the realms of cryptocurrency and forex markets, are showcased across esteemed financial publications such as ForexCrunch, InsideBitcoins, and EconomyWatch, solidifying his reputation in the financial community.
July 3, 2025 – Written by Tim Boyer
STORY LINK Pound-to-Dollar Forecast: GBP Steady despite Strong US Jobs Data
The Pound US Dollar exchange rate trended mostly flat on Thursday as the US released its latest non-farm payrolls index and unemployment rate.
At the time of writing, GBP/USD was trading at approximately $1.3658, down roughly 0.3% from the start of Thursday’s session.
The US Dollar (USD) strengthened on Thursday, buoyed by unexpectedly upbeat labour market data that helped reinforce confidence in the resilience of the US economy.
June’s non-farm payrolls figure exceeded expectations, climbing to 147,000 new jobs versus forecasts of a sharp drop to 110,000, up from May’s revised reading of 144,000.
Adding further support, the US unemployment rate defied predictions of a rise to 4.3%, instead dipping to 4.1% from 4.2%.
The combination of stronger-than-expected job creation and a lower jobless rate provided a boost to the US Dollar during Thursday’s European session, as investors took the data as a sign that the labour market remains on solid footing.
The Pound (GBP) regained some composure on Thursday, stabilising after a volatile mid-week session, marked by political tensions in Westminster.

Sterling had come under pressure on Wednesday amid speculation surrounding Chancellor Rachel Reeves’ standing within the Labour government.
Market nerves were heightened after Prime Minister Keir Starmer refrained from offering a clear endorsement during Prime Minister’s Questions, sparking a sell-off in UK bonds and dragging GBP lower.
However, investor sentiment improved on Thursday following renewed backing for Reeves from Starmer, helping to calm concerns.
As gilt yields eased from their recent spike, the Pound found renewed support and edged higher against several of its counterparts on Thursday.
Looking ahead to Friday’s European session, the GBP/USD exchange rate is likely to remain range-bound, with limited data and subdued trading conditions offering little direction.
With no major UK economic releases scheduled and US markets closed for the Independence Day holiday, both the Pound and the US Dollar may struggle to find meaningful momentum.
In the absence of fresh catalysts, market sentiment will likely take centre stage.

However, with thin trading volumes expected, volatility may be muted. As a result, the GBP/USD exchange rate is likely to fluctuate within a narrow band as the week comes to a close.
International Money Transfer? Ask our resident FX expert a money transfer question or try John’s new, free, no-obligation personal service! ,where he helps every step of the way,
ensuring you get the best exchange rates on your currency requirements.
TAGS: Pound Dollar Forecasts
Near-term resistance is clear at today’s high of $3,366. Therefore, a decisive breakout above that level has gold heading towards a prior lower swing high at $3,396. And it has a good chance of busting through there and continuing to a test of resistance around the recent swing high of $3,451. Slow momentum has been a concern since a trendline breakout triggered on June 2.
That rally subsequently fizzled following the $3,451 high, with gold eventually falling back below the 20-Day MA, where it remains. Therefore, another reclaim of the 20-Day line should be met with some enthusiasm from buyers as indicated by bullish price momentum. And there is the potential for volatility to increase.
Notice that the most recent bounce from support at the 20-Day MA (purple) in early-June was followed by a relatively sharp three-day advance. It ended with a bearish outside day, like today. This only becomes relevant if Tuesday’s support fails and bearish momentum rises. Volatility should increase soon given the convergence of the 20-Day and 50-Day MAs recently. They are now the closest to one another since the beginning of the current upswing that began in January. That could help pump up a bull breakout.
For a look at all of today’s economic events, check out our economic calendar.
Bearish behavior today did not confirm that one-day bullish reversal breakout that triggered yesterday. It puts recent support, with a low of $3.29, at further risk of being broken. But Wednesday’s low of $3.37 would need to fail before Tuesday’s low is approached. In addition, notice that the 50-Day MA (orange) shows an area of resistance near Thursday and Wednesday highs. There has been no confirmation of strength with a daily close above that line. Although natural gas is holding a significant support area, it needs to turn up and stay up.
This is the third time since April that support around the 200-Day line has rejected price to the upside. That behavior adds to the significance of the long-term dynamic trend indicator. Therefore, a decisive drop back below that line shows a failure of the 200-Day MA as support and a breakdown from a significant support level.
Looking at the bigger picture of the current advance shows similar characteristics to a bear flag. Therefore, the breakdown of the 200-Day line is also a bearish trigger for the three-month rising trend channel. There is potential trendline support nearby though and a continuation lower could quickly find support. If not at the line, then certainly the 78.6% Fibonacci retracement area at $3,134
The next bullish sign will be on a rally above today’s high of $3.57. If strength continues from there, an interim swing high at $3.75 is next in line, followed by the first May swing high at $3.84. But a clear reversal from the bottom channel line has the potential to rise towards the top of the channel. There are several Fibonacci levels nearby from $5.35 to $4.46.
For a look at all of today’s economic events, check out our economic calendar.
Silver price revisits two-week high near $36.80 during European trading hours on Thursday. The white metal trades firmly ahead of the United States (US) Nonfarm Payrolls (NFP) data for June, which will be published at 12:30 GMT.
The US official employment data will significantly influence market expectations for the Federal Reserve’s (Fed) monetary policy outlook as officials have lately warned of downside labor market risks.
Economists expect US employers to have added 110K fresh workers, fewer than 139K in May. The Unemployment Rate is estimated to have accelerated to 4.3% from the prior reading of 4.2%. Soft labor market data could bolster market expectations that the Fed will reduce interest rates in the policy meeting later this month.
Lower interest rates by the Fed bode well for non-yielding assets, such as Silver.
Latest US ADP Employment figures suggests that the official labor market data could be weaker. The data showed on Wednesday that the US private sector laid-off 33K employees in June, while they were expected to hire 95K fresh workers. Additionally, the May reading was also revised lower to 29K from 37K.
“Though layoffs continue to be rare, a hesitancy to hire and a reluctance to replace departing workers led to job losses last month,” Nela Richardson, chief economist at ADP, said.
On the global front, US President Donald trump has announced that his team has struck a trade agreement with Vietnam. This comes at a time when the July 9 tariff deadline is approaching.
Theoretically, improving global trade conditions diminish demand for safe-haven assets, such as Silver. However, the Silver price remains firm as the Asian country is not one of top major trading partners of the US with whom it is still negotiating bilateral deals.
Silver price strengthens after a breakout of the Descending Triangle chart pattern formed on a four-hour time. Theoretically, the breakout of the above-mentioned chart pattern often leads to a volatility expansion, which results in higher volume and wider ticks on the upside.
The downward-sloping trendline of the Descending Triangle formation is plotted from the June 18 high of $37.32, while the horizontal support is marked from the June 20 low of $35.51.
The 14-period Relative Strength Index (RSI) breaks above 60.00. A fresh bullish momentum would trigger if the RSI holds above that level.
Looking down, the March 28 high around $34.60 will act as key support for the Silver price. On the upside, the fresh over-a-decade high around $37.32 will be the key barrier.
Silver is a precious metal highly traded among investors. It has been historically used as a store of value and a medium of exchange. Although less popular than Gold, traders may turn to Silver to diversify their investment portfolio, for its intrinsic value or as a potential hedge during high-inflation periods. Investors can buy physical Silver, in coins or in bars, or trade it through vehicles such as Exchange Traded Funds, which track its price on international markets.
Silver prices can move due to a wide range of factors. Geopolitical instability or fears of a deep recession can make Silver price escalate due to its safe-haven status, although to a lesser extent than Gold’s. As a yieldless asset, Silver tends to rise with lower interest rates. Its moves also depend on how the US Dollar (USD) behaves as the asset is priced in dollars (XAG/USD). A strong Dollar tends to keep the price of Silver at bay, whereas a weaker Dollar is likely to propel prices up. Other factors such as investment demand, mining supply – Silver is much more abundant than Gold – and recycling rates can also affect prices.
Silver is widely used in industry, particularly in sectors such as electronics or solar energy, as it has one of the highest electric conductivity of all metals – more than Copper and Gold. A surge in demand can increase prices, while a decline tends to lower them. Dynamics in the US, Chinese and Indian economies can also contribute to price swings: for the US and particularly China, their big industrial sectors use Silver in various processes; in India, consumers’ demand for the precious metal for jewellery also plays a key role in setting prices.
Silver prices tend to follow Gold’s moves. When Gold prices rise, Silver typically follows suit, as their status as safe-haven assets is similar. The Gold/Silver ratio, which shows the number of ounces of Silver needed to equal the value of one ounce of Gold, may help to determine the relative valuation between both metals. Some investors may consider a high ratio as an indicator that Silver is undervalued, or Gold is overvalued. On the contrary, a low ratio might suggest that Gold is undervalued relative to Silver.
The US dollar has skyrocketed against the Japanese yen, breaking above the 145 yen level almost immediately, and now we are threatening that 50 day EMA. Ultimately, I do think this is a situation where traders will eventually try to push this market back to the upside anyways, because quite frankly, the Bank of Japan has a major issue on its hands in the form of a lackluster bond market. They will sooner or later be forced to do a bit of quantitative easing. When they do, the Japanese yen will sink. This is one of the few places that I expect a complete turnaround in the US dollar. So, I like buying dips. I think we will go higher.
And yet again, we find ourselves near the 0.6550 level in the Australian dollar. The market broke down below that level for a brief moment, only to turn around and bounce a bit. So, it’ll be interesting to see how this plays out, but I do think you have a situation where traders are going to continue to look at this as a magnet for price. If it can hold for support, then that’s a good sign for the Australian dollar. It could send the Aussie dollar as high as 0.67, we’ll just have to wait and see.
The move higher has been in an extreme grind more than anything else. So, if you’re a short term kind of scalper type of trade aficionado, then you’ll love the Aussie. Clearly, it’s a buy on the dip market, but as far as momentum to the upside, it’s very slow trading indeed.
For a look at all of today’s economic events, check out our economic calendar.
GBP/USD came under heavy bearish pressure on Wednesday and lost about 0.8%. The pair stages a rebound early Thursday but trades well below 1.3700. Markets will keep a close eye on political developments in the UK and scrutinize the June employment report from the US.
The table below shows the percentage change of British Pound (GBP) against listed major currencies this week. British Pound was the weakest against the Swiss Franc.
| USD | EUR | GBP | JPY | CAD | AUD | NZD | CHF | |
|---|---|---|---|---|---|---|---|---|
| USD | -0.51% | 0.40% | -0.35% | -0.74% | -0.57% | -0.30% | -0.77% | |
| EUR | 0.51% | 0.89% | 0.19% | -0.23% | -0.07% | 0.22% | -0.26% | |
| GBP | -0.40% | -0.89% | -0.88% | -1.12% | -0.96% | -0.68% | -1.15% | |
| JPY | 0.35% | -0.19% | 0.88% | -0.40% | -0.18% | 0.08% | -0.38% | |
| CAD | 0.74% | 0.23% | 1.12% | 0.40% | 0.12% | 0.43% | -0.03% | |
| AUD | 0.57% | 0.07% | 0.96% | 0.18% | -0.12% | 0.28% | -0.19% | |
| NZD | 0.30% | -0.22% | 0.68% | -0.08% | -0.43% | -0.28% | -0.47% | |
| CHF | 0.77% | 0.26% | 1.15% | 0.38% | 0.03% | 0.19% | 0.47% |
The heat map shows percentage changes of major currencies against each other. The base currency is picked from the left column, while the quote currency is picked from the top row. For example, if you pick the British Pound from the left column and move along the horizontal line to the US Dollar, the percentage change displayed in the box will represent GBP (base)/USD (quote).
British Prime Minister Keir Starmer’s refusal to guarantee that finance minister Rachel Reeves will remain in her position until the next election triggered a selloff in UK government bonds during the European session on Wednesday, causing Pound Sterling to weaken against its major rivals.
Late Wednesday, Starmer said that Reeves would remain chancellor “for a very long time to come,” easing concerns over a political turmoil. In response, the 10-year UK gilt yield started to correct lower early Thursday after rising nearly 4% on Wednesday and helped GBP/USD find support.
Later in the day, the US Bureau of Labor Statistics is forecast to report an increase of 110,000 in Nonfarm Payrolls (NFP) in June.
According to the CME Group FedWatch Tool, markets are currently pricing in about a 25% probability of the Federal Reserve (Fed) cutting the policy rate by 25 basis points in July. Hence, a positive surprise in NFP, with a print above 150,0000, could confirm a Fed policy-hold in July and help USD gather strength ahead of the July 4 holiday. Conversely, a disappointing reading below 80,000 could hurt the USD with the immediate reaction and open the door for an extended recovery in GBP/USD.
GBP/USD stays slightly below the 50-period Simple Moving Average (SMA) and the Relative Strength Index (RSI) indicator remains below 50, reflecting a lack of bullish momentum.
On the downside, 1.3620 (static level) aligns as the next support level before 1.3590 (100-period SMA) and 1.3550 (200-period SMA). Looking north, resistance levels could be spotted at 1.3690-1.3700 (mid-point of the ascending channel, static level), 1.3770 (static level) and 1.3800 (static level, round level).
The Pound Sterling (GBP) is the oldest currency in the world (886 AD) and the official currency of the United Kingdom. It is the fourth most traded unit for foreign exchange (FX) in the world, accounting for 12% of all transactions, averaging $630 billion a day, according to 2022 data.
Its key trading pairs are GBP/USD, also known as ‘Cable’, which accounts for 11% of FX, GBP/JPY, or the ‘Dragon’ as it is known by traders (3%), and EUR/GBP (2%). The Pound Sterling is issued by the Bank of England (BoE).
The single most important factor influencing the value of the Pound Sterling is monetary policy decided by the Bank of England. The BoE bases its decisions on whether it has achieved its primary goal of “price stability” – a steady inflation rate of around 2%. Its primary tool for achieving this is the adjustment of interest rates.
When inflation is too high, the BoE will try to rein it in by raising interest rates, making it more expensive for people and businesses to access credit. This is generally positive for GBP, as higher interest rates make the UK a more attractive place for global investors to park their money.
When inflation falls too low it is a sign economic growth is slowing. In this scenario, the BoE will consider lowering interest rates to cheapen credit so businesses will borrow more to invest in growth-generating projects.
Data releases gauge the health of the economy and can impact the value of the Pound Sterling. Indicators such as GDP, Manufacturing and Services PMIs, and employment can all influence the direction of the GBP.
A strong economy is good for Sterling. Not only does it attract more foreign investment but it may encourage the BoE to put up interest rates, which will directly strengthen GBP. Otherwise, if economic data is weak, the Pound Sterling is likely to fall.
Another significant data release for the Pound Sterling is the Trade Balance. This indicator measures the difference between what a country earns from its exports and what it spends on imports over a given period.
If a country produces highly sought-after exports, its currency will benefit purely from the extra demand created from foreign buyers seeking to purchase these goods. Therefore, a positive net Trade Balance strengthens a currency and vice versa for a negative balance.
The USD/JPY forecast shows a rebound as the dollar gains on trade optimism. However, downbeat employment figures in the previous session led to an increase in Fed rate cut expectations. Market participants are now looking forward to the nonfarm payrolls report.
–Are you interested in learning more about MT5 brokers? Check our detailed guide-
The dollar strengthened on Thursday after news of a trade deal between the US and Vietnam. The news raised hopes of more deals before the July 9 deadline for reciprocal tariffs. The progress in trade talks has been slow, and there are concerns that tariffs will increase again soon. Therefore, any new deal boosts market sentiment.
However, the dollar remains under pressure after data in the previous session revealed weak private employment. The economy lost 33,000 private jobs in June. Meanwhile, economists had expected 99,000 new jobs. The report raised concerns about the state of the labor market. At the same time, it increased the likelihood of a Fed rate cut in July.
All eyes are now on the nonfarm payrolls. Economists expect 120,000 new jobs, a slowdown from the previous month. Moreover, unemployment might increase from 4.2% to 4.3%. Softer-than-expected figures will weigh on the dollar by adding pressure on the Fed to lower borrowing costs.
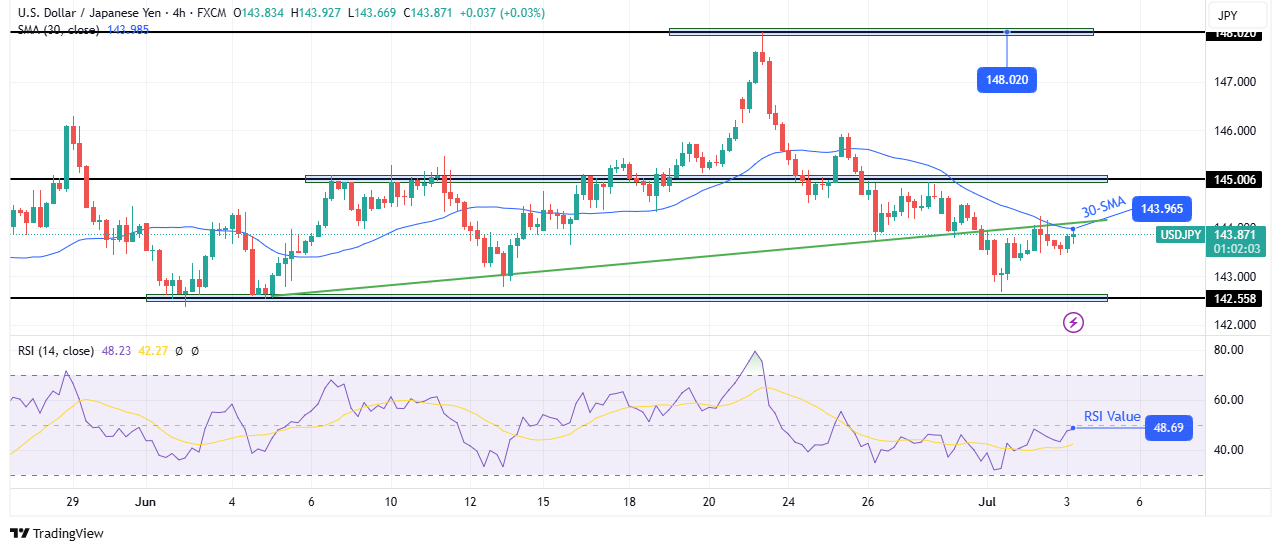
On the technical side, the USD/JPY price has broken below its bullish trendline to make a lower low. The move has strengthened the bearish bias. However, the price has pulled back to retest the recently broken trendline and the 30-SMA. However, the price remains below the SMA, with the RSI under 50, indicating that bears are still in the lead. However, this might change.
–Are you interested in learning more about forex signals telegram groups? Check our detailed guide-
The current resistance zone must hold firm to allow the price to bounce lower and confirm the breakout. If this happens, the USD/JPY pair will likely drop to retest the 142.55 support level.
On the other hand, if bulls are stronger, the price will likely break above the resistance zone. Still, to confirm a new bullish move, the price would need to break above the 145.00 resistance level.
Looking to trade forex now? Invest at eToro!
68% of retail investor accounts lose money when trading CFDs with this provider. You should consider whether you can afford to take the high risk of losing your money.
Silver (XAG/USD) followed suit, retreating 0.33% to $36.43 after briefly testing near-weekly highs. The pullback came as markets interpreted the trade developments as a signal of easing global tensions, prompting modest rotation out of defensive assets like gold and silver.
Despite the softer tone, both metals remain underpinned by rising expectations of a dovish shift from the Federal Reserve. The ADP private employment report showed a surprise loss of 33,000 jobs in June—the first monthly decline in more than two years. This follows a weaker-than-expected JOLTS report earlier in the week, reinforcing signs of cooling in the U.S. labour market.
“The labor market is clearly softening, and the Fed may not wait much longer to respond,” said Sarah Mendez, senior macro strategist at Alta Investments. “A weak NFP print on Friday could accelerate expectations of a rate cut as early as September.”
As of Thursday, Fed funds futures suggest a 25% probability of a July rate cut, with market pricing implying a 75% chance of easing by the September FOMC meeting.
While trade optimism has trimmed near-term upside, underlying macro uncertainty and dovish policy shifts continue to anchor demand for precious metals. Friday’s Nonfarm Payrolls report is expected to be the next major catalyst, with markets bracing for increased volatility.
Gold hovers near $3,366 as traders await U.S. jobs data. Silver holds above $36.33. Fed rate cut bets limit downside despite risk-on sentiment.
The GBPJPY pair is under strong bearish pressure, which forces it to resume the bearish correctional attack, facing the support of the bullish channel’s support at 195.35, to settle above it to stop the negative bleeding in the current period, to rally towards 195.95.
Note that surpassing 196.45 level is important to confirm its readiness to renew the bullish attempts, to expect attacking the extra barrier at 197.45, while the continuation of the negative pressure and breaking the current support will force it to suffer new losses, to wait for reaching 194.20, then attempts to press on the EMA50 that is located near 193.55.
The expected trading range for today is between 195.55 and 197.45
Trend forecast: Bullish