The main category of Forex News.
You can use the search box below to find what you need.
[wd_asp id=1]
The main category of Forex News.
You can use the search box below to find what you need.
[wd_asp id=1]
Coffee price continued forming strong negative trading, to face 50%Fibonacci correctional level, which forms a strong support at 292.85, then bounces quickly towards 302.05 as appears in the above image.
We expect forming some mixed trading, but its repeated stability above the current support will reinforce the chances for gathering the positive momentum and begin recovering the losses by targeting 313.60 level, reaching the barrier at 327.05.
The expected trading range for today is between 395.00 and 313.60
Trend forecast: Bullish
Platinum price formed a clear correctional decline, to test the minor bullish channel’s support at $1324.75, to achieve the suggested correctional target in the previous report, then begin forming bullish waves to settle near $1363.00.
The continuation of the fluctuation within the bullish channel’s levels is expected, depending on the stability of the support to expect its rally to $1382.00 and $1400.00. While breaking the support and providing a negative close will confirm its readiness to resume the bearish correctional attack, and $1302.00 level represents the extra negative target.
The expected trading range for today is between $1330,00 and $1382.00
Trend forecast: Bullish
The Gold price (XAU/USD) extends the decline to around $3,265 during the early Asian session on Monday. The precious metal tumbles to near one-month low after a United States (US)-China trade agreement boosted risk appetite. Investors await the Fedspeak later on Monday for fresh impetus.
A trade deal reached between the US and China last week on how to expedite rare earth shipments to the US was viewed positively by markets. This, in turn, diminished bullion’s appeal as a safe-haven asset. Additionally, the ceasefire deal between Iran and Israel last week contributes to the yellow metal’s downside.
“The slowdown in geopolitics has offered an opportunity for investors to start taking profit because of the forward-looking prospects of some kind of kinetic war with China and the developments in the Middle East,” said Daniel Pavilonis, senior market strategist at RJO Futures.
On the other hand, any renewed geopolitical tensions or trade uncertainty triggered by US President Donald Trump could prompt central bank buying and increasing demand for the precious metal, a traditional, safe-haven asset.
Increased optimism of a Federal Reserve (Fed) rate cut might also lift the non-interest-bearing bullion. Traders raise bets that the US central bank will cut rates more times this year and possibly sooner than previously expected as US data released Friday showed an unexpected fall in consumer spending.
Gold has played a key role in human’s history as it has been widely used as a store of value and medium of exchange. Currently, apart from its shine and usage for jewelry, the precious metal is widely seen as a safe-haven asset, meaning that it is considered a good investment during turbulent times. Gold is also widely seen as a hedge against inflation and against depreciating currencies as it doesn’t rely on any specific issuer or government.
Central banks are the biggest Gold holders. In their aim to support their currencies in turbulent times, central banks tend to diversify their reserves and buy Gold to improve the perceived strength of the economy and the currency. High Gold reserves can be a source of trust for a country’s solvency. Central banks added 1,136 tonnes of Gold worth around $70 billion to their reserves in 2022, according to data from the World Gold Council. This is the highest yearly purchase since records began. Central banks from emerging economies such as China, India and Turkey are quickly increasing their Gold reserves.
Gold has an inverse correlation with the US Dollar and US Treasuries, which are both major reserve and safe-haven assets. When the Dollar depreciates, Gold tends to rise, enabling investors and central banks to diversify their assets in turbulent times. Gold is also inversely correlated with risk assets. A rally in the stock market tends to weaken Gold price, while sell-offs in riskier markets tend to favor the precious metal.
The price can move due to a wide range of factors. Geopolitical instability or fears of a deep recession can quickly make Gold price escalate due to its safe-haven status. As a yield-less asset, Gold tends to rise with lower interest rates, while higher cost of money usually weighs down on the yellow metal. Still, most moves depend on how the US Dollar (USD) behaves as the asset is priced in dollars (XAU/USD). A strong Dollar tends to keep the price of Gold controlled, whereas a weaker Dollar is likely to push Gold prices up.
Silver price sinks more than 1% on Friday, ahead of the weekend, after refreshing a five-day high of $36.83, ahead of $37.00. At the time of writing, XAG/USD trades at $36.16 due to a slight recovery in the US Dollar and rising US Treasury yields.
Silver price retreated, forming a ‘bearish engulfing’ candlestick chart pattern, which opens the door for testing lower prices. It should be said that achieving a weekly close above $36.00 keeps the latter at a strong support level, with buyers eyeing higher prices.
Nevertheless, for a resumption of the uptrend, bulls need to reclaim the June 26 peak at $36.83. Once surpassed, the next zone of interest would be $37.00, followed by the yearly peak of $37.31. Conversely, if Silver slides below $36.50, expect a test of $36.00. Further downside lies in the June 24 daily low of $35.68, followed by the latest cycle low of $35.29.
Silver is a precious metal highly traded among investors. It has been historically used as a store of value and a medium of exchange. Although less popular than Gold, traders may turn to Silver to diversify their investment portfolio, for its intrinsic value or as a potential hedge during high-inflation periods. Investors can buy physical Silver, in coins or in bars, or trade it through vehicles such as Exchange Traded Funds, which track its price on international markets.
Silver prices can move due to a wide range of factors. Geopolitical instability or fears of a deep recession can make Silver price escalate due to its safe-haven status, although to a lesser extent than Gold’s. As a yieldless asset, Silver tends to rise with lower interest rates. Its moves also depend on how the US Dollar (USD) behaves as the asset is priced in dollars (XAG/USD). A strong Dollar tends to keep the price of Silver at bay, whereas a weaker Dollar is likely to propel prices up. Other factors such as investment demand, mining supply – Silver is much more abundant than Gold – and recycling rates can also affect prices.
Silver is widely used in industry, particularly in sectors such as electronics or solar energy, as it has one of the highest electric conductivity of all metals – more than Copper and Gold. A surge in demand can increase prices, while a decline tends to lower them. Dynamics in the US, Chinese and Indian economies can also contribute to price swings: for the US and particularly China, their big industrial sectors use Silver in various processes; in India, consumers’ demand for the precious metal for jewellery also plays a key role in setting prices.
Silver prices tend to follow Gold’s moves. When Gold prices rise, Silver typically follows suit, as their status as safe-haven assets is similar. The Gold/Silver ratio, which shows the number of ounces of Silver needed to equal the value of one ounce of Gold, may help to determine the relative valuation between both metals. Some investors may consider a high ratio as an indicator that Silver is undervalued, or Gold is overvalued. On the contrary, a low ratio might suggest that Gold is undervalued relative to Silver.
June 29, 2025 – Written by Tim Boyer
STORY LINK Pound to Dollar Forecast: Next up “Psychologically Important 1.40”
The US Dollar has continued to dominated global currency markets and has continued to struggle amid an underlying loss of confidence in the US currency with a particular focus on Federal Reserve policy.
The Pound to Dollar (GBP/USD) exchange rate is trading just below 1.3750 and not far below 44-month highs of 1.3770 recorded on Thursday. There is scope for some trimming of GBP/USD longs into the weekend.
Scotiabank noted some worrying signs, but commented; “The 50 day MA (1.3438) remains a critical medium-term level of support and the chart offers little major resistance ahead of the psychologically important 1.40 level.”
It added; “The near-term range is likely to be defined by 1.3600 support and 1.3800 resistance.”
UoB noted the risk of correction; “While GBP could continue to advance, overbought short-term conditions may lead to a couple of days of consolidation first. All in all, the outlook for GBP remains positive, and the next technical objective is 1.3800.”
Dollar developments dominated with no major developments during the day, although traders were monitoring UK budget developments after the U-turn on welfare spending.
As far as US data is concerned, the core PCE prices index increased 0.2% for May compared with consensus forecasts of a 0.1% increase with the year-on-year rate edging higher to 2.7% from 2.6%.

The slightly higher than expected data could discourage centrist Federal Reserve members from backing any near-term cut in interest rates, but rhetoric will continue to be watched closely.
Elsewhere, personal income declined 0.4% on the month with a 0.1% decline for personal spending.
Scotiabank added; “We think risks are tilted squarely towards more immediate and significant dollar losses. The FOMC consensus remains cool on July but speculation of rate cuts will intensify if the run of US data continues to disappoint.”
Monex Europe head of macro research Nick Rees noted the risk of further Fed criticism by the White House and forecast revisions; “I’ll be perfectly honest, I’m currently rewriting them in light of what we are seeing right now.”
He added; “We had thought the dollar should stabilize around current levels because the macro data is about to turn really quite positive.”
Seema Shah, chief global strategist at Principal Asset Management, “Talk about having the next Fed chair announced within the next couple of months, that would be fairly disruptive.”
She added; “It brings up the whole concern about the credibility and reliability of U.S. institutions again, which is typically something that people don’t like.”

Investec commented; “A successor perceived by the market to be more open to accommodating Trump’s wishes risks damaging the independence of the Fed in setting policy.”
Rabobank also noted potential risks; “An early nomination could make the nominee the “de facto shadow chair” as his comments (only men are reported to be on the shortlist) would carry a lot of weight in the markets regarding monetary policy beyond May 2026 when Powell’s term expires.”
According to Pepperstone’s Chris Weston; “For the dollar to see a sustained counter-rally, I would argue we’d need US growth to pick up and implied Fed rate cuts to be repriced — perhaps with growth data in Europe and China also slowing.”
He added; “That doesn’t seem likely in the near term, and as such, rallies in the dollar are likely to be quickly sold off, with the downtrend set to continue.”
International Money Transfer? Ask our resident FX expert a money transfer question or try John’s new, free, no-obligation personal service! ,where he helps every step of the way,
ensuring you get the best exchange rates on your currency requirements.
June 29, 2025 – Written by Ben Hughes
STORY LINK Euro to Dollar Forecast: Trader Talk of 1.20 EUR/USD Increases
The US Dollar has remained firmly on the defensive with further unease over Federal Reserve policy. There has been further speculation that the Administration will move to undermine central bank independence and aim directly or indirectly to force a near-term cut in interest rates.
The Euro to Dollar (EUR/USD) exchange rate is trading just above 1.1700 from 45-month highs just above 1.1740 reached on Thursday.
EUR/USD has posted seven successive daily gains which will potentially expose the pair to a limited correction.
UoB commented, “Further EUR strength still appears likely, but overbought short-term conditions could slow the pace of any further advance. The next level to monitor is 1.1780.”
ING notes that estimates of EUR/USD fair value have increased to around 1.1450 from 1.10 amid a decline in US yields.
According to the bank; “Geopolitical risk has been radically priced out, and most importantly, FOMC divisions have prompted material dovish speculation. This justifies a more bullish view on EUR/USD, but not necessarily a call for 1.20.
It added; “Markets’ enthusiasm for an earlier Fed cut may be misplaced, and EUR/USD may settle back around 1.15-1.16, awaiting conclusive information on inflation.”
According to Scotiabank; “This week it’s definitely been about the Fed, the prospect of easing sooner and potentially more rate cuts.”
Thursday’s US data recorded a decline in initial jobless claims to 236,000 in the latest week from 246,000 previously while there was a further increase in continuing claims to 1.97mn from 1.94mn and the highest figure since late 2021.
There was a downward revision to first-quarter GDP to -0.5% from -0.2%, but durable goods orders posted a stronger-than-expected increase.
Danske Bank noted; “There was a decent decline in US Treasury yields yesterday as well as a steepening of the yield curve on the back of weaker than expected Q1 GDP numbers from the US as well as speeches from various Federal Reserve officials that are indicating forthcoming easing of monetary policy despite the potential impact from Tariffs.”
There have been further rumours of a near-term move to name a successor to Chair Powell and effectively put a “shadow Fed” in play which would undermine official guidance ahead of May 2026 when Powell’s term as Chair is scheduled to end.
Commonwealth Bank of Australia commented; “The sooner a replacement is announced for Powell, the sooner he could be perceived to be a ‘lame duck’.”
She added; “For now, expectations President Trump will choose a more dovish chair will keep downward pressure on FOMC pricing and the USD.”
The leading contenders for next Fed chief reportedly include former Fed Gov. Kevin Warsh, National Economic Council head Kevin Hassett, current Fed Gov. Christopher Waller, and Treasury Secretary Scott Bessent.
RBC BlueBay Asset Management senior portfolio manager Kaspar Hense noted the risk of a dovish appointment: “This is not currently 100% in the price, and it would still move markets if someone like Hassett or Bessent would get the job in order to cut rates, ignoring fundamental risk.”
He added; “We are short the dollar in this environment, where there is an erosion of institutions.”
SocGen’s Kit Juckes added; “I think the market is pricing in President Trump appointing someone who at least at first sight appears more sympathetic to his cause.”
Scotiabank added; “The result of U.S. asset outperformance over the past decade is you’ve got a lot of asset managers that are long the U.S. dollar way more than I think they’re comfortable.”
International Money Transfer? Ask our resident FX expert a money transfer question or try John’s new, free, no-obligation personal service! ,where he helps every step of the way,
ensuring you get the best exchange rates on your currency requirements.
Copper price took advantage of the positive factors by confirming the obstacle at $4.8900, to notice by the above image, forming a strong bullish rally achieving the main targets by reaching $5.0700 level and settles around it.
By the above image, we notice forming $5.1000 level to previous liquidity grab zones, to form an extra barrier against the bullish trading in the current period, to expect the price affection by the domination of the sideways bias domination temporarily, while the continuation of the fluctuation below this barrier might increase the chance for activating the bearish correctional track, which might target $4.9100 level.
The expected trading range for today is between $4.9600 and $5.1000
Trend forecast: Fluctuated with the bullish track
Although today’s price action may be short-term bearish, bull signals generated over the past few days show improving demand and an increased chance that the price of crude oil can continue its rising trend. On Friday, a bullish trend continuation signal was confirmed by a daily close above the swing high at $64.67 (B). That close also confirmed a rising ABCD pattern that shows an initial target at $68.98. At that price the two rising measured moves, labeled AB and CD, will show symmetry as the change in price for the CD leg will match what was seen in the AB advance. A potential key pivot level would therefore be identified.
But what makes that price zone interesting is not just the ABCD pattern target. There are two other price levels identified nearby. The 78.6% Fibonacci retracement is at $68.79, and the 200-Day MA is now at $68.98. Sometimes, when there is a confluence of indicators pointing to a similar price area, that area can act like a magnet and attract the price towards it. Whether it is eventually reached or not, it does show higher potential.
Furthermore, a double bottom trend reversal pattern confirmed on Monday with a rally above $65.32, the swing high from late April. That swing high ended the first rally following the April swing low at $55.23. Since the trend reversal pattern just triggered, there is strong potential for further upside, unless the breakout shows signs of failure. And that would only begin to be seen on a drop below the 20-Day MA, now at $62,73.
For a look at all of today’s economic events, check out our economic calendar.
The British pound soared to its highest level since October 2021 against the US dollar, closing the week with a firm 2% gain above the 1.3700 mark. It was a seventh consecutive daily gain for the pair.
The rally was fueled by broader dollar weakness, easing geopolitical worries in the Middle East, and speculations around the Fed’s policy outlook.
–Are you interested in learning more about MT5 brokers? Check our detailed guide-
The GBP/USD pair started the week with a bearish gap as investors fled to the safe-haven dollar in the wake of America’s attacks on three nuclear sites of Iran. The fear of further escalation after Iran’s warning weighed on the pound and other riskier assets. However, a swift ceasefire restored the peace, and the US dollar collapsed, lending room to the pound buyers.
The Fed’s policy outlook also contributed to the dollar’s further decline. Markets are now pricing in a 21% probability for a July cut and75% for the September cut, driven by dovish commentary from the Fed’s Bowman and Waller. However, Fed Chair Powell maintained a cautious tone due to Trump’s tariffs, which may reignite inflation. However, Trump’s criticism of the Fed, accompanied by a threat to replace the chairman as soon as September, created chaos, resulting in a further sell-off of the US dollar.
The US economic data also reinforced the dovish narrative. The Q1 GDP showed a contraction of 0.5%, but Durable Goods Orders surprised to the upside. On Friday, the Core PCE Index came in at 2.7% y/y, slightly above the estimate, providing a mild bid to the dollar but not enough to offset the broader bearish momentum.
On the UK side, the pound found relative stability due to improved economic sentiment and better business activity.
There is no significant data from the UK next week. However, the markets will be closely watching the US labor market data and the Fed Chair’s speech. The ADP employment is expected to tick up to 105,000 from the previous 37,000 modestly. But the NFP print may continue its decline to 120k from the last 139k. Meanwhile, the unemployment rate may also slightly rise to 4.3%.
In addition to these, US Manufacturing/Services PMIs and JOLTs data are also due next week, which may provide impetus to the market.
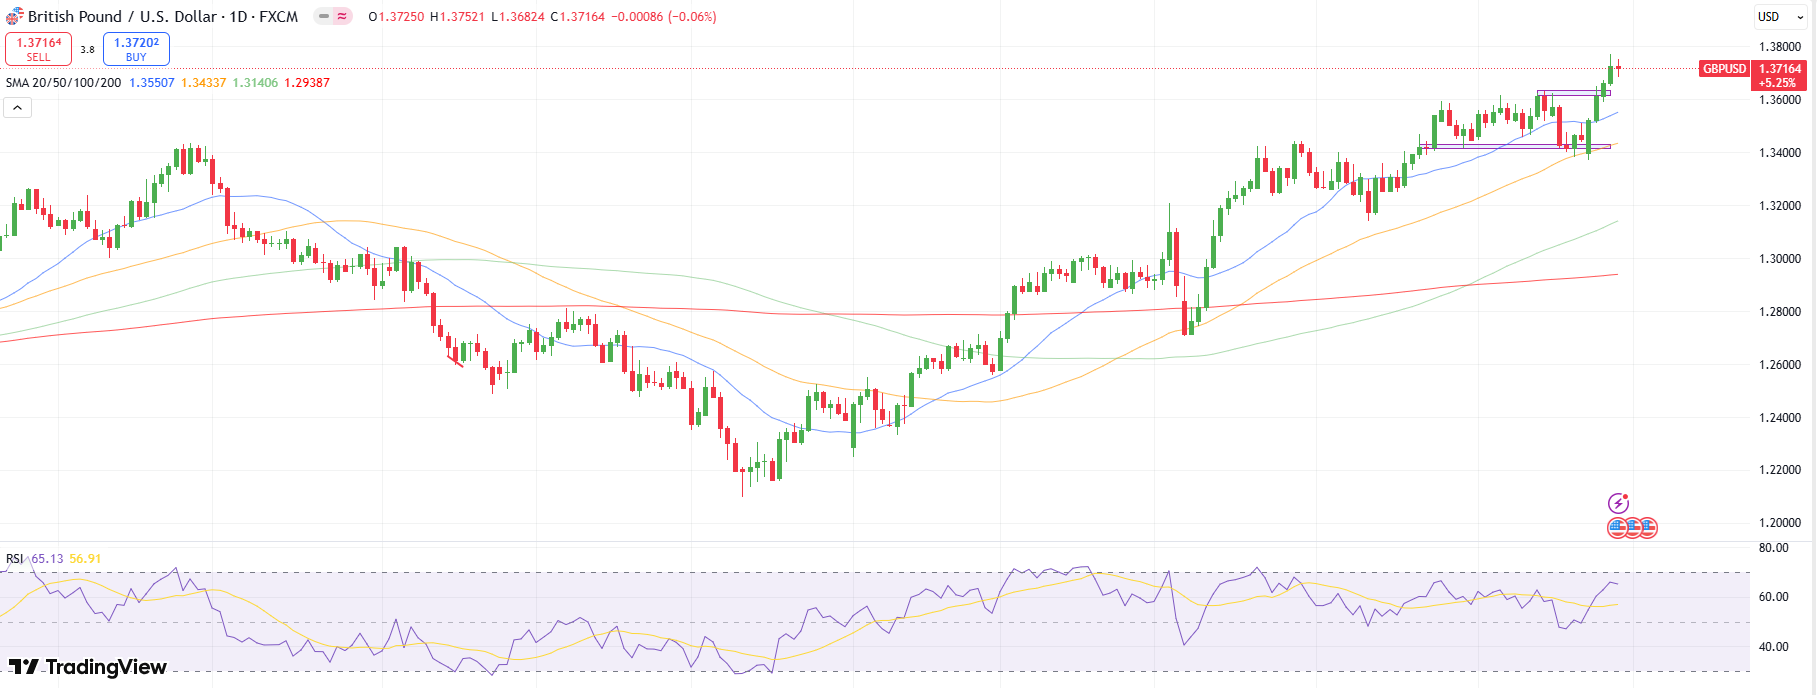
The daily chart for the GBP/USD shows a strong bullish momentum, lying well above the key moving averages. However, the price could not hold onto the weekly highs of 1.3770 and corrected downwards. But the 1.3700 continues to support the upside. Meanwhile, the 20-day SMA is at 1.3555, which is almost 150 pips down from the current price. The overextended rally may see some consolidation and reversion to the 20-day SMA before a bullish continuation.
–Are you interested in learning more about forex signals telegram groups? Check our detailed guide-
The daily RSI is still below the overbought territory, which means further gains cannot be ruled out. The pair may test its weekly top at 1.3770 ahead of 1.3800. The ultimate bullish target lies at 1.4000.
Looking to trade forex now? Invest at eToro!
68% of retail investor accounts lose money when trading CFDs with this provider. You should consider whether you can afford to take the high risk of losing your money.
Nonetheless, gold remains above support of a declining trendline and above a prior interim swing low of $3,245, which is part of the price structure of the short-term uptrend. A drop below that level would further confirm bearish price behavior. Gold has been declining for 10 days and therefore has exceeded previous pullbacks in time since the early-November 2024 bearish correction. That is an indication of sellers dominating but also a sign that the pullback is getting closer to possibly completing. However, if the decline exceeds 12 days, as seen in November, a deeper correction may be in the works.
It is also interesting to note that the market seems to be recognizing support around the intersection of two rising and one falling trendlines around $3,272. Gold is currently trading around that price level and therefore could close at it or slightly above. When stepping back gold can be seen in a consolidation phase for the past two months or so. This can be seen relatively clearly on a monthly chart (not shown).
For most of June the price of gold has remained with the price range of May, which is within the price range of April. Therefore, June looks likely to complete two inside months. Although June exceeded May’s high briefly, the breakout quickly failed. Moreover, June’s closing price looks likely to be near the low of the month, which is today’s low of $3,256.
For a look at all of today’s economic events, check out our economic calendar.