The main category of Forex News.
You can use the search box below to find what you need.
[wd_asp id=1]
The main category of Forex News.
You can use the search box below to find what you need.
[wd_asp id=1]
Spot Gold hovers near $3,330 a troy ounce, posting a modest intraday advance at the beginning of the week. XAU/USD recovered from an early low at $3,293.51 and advances after Wall Street’s opening amid renewed US Dollar (USD) weakness and a cautious mood.
Market players await news from trade talks as the United States (US) and China resumed negotiations. Top representatives from Washington and Beijing gather in London to discuss next steps. In the meantime, the Wall Street Journal reported market talks indicating US President Donald Trump authorized Treasury Secretary Scott Bessent to negotiate lifting some of the recent restrictions on a variety of products to China. Trump’s goal is to clinch a deal on rare earth minerals coming from China.
Earlier in the day, China reported a Trade Balance surplus of $103.22 billion in May, with Exports slowing to 4.8% year-on-year (YoY) down from the 8.1% posted in April. Imports shrank even further, down by 3.4% in the same period after shedding 0.2% in the year to April 2025.
Meanwhile, a holiday in Europe kept most pairs within familiar levels on Monday, with the bright metal being no exception. In fact, the macroeconomic calendar has little to offer until Wednesday, when the US will publish the May Consumer Price Index (CPI). Financial markets anticipate a modest uptick in the annual reading, not enough to twist the Federal Reserve’s (Fed) monetary policy stance,
From a technical point of view, the daily chart for the XAU/USD pair shows it bounced from around a flat 20 Simple Moving Average (SMA) at $3,295, while the 100 and 200 SMAs maintain their strong bullish slopes far below the shorter one, in line with the dominant upward trend. At the same time, the Momentum indicator eases within positive levels, reflecting the limited buying interest rather than suggesting a steeper decline ahead. The Relative Strength Index (RSI) indicator hovers at around 52, failing to provide clear directional clues, yet overall suggesting sellers are not interested.
In the near term, XAU/USD aims to extend its recovery, but lacks conviction. The 4-hour chart shows technical indicators recovering within negative levels, still below their midlines. At the same time, the pair is developing below a mildly bearish 20 SMA, yet a mildly bullish 100 SMA advances beyond the 200 SMA while providing near-term support at around $3,3310.
Support levels: 3,310.00 3,295.00 3,278.10
Resistance levels: 3,332.50 3,345.20 3,361.95
The Silver (XAG/USD) price trades in positive territory around $36.00 during the Asian session on Monday. The white metal edges higher despite the stronger-than-expected US employment data for May. Later on Monday, investors will closely watch the developments surrounding US-China trade talks.
Geopolitical and economic uncertainty could provide some support to the Silver price as investors seek more holdings in safe-haven assets. US Treasury Secretary Scott Bessent, Commerce Secretary Howard Lutnick, and Trade Representative Jamieson Greer are set to speak with Chinese officials about trade talks.
Furthermore, industrial demand for applications such as solar panels contributes to the Silver’s upside. The Silver Institute estimated the metal’s supply was 15% below demand in 2024 and is projected to see another deficit in 2025.
On the other hand, the upbeat US May employment report gave the US Federal Reserve (Fed) a way to caution ahead of US-China trade talks, which are set to take place in London later in the day. This, in turn, might boost the Greenback and weigh on the USD-denominated commodities price. Federal Fund Futures pointed to a larger possibility that the Fed may keep its benchmark interest rate steady until the September monetary policy meetings.
(This story was corrected on June 9 at 06:55 GMT, to say in the third paragraph that industrial demand for applications such as solar panels contributes to the Silver’s upside, not the USD’s upside.)
Silver is a precious metal highly traded among investors. It has been historically used as a store of value and a medium of exchange. Although less popular than Gold, traders may turn to Silver to diversify their investment portfolio, for its intrinsic value or as a potential hedge during high-inflation periods. Investors can buy physical Silver, in coins or in bars, or trade it through vehicles such as Exchange Traded Funds, which track its price on international markets.
Silver prices can move due to a wide range of factors. Geopolitical instability or fears of a deep recession can make Silver price escalate due to its safe-haven status, although to a lesser extent than Gold’s. As a yieldless asset, Silver tends to rise with lower interest rates. Its moves also depend on how the US Dollar (USD) behaves as the asset is priced in dollars (XAG/USD). A strong Dollar tends to keep the price of Silver at bay, whereas a weaker Dollar is likely to propel prices up. Other factors such as investment demand, mining supply – Silver is much more abundant than Gold – and recycling rates can also affect prices.
Silver is widely used in industry, particularly in sectors such as electronics or solar energy, as it has one of the highest electric conductivity of all metals – more than Copper and Gold. A surge in demand can increase prices, while a decline tends to lower them. Dynamics in the US, Chinese and Indian economies can also contribute to price swings: for the US and particularly China, their big industrial sectors use Silver in various processes; in India, consumers’ demand for the precious metal for jewellery also plays a key role in setting prices.
Silver prices tend to follow Gold’s moves. When Gold prices rise, Silver typically follows suit, as their status as safe-haven assets is similar. The Gold/Silver ratio, which shows the number of ounces of Silver needed to equal the value of one ounce of Gold, may help to determine the relative valuation between both metals. Some investors may consider a high ratio as an indicator that Silver is undervalued, or Gold is overvalued. On the contrary, a low ratio might suggest that Gold is undervalued relative to Silver.
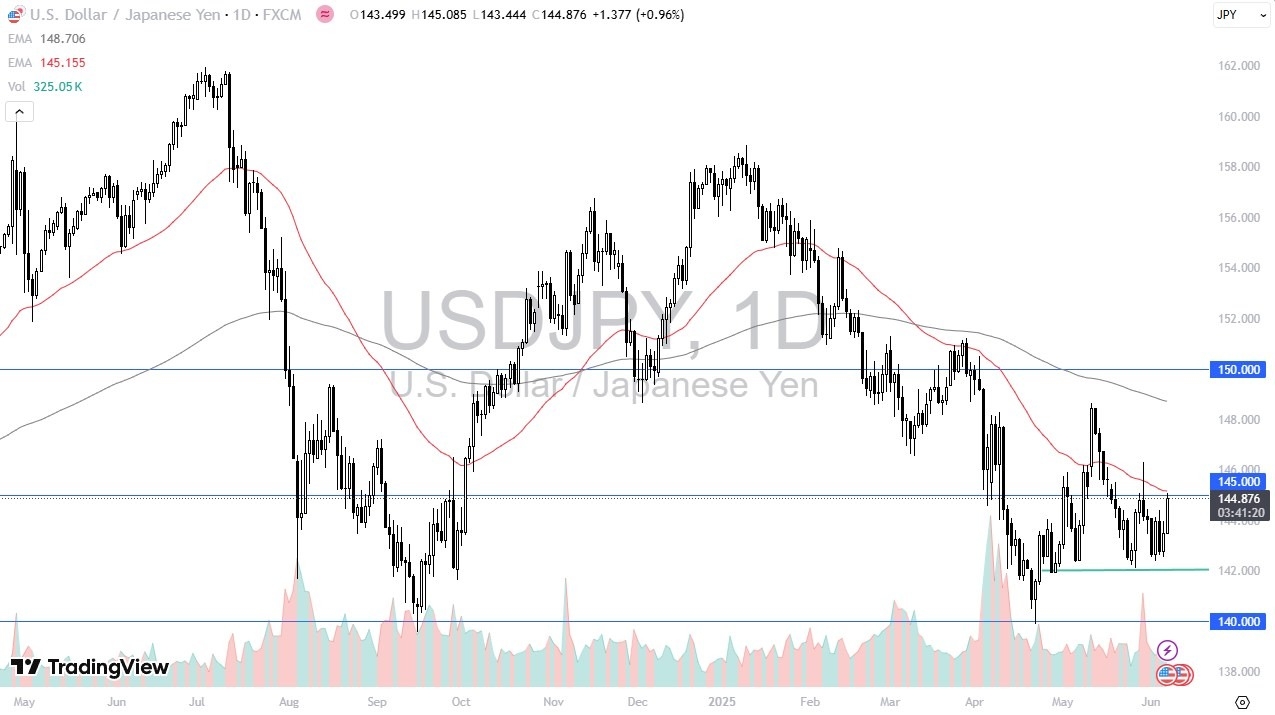
The US dollar has fallen a bit against the Japanese yen during the early hours here on Monday as well. And this makes a bit of sense. The 145 yen level has been resistant multiple times. And of course, we’ve had the 50-day EMA sitting right here offering resistance as well. So, with this, we’re basically at the top of the short-term range.
If we can break out above the 50 day EMA, then we will challenge the 146 level. And then after that, we could really start to break out towards the 200 day EMA. In the meantime, though, I think we’re just still building a base and it’s going to take some time, and we may go sideways for a little bit.
The Australian dollar has rallied again during the early hours on Monday as it continues to pressure the resistance just above, but it just seemingly can’t quite get above it. This is an area that I’ll be watching very closely in the form of 0.6550. And I think this could be a fairly important level. But as you can see, we’ve attempted multiple times now and we are starting to pull back again as we got there. So, I’ll be watching this.
Certainly, this pair looks to be tilting higher, but we just haven’t had enough pressure to make it truly break out to the upside. So, I think this is a pair that is probably more or less a scalping pair or one that you’ll just be watching for a while until it makes a definitive move.
For a look at all of today’s economic events, check out our economic calendar.
Buying pressure in gold subsided on Friday last week, as gold dropped more than 1000 points from $3403, courtesy of the NFP data favoring the U.S. dollar.
Russia has launched one of the war’s largest air attacks, and this news may bring more inflow into gold, and prices may rise.
The bias in gold is still buy, and the price has already tapped its buying levels. Let’s discuss the key pivot levels for gold buying and selling in this XAUUSD weekly forecast from June 9th to June 13th, 2025.
In the previous week’s forecast, we marked the weekly level and the opening gap in gold from where the price has moved up 236 points so far.
Now let’s start by discussing the key economic events of this week and their possible impact on the price of XAUUSD.
Some significant U.S. economic reports are scheduled for release this week that are expected to impact XAUUSD.
Wednesday, June 11: CPI Information
Thursday, June 12: Jobs & PPI Data:
Friday, June 13: UoM Information
The HTF level in gold has formed a significant range, with the high end at $3357 and the low end at $3193. A breakout of either side and a retest will confirm the direction of gold in the coming weeks for medium-long-term investors.

Gold is currently bullish in 4h timeframes and above. However, it is showing bearish momentum in 1h and below. Currently, gold is rising after reaching a crucial point of interest (POI), as discussed above. Losing the marked support on the chart below can push it to internal liquidity of $3245, while a breakout above can take it to the external liquidity of $3403.

The first selling opportunity in gold is the golden zone of fib 0.5-0.618 level, which is coming around $3335-$3344, and this level is also the breaker block of the big range gold has broken to the downside. Meanwhile, the second selling opportunity is the POC and the VAH of the ongoing bearish swing, which is coming around $3357-3369.

To conclude, gold can give both buys and sells this week. Lower time frames are suggesting sells, while higher time frames are still favoring a buy position in gold.
Disclosure: This article does not represent investment advice. The content and materials featured on this page are for educational purposes only.
With Bond yields rising in America, it makes the US dollar much more attractive, and then you also have to pay close attention to the fact that the Japanese bond market is an absolute disaster. We’ve had a couple of days recently that the Bank of Japan was unable to find buyers of government debt, and if that’s the case, the Bank of Japan will more likely than not have to step in and start buying bonds, which is essentially the same thing as quantitative easing.

The technical analysis for this market is obviously somewhat noisy, as we are going sideways in general, but we are testing the crucial 50 Day EMA. The 50 Day EMA is of course an indicator that a lot of people will pay close attention to as it is a major trend defining indicator most of the time. This is a market that I think given enough time will probably break out to the upside I have been suggesting that for a while, and the Friday candlestick might be the beginning of chewing through the massive resistance. This of course opens up the possibility of a move to much higher levels, and if we do have that happen, I would anticipate that the ¥148 level would be the target. On the downside, as long as we can stay above the ¥142 level, I think you have a real shot at continuing to consolidate overall with more of an upward bias.
Want to trade our USD/JPY forex analysis and predictions? Here’s a list of forex brokers in Japan to check out.
Christopher Lewis has been trading Forex and has over 20 years experience in financial markets. Chris has been a regular contributor to Daily Forex since the early days of the site. He writes about Forex for several online publications, including FX Empire, Investing.com, and his own site, aptly named The Trader Guy. Chris favours technical analysis methods to identify his trades and likes to trade equity indices and commodities as well as Forex. He favours a longer-term trading style, and his trades often last for days or weeks.
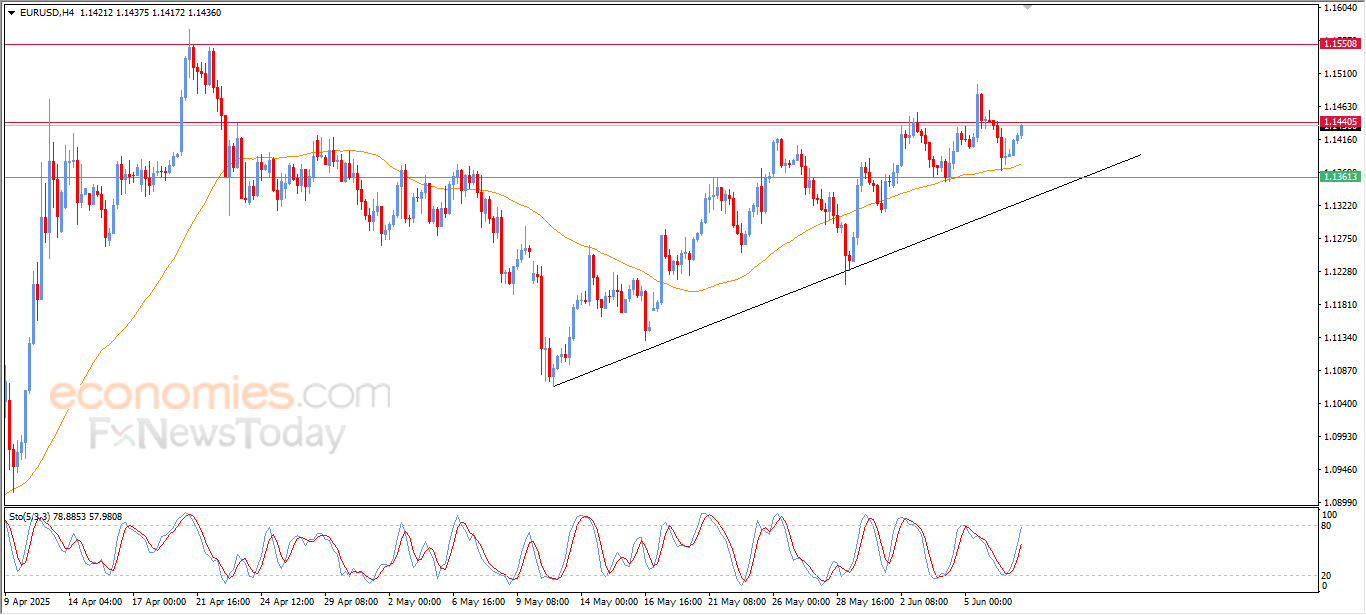
The price of (EURUSD) rose in its recent intraday trading, supported by the emergence of positive signals from the (RSI), after it declined from clear oversold levels, providing bullish momentum, reinforced by the continuation of the trading above the EMA50, besides the stability of the price with a bullish trend line on the short-term basis, alongside a minor supported bias.
This technical support pushed the pair to attack the critical resistance level at 1.1440, which represents an important technical barrier that might limit the next trend, where the price success to confirm breaching this level might open the way towards extending the bullish wave on the near- term basis.
This week, forex market trading will primarily focus on the results of trade talks between the United States and China. Meanwhile, the EUR/USD is still in an upward trend, and technically, the 200-hour moving average, currently observed at the 1.1377 support level, is helping to limit declines. According to performance across trusted brokerage platforms, the US Dollar Index (DXY), which measures the US currency’s performance against a basket of other major currencies, has fallen as investors prepare for a busy week of key economic data and trade developments.
Overall, sentiment has been affected by renewed hopes for progress in US-China trade relations. US President Donald Trump announced that officials from both countries will meet in London later today, following a recent phone call with Chinese President Xi Jinping.
We still recommend selling the EUR/USD pair on any upward bounce, while constantly monitoring market factors and avoiding risk, regardless of the strength of the trading opportunities.
Regarding economic data, markets are awaiting several key releases according to the economic calendar. The Consumer Price Index (CPI) is scheduled for Wednesday at 3:30 PM EEST, followed by the Producer Price Index (PPI) and the US University of Michigan Consumer Confidence report on Friday. These figures could offer new insights into how tariffs are impacting inflation and broader economic conditions.
According to forex market trading, the US dollar rose last Friday after the US jobs report for May showed slightly stronger-than-expected employment growth, although private sector employment, jobless claims, and services data pointed to some weakness in the economy.
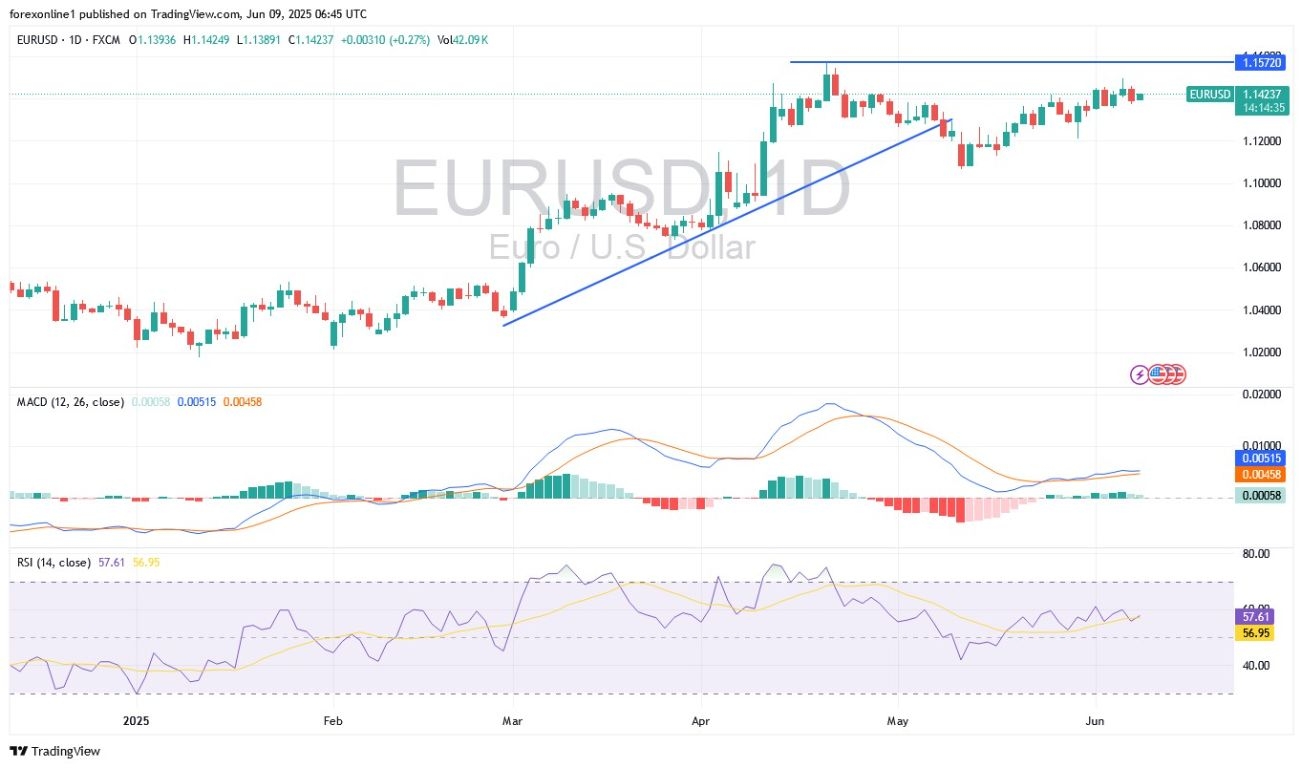
Based on the daily timeframe chart, the overall trend for the EUR/USD currency pair is upward. As we mentioned before, the 1.1400 resistance will continue to motivate the bulls for further advances. Recent gains have moved the 14-day Relative Strength Index (RSI) away from the midline, and the indicator still has more time and potential for gains before reaching overbought territory. At the same time, the MACD indicator lines are strongly trending upwards. Bulls’ attention is now on the psychological 1.1500 resistance. Decisively, Euro-dollar trading will remain within its current range until markets and investors react to the US-China trade talks and this week’s important US economic data releases.
Ready to trade our daily Forex analysis? We’ve made a list of the best forex demo accounts worth trading with.
The GBPJPY pair succeeded in taking advantage of the main indicator’s positiveness, forming a strong bullish rally, achieving the previously suggested targets by reaching 196.18, forming a temporary negative rebound, in order to catch its breath before forming a new bullish attack.
The bullish track will remain valid, depending on the stability of the support near 194.20, besides the continuation of providing positive momentum by the main indicators, to expect surpassing 196.30 and reaching the next target at 197.35, to face 61.8%Fibonacci correction level.
The expected trading range for today is between 195.25 and 197.35
Trend forecast: Bullish
The GBPJPY pair succeeded in taking advantage of the main indicator’s positiveness, forming a strong bullish rally, achieving the previously suggested targets by reaching 196.18, forming a temporary negative rebound, in order to catch its breath before forming a new bullish attack.
The bullish track will remain valid, depending on the stability of the support near 194.20, besides the continuation of providing positive momentum by the main indicators, to expect surpassing 196.30 and reaching the next target at 197.35, to face 61.8%Fibonacci correction level.
The expected trading range for today is between 195.25 and 197.35
Trend forecast: Bullish
The GBPJPY pair succeeded in taking advantage of the main indicator’s positiveness, forming a strong bullish rally, achieving the previously suggested targets by reaching 196.18, forming a temporary negative rebound, in order to catch its breath before forming a new bullish attack.
The bullish track will remain valid, depending on the stability of the support near 194.20, besides the continuation of providing positive momentum by the main indicators, to expect surpassing 196.30 and reaching the next target at 197.35, to face 61.8%Fibonacci correction level.
The expected trading range for today is between 195.25 and 197.35
Trend forecast: Bullish