The main category of Forex News.
You can use the search box below to find what you need.
[wd_asp id=1]
The main category of Forex News.
You can use the search box below to find what you need.
[wd_asp id=1]
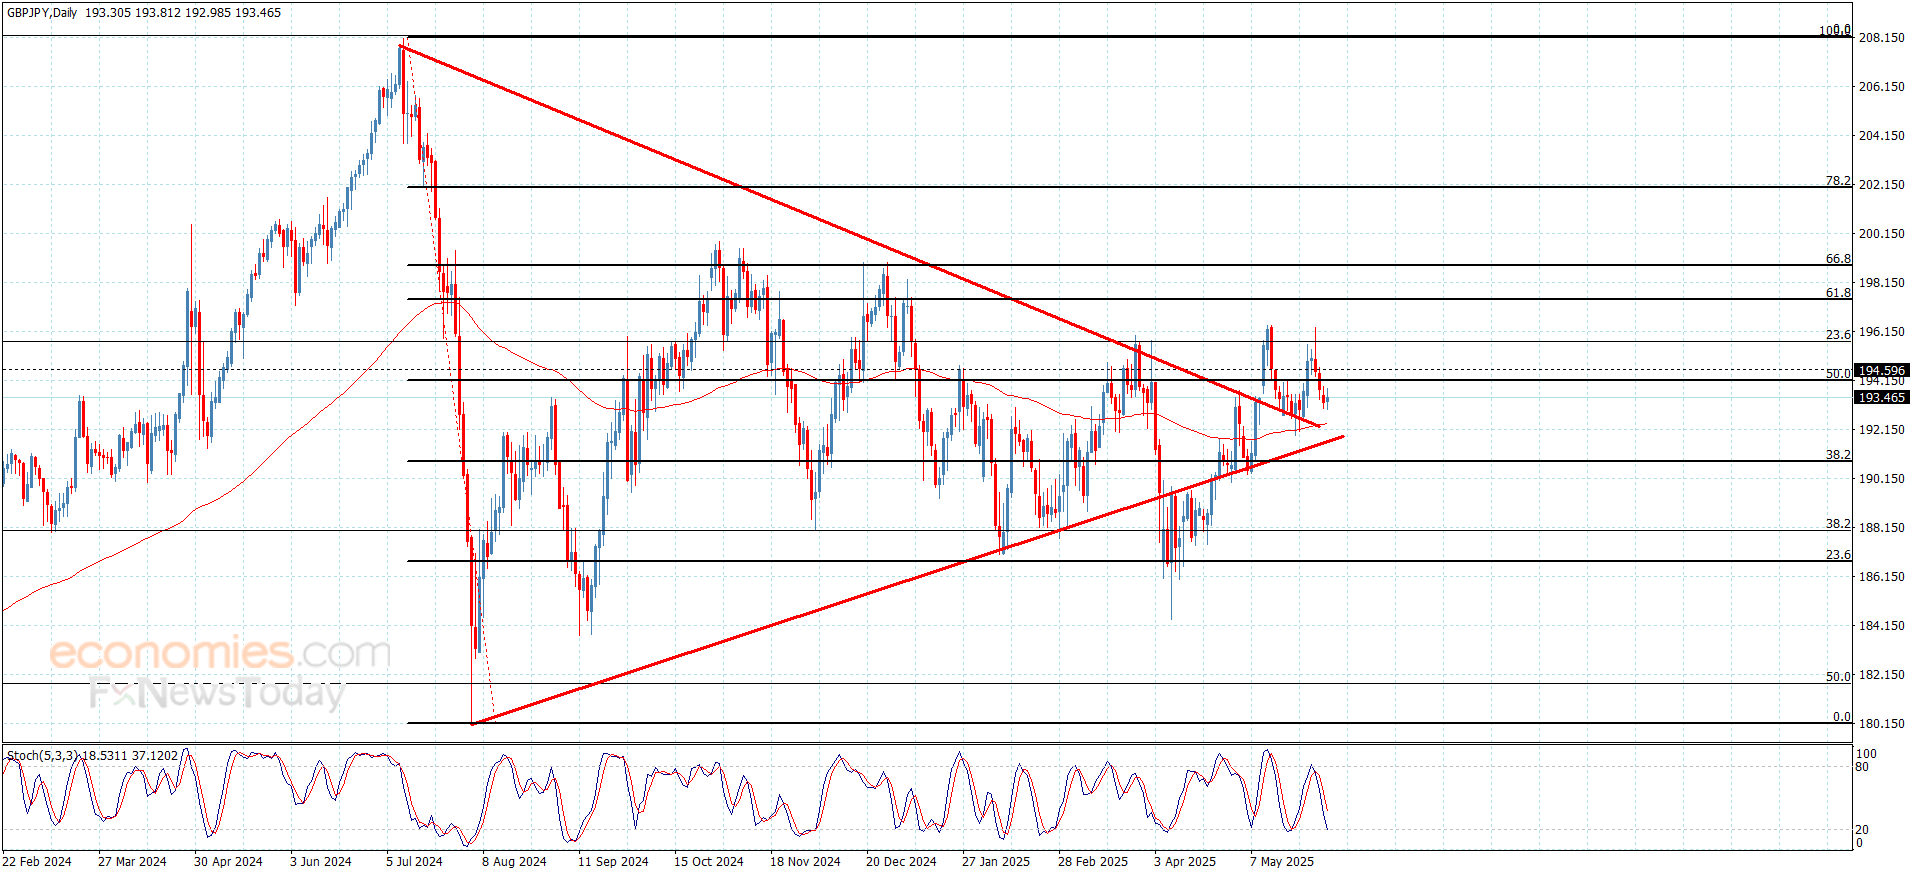
The GBPJPY pair formed more of the slow bearish waves, confirming their surrender to the suggested bearish scenario, by moving away from the barrier at 194.55 level, to repeat the pressure on the intraday obstacle at 192.90.
The continuation of providing negative momentum by stochastic will assist in forming an extra decline to target 192.35 level, reaching the main support at 191.70, while breaching the mentioned barrier will cancel the negative suggestion, to provide the price a chance to renew the bullish attempts by its rally towards 195.20 initially.
The expected trading range for today is between 192.35 and 194.20
Trend forecast: Bearish
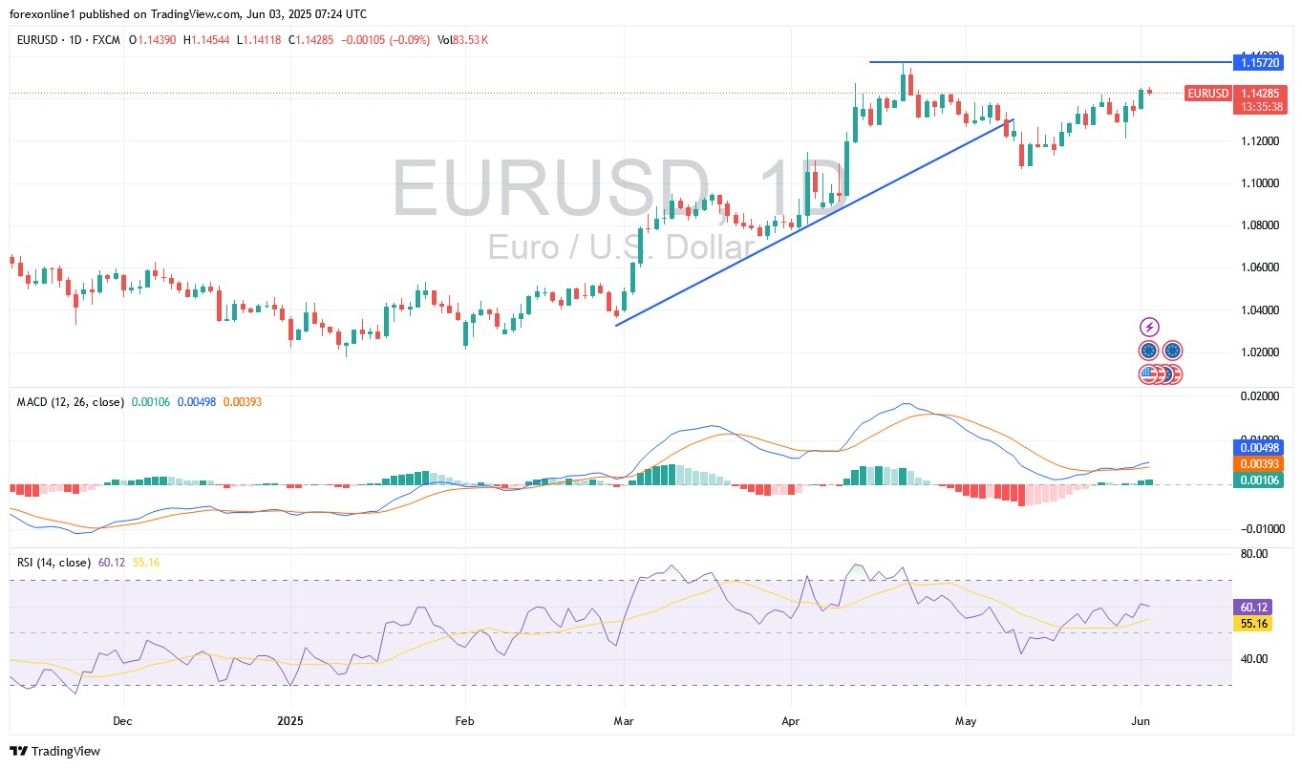
The fate of tariffs between the European Union and the United States continues to dictate the trading direction of the EUR/USD in the coming days. The start of the US jobs report week was bullish, with the Euro-Dollar jumping towards the 1.1450 resistance level, near the pair’s five-week high, before settling around 1.1424 at the time of writing, awaiting further developments.

According to trusted brokerage platforms, Euro trading is experiencing a notable rise with renewed global trade uncertainty due to Donald Trump. Technically, the EUR/USD gains have pushed performance past a chart resistance line at 1.1418, opening the door for a rise to 1.1450, a target we consider suitable for this week’s forecast. However, today’s close must be above the 1.1418 resistance level to confirm its breach, and a retracement during the day is possible. Currency exchange rates tend to remain in contact with the nine-day moving average, implying a slight rebound is possible before the rally resumes. Overall, the EUR/USD has returned to its strong trajectory, and the stronger path is upward in the coming days, driven by a compelling fundamental narrative surrounding escalating global trade tensions.
US President Donald Trump must have been influenced by the calm that followed the US-China trade agreement in early May, as he now accuses China of violating this agreement. Furthermore, after markets closed on Friday, the US president raised tariffs on aluminium and steel. Overall, uncertainty surrounding tariffs has escalated again following Trump’s announcement on Friday evening that he would double tariffs on steel and aluminium, to 50%, effective June 4. Consequently, the EUR/USD pair has returned above 1.1350, US bond yields are seeing a significant increase, while stock futures are seeing a significant decline.
Please keep in mind that the current rise in the Euro’s price is part of the traditional market reaction to escalating tariff tensions. Meanwhile, Trump’s reminder of his support for tariffs and his dissatisfaction with the US trade balance will support the 2025 bullish trend for the foreseeable future. Also, we would not be surprised if the EUR/USD records new record highs as a result.
Be cautious: Tariffs pose a problem for the dollar as they will undermine US economic growth. The problem is that the US economy is still performing well, undermining this premise. Sooner or later, data will begin to show the type of weakness that US dollar sellers have anticipated in recent months. The June data schedule is important because it provides data covering a period that will certainly embody trade uncertainty. With strong demand for the US dollar, large movements will be in response to better-than-expected data that challenges gloomy forecasts, leading to an unbalanced upward reversal for the US dollar (i.e., a drop in the EUR/USD).
We still advise selling the Euro against the US Dollar on every strong upward rebound, but without taking risks and while monitoring the factors influencing the trading of this currency pair this week.
Besides the fate of tariffs, everyone will be cautiously awaiting the crucial US Non-Farm Payrolls figures on Friday. The consensus expects a 125,000 job increase in May, with a decline in private sector jobs and indications of job losses in the manufacturing sector. The country’s unemployment rate is expected to remain stable at 4.2%. According to currency experts, if the unemployment rate rises more than expected, we believe the market reaction could be swift. Consequently, the dollar and bond yields are likely to fall as the market rushes to price in data-dependent Federal Reserve interest rate cuts.
Don’t forget the European Central Bank meeting next Thursday. Although the US dollar’s interest rate is undoubtedly the most important factor, we expect some short-term volatility around the decision. A 25-basis point rate cut is expected to lower the key interest rate to 2.0%. The cut itself is not the decisive factor, but rather the forward guidance that will move the exchange rate. With inflationary pressures subsiding in the Eurozone, there is little incentive for President Christine Lagarde to disregard further interest rate cuts, especially if the ECB believes that US tariffs will negatively impact future growth.
Overall, the continuous flow of cuts is expected to benefit the Eurozone economy, but it will hinder the Euro’s progress. Lagarde is very likely to stick to her usual message: that interest rates are not on a predetermined path and that the ECB remains data dependent. This means more cuts are coming, but there is no need to anticipate a faster pace, nor to bet on more cuts later beyond what is already expected. This will provide limited opportunity to guide Euro exchange rates in any meaningful direction, and movements following the ECB decision are likely to fade as a result.
Ready to trade our Forex daily forecast? We’ve shortlisted the best forex broker list for you to check out.
Silver prices (XAG/USD) are trading lower on Tuesday’s European session, weighed by a somewhat firmer US Dollar, as the risk-off mood witnessed on Monday seems to have eased.
The precious metal hit fresh six-month highs on Monday, with the US Dollar hammered by renewed tariff concerns and downbeat US data. The US Manufacturing PMI confirmed the negative impact of tariffs on factory activity and pushed the US Dollar to fresh multi-month lows.
From a wider perspective, price action remains positive. The reversal from $34.75 has been contained at the 34.00 round level, above the previous resistance, now a potential support area, at $33.70.
On the upside, the area between $34.75 and $35.00 contains several resistance levels (October 23 and June 4 highs), and the 161.8% Fibonacci extension of the Mid may rally, and might be a tough nut to crack.
Above here, a late 2012 peak lies at $35.40. The 261.8% Fiboinnacci retracement is at $37.00.
On the downside, immediate support is at the mentioned $33.70 and then at the $32.65-$32.75 zone.
.
(This story was corrected on June 3 at 08:43 GMT to say that the 261.8% Fiboinnacci retracement is at $37.00, not the 2611.8% retracement.)
Silver is a precious metal highly traded among investors. It has been historically used as a store of value and a medium of exchange. Although less popular than Gold, traders may turn to Silver to diversify their investment portfolio, for its intrinsic value or as a potential hedge during high-inflation periods. Investors can buy physical Silver, in coins or in bars, or trade it through vehicles such as Exchange Traded Funds, which track its price on international markets.
Silver prices can move due to a wide range of factors. Geopolitical instability or fears of a deep recession can make Silver price escalate due to its safe-haven status, although to a lesser extent than Gold’s. As a yieldless asset, Silver tends to rise with lower interest rates. Its moves also depend on how the US Dollar (USD) behaves as the asset is priced in dollars (XAG/USD). A strong Dollar tends to keep the price of Silver at bay, whereas a weaker Dollar is likely to propel prices up. Other factors such as investment demand, mining supply – Silver is much more abundant than Gold – and recycling rates can also affect prices.
Silver is widely used in industry, particularly in sectors such as electronics or solar energy, as it has one of the highest electric conductivity of all metals – more than Copper and Gold. A surge in demand can increase prices, while a decline tends to lower them. Dynamics in the US, Chinese and Indian economies can also contribute to price swings: for the US and particularly China, their big industrial sectors use Silver in various processes; in India, consumers’ demand for the precious metal for jewellery also plays a key role in setting prices.
Silver prices tend to follow Gold’s moves. When Gold prices rise, Silver typically follows suit, as their status as safe-haven assets is similar. The Gold/Silver ratio, which shows the number of ounces of Silver needed to equal the value of one ounce of Gold, may help to determine the relative valuation between both metals. Some investors may consider a high ratio as an indicator that Silver is undervalued, or Gold is overvalued. On the contrary, a low ratio might suggest that Gold is undervalued relative to Silver.
The GBPJPY pair formed more of the slow bearish waves, confirming their surrender to the suggested bearish scenario, by moving away from the barrier at 194.55 level, to repeat the pressure on the intraday obstacle at 192.90.
The continuation of providing negative momentum by stochastic will assist in forming an extra decline to target 192.35 level, reaching the main support at 191.70, while breaching the mentioned barrier will cancel the negative suggestion, to provide the price a chance to renew the bullish attempts by its rally towards 195.20 initially.
The expected trading range for today is between 192.35 and 194.20
Trend forecast: Bearish
Despite the pullback, gold’s downside was limited. “Persistent concerns about trade disruptions and expectations of Federal Reserve rate cuts have helped stabilize gold prices,” said a commodities strategist at a Hong Kong-based brokerage.
Silver (XAG/USD) traded at $34.79 per ounce, reflecting modest losses as the precious metal followed gold’s trajectory. The dip comes amid an uptick in risk sentiment, as investors rotated into equities. However, expectations of Fed easing and sustained global uncertainties have kept silver’s downside in check.
Market expectations lean toward the Federal Reserve delivering at least two rate cuts in 2025, a view bolstered by recent comments from Fed officials. Traders now await key US economic releases, including the JOLTS Job Openings report and Friday’s Nonfarm Payrolls (NFP) data, which could influence both the dollar and precious metals.
“While stronger-than-expected US jobs data may lift the dollar in the near term, the overarching narrative of a dovish Fed remains supportive for gold and silver,” noted an analyst at a Singapore-based investment firm.
With geopolitical tensions and trade uncertainties persisting, the broader market sentiment remains favorably inclined towards safe-haven assets, positioning gold and silver as key beneficiaries in a volatile global environment.
Gold consolidates near $3,360, eyeing a breakout above $3,365. Silver holds support at $34.41; a push above $34.79 could target $35.50. Key levels hint at swift moves.
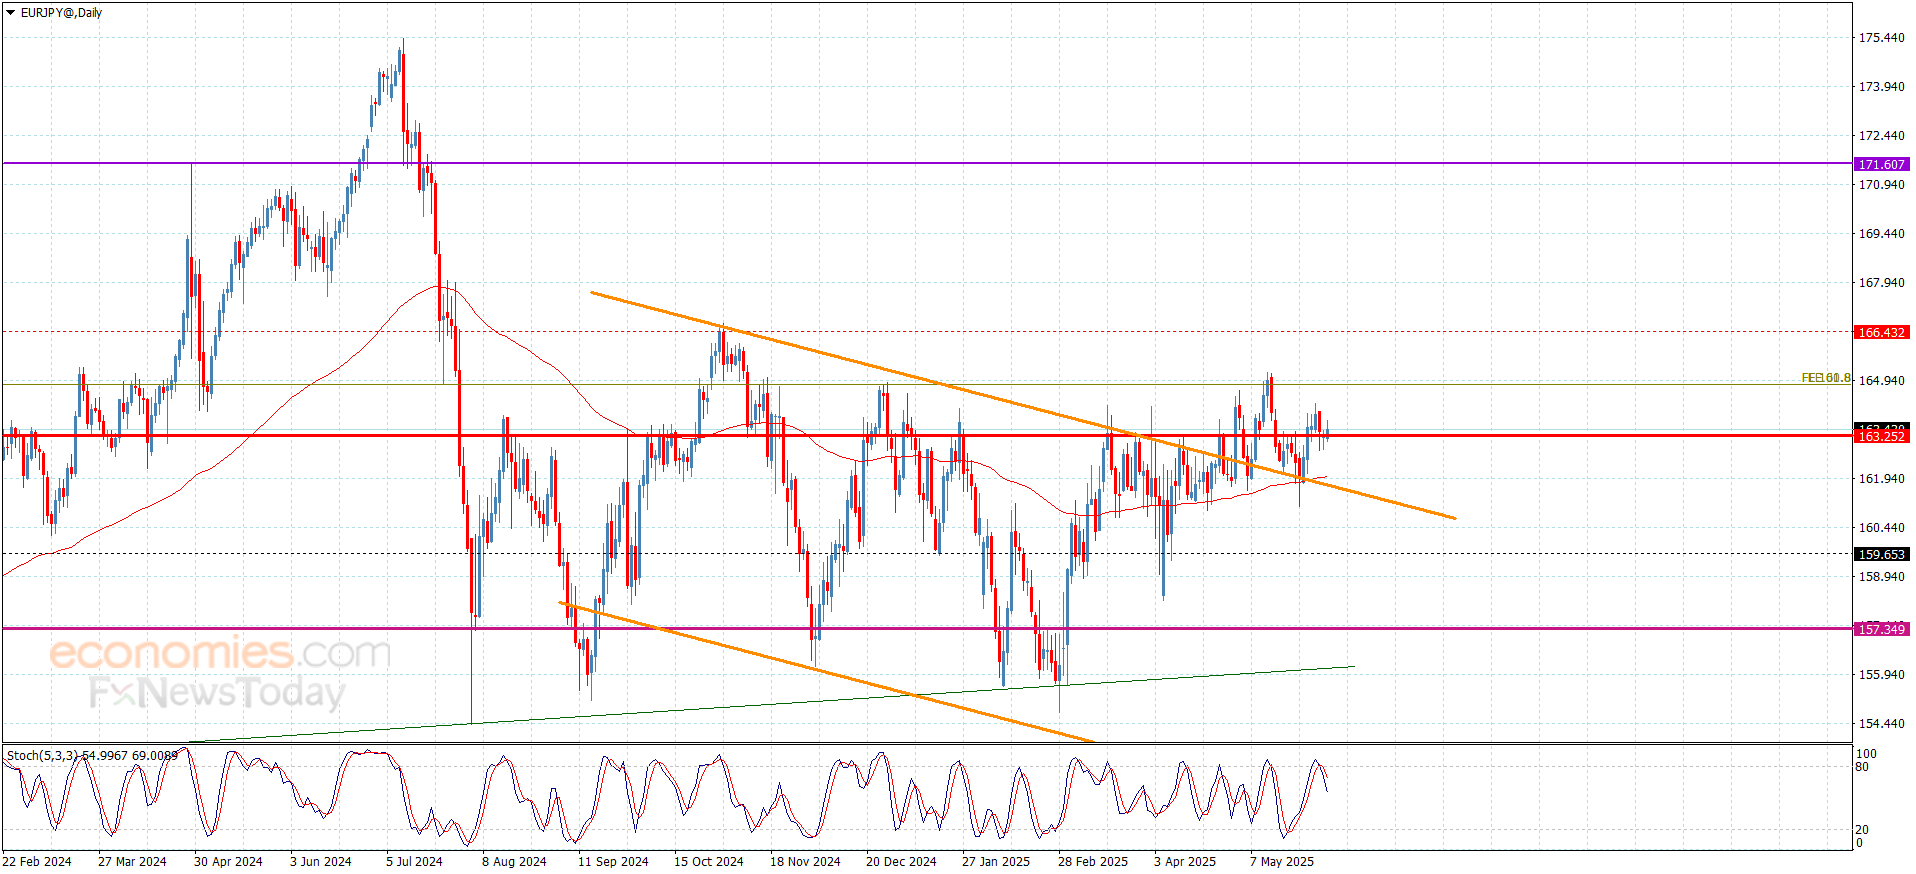
The technical analysis for this EUR/JPY pair is somewhat bullish, but it is contained within a very well defined consolidation range. The ¥165 level continues to be an area worth watching, as it had been a significant resistance barrier before, and of course it is an area that seen a lot of market memory attached to it in the past. If we can break above that level, then I do think that the euro has a real shot at going much higher against the Japanese yen, but I would point out that this is probably a move that would be more about the Japanese yen than anything else.
On the other hand, if we do fall from here, it’s worth noting that the 50 Day EMA’s is just below, and then underneath there we have the 200 Day EMA which is currently right around the ¥162 level. The market breaking down below that level would be very negative, and it could open up the possibility of a drop toward the ¥155 level, but at this point in time it doesn’t look like we have any real appetite to start buying the yen. Because of this, I think we remain a little bit more “risk on” than would be required for the Japanese yen to suddenly strengthen, and with that I look at the short term pullbacks along the way as potential buying opportunities in this pair.
Begin trading our daily forecasts and analysis. Here is a list of Forex brokers in Japan to work with.
Christopher Lewis has been trading Forex and has over 20 years experience in financial markets. Chris has been a regular contributor to Daily Forex since the early days of the site. He writes about Forex for several online publications, including FX Empire, Investing.com, and his own site, aptly named The Trader Guy. Chris favours technical analysis methods to identify his trades and likes to trade equity indices and commodities as well as Forex. He favours a longer-term trading style, and his trades often last for days or weeks.
Natural gas price took advantage of stochastic attempt to provide positive momentum, to notice surpassing $3.600 level, recording some of the gains by reaching $3.750, but the repeated stability below the barrier at $3.870 represents a main barrier against regaining the bullish bias, to expect forming mixed trading, and there is chance for the decline again below $3.600 level and targeting the negative stations near $3.450 and $3.320.
While facing new bullish pressure and breaching the mentioned barrier will confirm its readiness to form strong bullish waves, to expect achieving several gains by its rally towards $3.950 and $4.150.
The expected trading range for today is between $3.550 and 3.800
Trend forecast: Bearish
Following Monday’s rally, GBP/USD loses traction and declines toward 1.3500 in the European session on Tuesday. The technical outlook points to a loss of bullish momentum as investors await US data.
The table below shows the percentage change of British Pound (GBP) against listed major currencies today. British Pound was the weakest against the US Dollar.
| USD | EUR | GBP | JPY | CAD | AUD | NZD | CHF | |
|---|---|---|---|---|---|---|---|---|
| USD | 0.35% | 0.25% | 0.14% | 0.12% | 0.58% | 0.52% | 0.18% | |
| EUR | -0.35% | -0.06% | -0.18% | -0.21% | 0.25% | 0.26% | -0.15% | |
| GBP | -0.25% | 0.06% | -0.12% | -0.15% | 0.31% | 0.32% | -0.08% | |
| JPY | -0.14% | 0.18% | 0.12% | -0.02% | 0.42% | 0.40% | 0.11% | |
| CAD | -0.12% | 0.21% | 0.15% | 0.02% | 0.40% | 0.47% | 0.06% | |
| AUD | -0.58% | -0.25% | -0.31% | -0.42% | -0.40% | 0.00% | -0.41% | |
| NZD | -0.52% | -0.26% | -0.32% | -0.40% | -0.47% | -0.01% | -0.40% | |
| CHF | -0.18% | 0.15% | 0.08% | -0.11% | -0.06% | 0.41% | 0.40% |
The heat map shows percentage changes of major currencies against each other. The base currency is picked from the left column, while the quote currency is picked from the top row. For example, if you pick the British Pound from the left column and move along the horizontal line to the US Dollar, the percentage change displayed in the box will represent GBP (base)/USD (quote).
While testifying on the Monetary Policy Report before the UK Treasury Select Committee on Tuesday, Bank of England (BoE) Governor Andrew Bailey noted that they have not seen particular inflation surprises and reiterated that he prefers a gradual and careful approach to policy-easing.
BoE policymaker Swati Dhingra argued that an overly restrictive policy was risking suppressing demand and disincentivizing investment. Meanwhile, BoE policymaker Catherine Mann adopted a more cautious tone, saying that future policy decisions will require certainty that inflation is on track. “Services price inflation is above what I view as consistent with getting Consumer Price Index (CPI) back to target,” Mann added.
Following these mixed remarks, GBP/USD finds it difficult to attract buyers.
In the second half of the day, the US Bureau of Labor Statistics will publish the JOLTS Job Openings data for April. A noticeable increase in this data, with a reading of 7.7 million or higher, could support the USD with the immediate reaction and cause GBP/USD to extend its correction. On the flip side, a disappointing reading below 7 million could hurt the USD and open the door for a rebound in the pair.
The Relative Strength Index (RSI) indicator on the 4-hour chart declines toward 50, highlighting a loss of bullish momentum. The 20-period and the 50-period Simple Moving Average (SMA) form the first support level at 1.3500. In case GBP/USD falls below this level and starts using it as resistance, technical sellers could take action. In this scenario, 1.3410 (100-period SMA) and 1.3365 (200-period SMA) could be seen as next support levels.
On the upside, the first resistance level could be spotted at 1.3530 (mid-point of the ascending channel) ahead of 1.3600 (static level, round level) and 1.3700 (static level, round level).
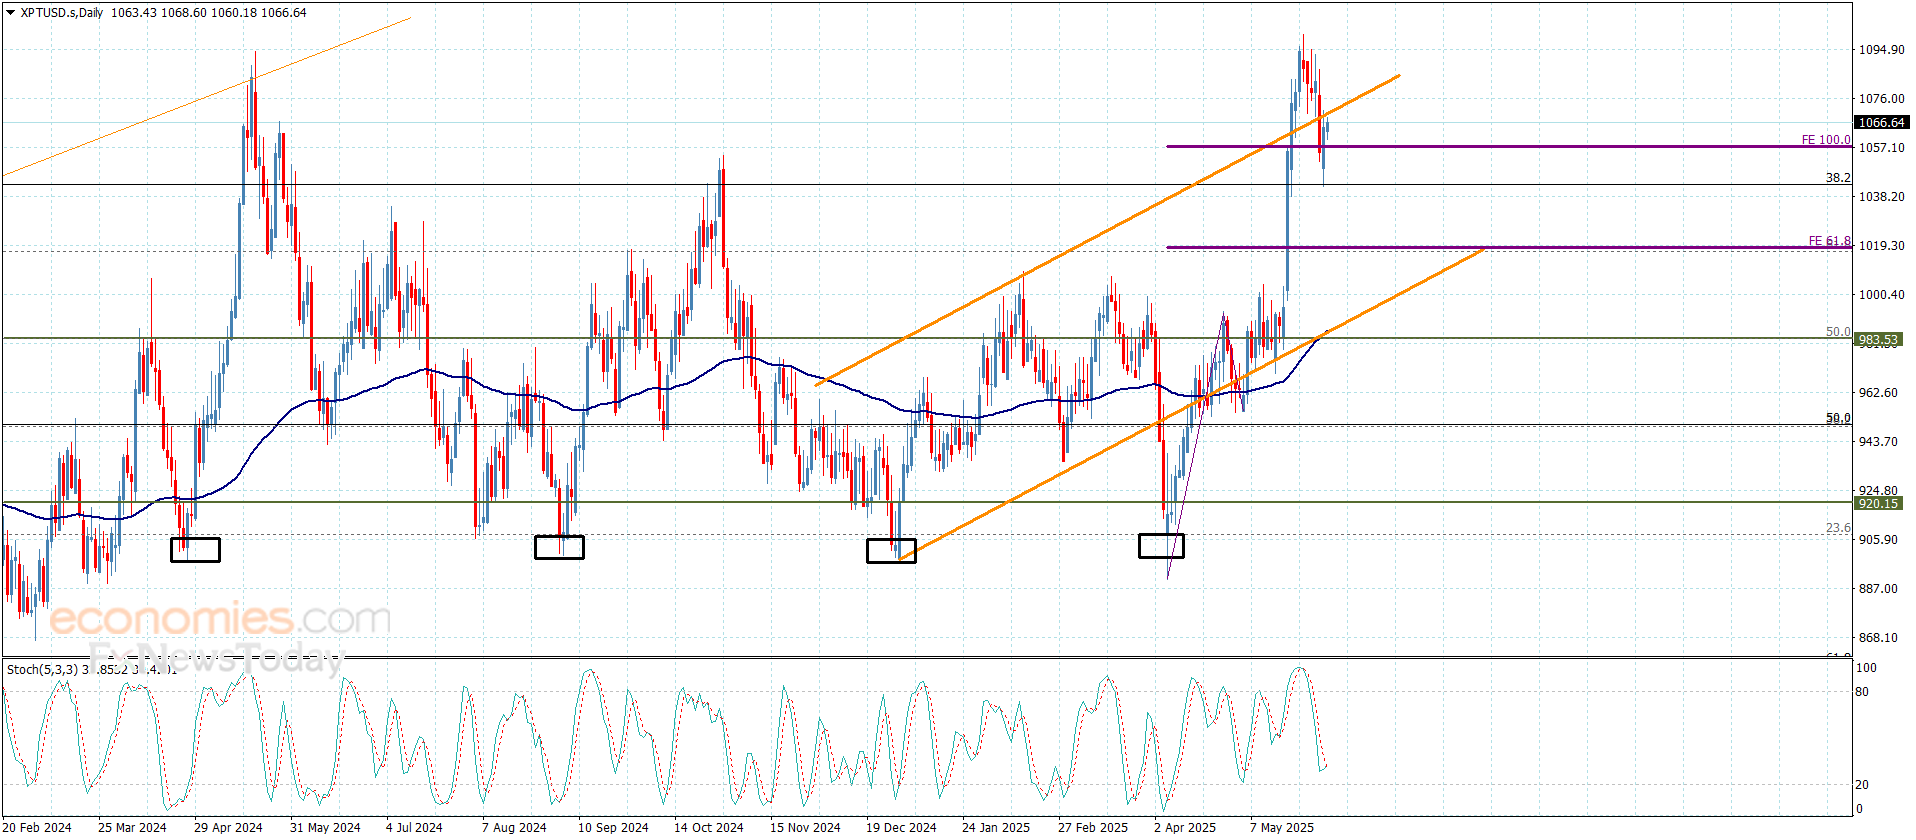
Platinum price took advantage of the repeated stability above the extra support at $1042.00, to notice forming some bullish trading and recording the initial target by hitting $1071.00.
Reminding you that confirming breaching $1070.00 level that represents the extension of the bullish channel’s resistance is important, to confirm its move to a new bullish station that allows it to press on the barrier at $1100.00, while the failure of the breach will force the price to provide mixed trading, and there is chance for renewing the pressure on the support at $1042.00.
The expected trading range for today is between $1052.00 and $1080.00
Trend forecast: Bullish
But at the same time, you have to understand that the US dollar is as well. Now, with the manufacturing PMI numbers coming out weaker than anticipated, obviously people ran from the greenback. But I think ultimately, we are going to be looking at this as a market that remains somewhat tight and rangebound.
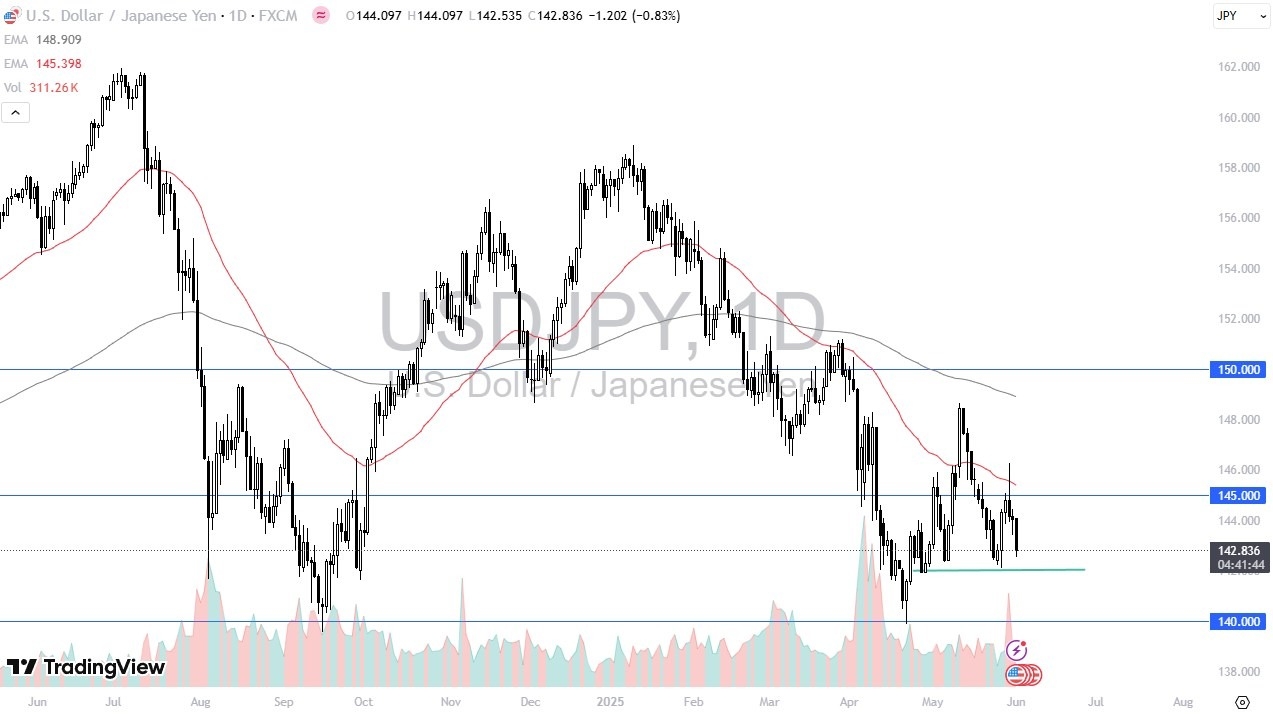
The 142 yen level is very supported, while the 145 yen level above is significant resistance. Once we break above the 50 day EMA, which is just above the 145 yen level assuming that we do, that would be a very bullish sign for the greenback. If we break down below the 142 yen level, then we could go looking to the 140 yen level, which has been massive support a couple of times in the past.
Interest rate differential does favor the US dollar overall, and I would keep that in the back of my mind as you do get paid to hang on to this pair. And over the longer term, that can really add up. Furthermore, we’ve had some problems in the Japanese government bond markets as there’s been two or three days that I know of in the last 10 days that there’s been no bids, meaning the Bank of Japan is probably going to have to step into the market, and buy bonds and that’s the same thing as quantitative easing. So, we’ll have to wait and see how that is going to affect this pair but right now I still think we have a much more likelihood of going higher than lower but right now we’re in a very noisy area that will continue to favor short-term range bound trading.
Want to trade our USD/JPY forex analysis and predictions? Here’s a list of forex brokers in Japan to check out.
Christopher Lewis has been trading Forex and has over 20 years experience in financial markets. Chris has been a regular contributor to Daily Forex since the early days of the site. He writes about Forex for several online publications, including FX Empire, Investing.com, and his own site, aptly named The Trader Guy. Chris favours technical analysis methods to identify his trades and likes to trade equity indices and commodities as well as Forex. He favours a longer-term trading style, and his trades often last for days or weeks.