The main category of Forex News.
You can use the search box below to find what you need.
[wd_asp id=1]
The main category of Forex News.
You can use the search box below to find what you need.
[wd_asp id=1]
The (GBPUSD) price declined in its recent intraday trading, breaking the critical support level at 0.3260, which represents a neckline for clear negative formation on the short-term basis – the triple top pattern, which reverses the previous bullish trend. This break is considered as a strong technical signal for turning the price behavior, supporting the continuation of the dominant bearish correctional wave on the price.
This negative performance comes amid the continuation of the negative pressures, with the stability of the price below EMA50, besides the emergence of the negative signals on the (RSI), despite its stability below 0.3260, to target the support at 1.3160.
Do you need help in trading decisions? Do you want to learn how to start trading?
Join Economies.com VIP Club and benefit from over 15 years of market analysis expertise and get:
Special Offer: Subscribe to the Economies.com VIP channel and get also a free subscription to a trusted trading signals channel provided by Best Trading Signal.
Copper price failed to settle above the extra support at $4.5400 by stochastic negative momentum, to push it to suffer several losses by hitting $4.4200, to settle below the moving average 55.
The continuation of the negative pressures makes us prefer more of the negative trading in the current period, to target $4.3200 level, while regaining the bullish bias requires forming strong bullish waves, to settle above $4.6600 level, which represents %50 Fibonacci correction level.
The expected trading range for today is between $4,3800 and $4.5800
Trend forecast: Bearish
Do you need help in trading decisions? Do you want to learn how to start trading?
Join Economies.com VIP Club and benefit from over 15 years of market analysis expertise and get:
Special Offer: Subscribe to the Economies.com VIP channel and get also a free subscription to a trusted trading signals channel provided by Best Trading Signal.
Since the sharp drop on April 3, the 20-Day MA has defined dynamic resistance of the near-term downtrend. Recently, the 20-Day line was tested as resistance twice during an initial counter-trend rally and it was followed by an accelerated decline. A second counter trend rally began from Monday’s low of $55.81 and looks like it is poised to reach the 20-Day line at a minimum.
Given the recent history resistance is expected to be seen once first approached. But if strength in the price of crude oil can be maintained there is a chance of an upside breakout. A rally above the 20-Day line would show strength but a confirmed breakout would need a daily close above that line.
Monday’s low established a higher swing low, and it was accompanied by a higher swing low in the relative strength index (RSI). Nonetheless, crude oil is rising inside a bear trend on multiple time frames. Whether it can continue to rise depends on the behavior around key potential resistance levels. The first being the 20-Day MA. After that, there are several minor price levels of interest until last week’s high of $64.06, which was a lower weekly high.
The developing weekly pattern in crude oil is bullish and may reflect downside exhaustion. Bullish behavior was also seen in the weekly candle at the prior bottom of $55.23 in early April. Regardless, a period a consolidation is also a possibility as overall volatility could begin to diminish if crude oil continues to test the lows as support and it stays below the 20-Day MA.
For a look at all of today’s economic events, check out our economic calendar.
The US dollar has flexed its muscles against the Japanese yen and it’s interesting that the 145 yen level has been like a brick wall. If we can make a fresh high above the early part of the week and the 50 day EMA, I think that will bring in a lot more buyers of US dollars and people willing to take advantage of the interest rate differential as it certainly favors the US dollar. At that point in time, we could be looking at a move to the 148 yen level. In the meantime, I think short-term pullbacks continue to be buying opportunities as it looks like we’re trying to base here.
The Australian dollar initially tried to rally but has given back gains. We are getting dangerously close to seeing a reversal here as well. A move below the 50 day EMA is enough for me. At that point in time, I start shorting. I think it was obvious after the Federal Reserve meeting that the Fed is not going to cut rates in June, unlike what most of the trading community seemed to be banking on.
And now, the odds of a rate cut later this year are starting to drop a little bit as well. People still believe in a couple of rate cuts coming out of the Federal Reserve, but at the same time, he made it pretty clear during the press conference yesterday that he really didn’t know what they were going to do because there were far too many variables out there that caused confusion.
For a look at all of today’s economic events, check out our economic calendar.
Siver price held firm on Thursday as risk appetite improved on news of a US-UK trade deal, along with hopes that Sino-US tensions could be lowered, as delegations of both countries would meet in Switzerland this weekend. At the time of writing, XAG/USD trades at $32.44, down 0.15%.
Silver price is trading below the 50-day Simple Moving Average (SMA) at $32.68, a key technical resistance level that capped the metal’s advance despite hitting a daily high of $32.93. Momentum shows the lack of commitments of buyers and sellers as portrayed by the Relative Strength Index (RSI), which hovers near its 50 neutral line, turning flat. That said, XAG/USD would likely remain sideways in the short term.
For a bullish continuation, XAG/USD must clear the 50-day SMA and the $33.00 figure. Once achieved, the next ceiling level will be an April 25 daily high at $33.68, followed by $34.00. Conversely, if Silver slides beneath $32.22, look for a test of the 100-day SMA at $31.80, ahead of the 200-day SMA at $31.19.
Silver is a precious metal highly traded among investors. It has been historically used as a store of value and a medium of exchange. Although less popular than Gold, traders may turn to Silver to diversify their investment portfolio, for its intrinsic value or as a potential hedge during high-inflation periods. Investors can buy physical Silver, in coins or in bars, or trade it through vehicles such as Exchange Traded Funds, which track its price on international markets.
Silver prices can move due to a wide range of factors. Geopolitical instability or fears of a deep recession can make Silver price escalate due to its safe-haven status, although to a lesser extent than Gold’s. As a yieldless asset, Silver tends to rise with lower interest rates. Its moves also depend on how the US Dollar (USD) behaves as the asset is priced in dollars (XAG/USD). A strong Dollar tends to keep the price of Silver at bay, whereas a weaker Dollar is likely to propel prices up. Other factors such as investment demand, mining supply – Silver is much more abundant than Gold – and recycling rates can also affect prices.
Silver is widely used in industry, particularly in sectors such as electronics or solar energy, as it has one of the highest electric conductivity of all metals – more than Copper and Gold. A surge in demand can increase prices, while a decline tends to lower them. Dynamics in the US, Chinese and Indian economies can also contribute to price swings: for the US and particularly China, their big industrial sectors use Silver in various processes; in India, consumers’ demand for the precious metal for jewellery also plays a key role in setting prices.
Silver prices tend to follow Gold’s moves. When Gold prices rise, Silver typically follows suit, as their status as safe-haven assets is similar. The Gold/Silver ratio, which shows the number of ounces of Silver needed to equal the value of one ounce of Gold, may help to determine the relative valuation between both metals. Some investors may consider a high ratio as an indicator that Silver is undervalued, or Gold is overvalued. On the contrary, a low ratio might suggest that Gold is undervalued relative to Silver.
Before the bull trend can go higher it first needs to break out from the resistance zone that stopped the ascent on Monday and then again today. Resistance was seen at the $3.75 high on Monday, which led to a short one-day pullback that found support around the 38.2% Fibonacci retracement. Strength returned quickly with positive gains on Wednesday and a continuation higher today. The bearish response following another test of the resistance zone earlier in today’s session further confirms the resistance zone. What happens next should provide clues.
A decline below today’s low of $3.53 is short-term bearish and increases the chance for a test of this week’s low at $3.42 and possibly dropping below that level. The key 20-Day MA is now at $3.31. If a deeper pullback comes, that line is likely to be tested. If support is seen at or above the 20-Day line, natural gas has a chance of continuing higher.
Given the significance of the resistance zone a deeper pullback before another breakout attempt would be healthy for the rally. Nonetheless, an earlier breakout to new trend highs would be bullish. But the upside may be limited as during the advance the price of natural gas rose by $0.90 or 31.1% as of Monday’s high.
The 50-Day MA, now at $3.75, has been falling and has converged with the high from Monday. There is the neckline of a head and should topping pattern at $3.74 and the AVWAP from the top of the trend is at $3.73. An upside trend breakout would be signaled on a rise above $3.75, the top of the resistance zone. Until then, natural gas can be anticipated to consolidate or continue the bearish pullback.
For a look at all of today’s economic events, check out our economic calendar.
May 8, 2025 – Written by Ben Hughes
STORY LINK GBP/USD Forecast: Pound Rebounds Against Dollar as BoE Strikes Cautious Tone
The Pound-to-Dollar exchange rate wavered on Thursday but ultimately found a foothold, bolstered by a slightly more hawkish tone from the Bank of England (BoE) and renewed optimism over UK-US trade ties.
At the time of writing, GBP/USD was trading around $1.3329, having rebounded from earlier lows following a turbulent twenty-four hours.
The Pound (GBP) initially struggled on Thursday ahead of the BoE’s widely expected interest rate cut, but quickly rallied as markets digested the tone of the central bank’s messaging.
While the Monetary Policy Committee (MPC) voted to reduce the Bank Rate by 25 basis points, the decision was not unanimous, with two members voting to keep rates unchanged.
This dissent, alongside only a modest revision to the BoE’s inflation outlook, hinted at a more cautious approach to future cuts than investors had anticipated. As a result, Sterling clawed back earlier losses and even advanced against some major peers.
Adding to the Pound’s resilience was the recent optimism around UK-US trade relations. After hinting at a deal overnight on Wednesday, President Donald Trump then confirmed that a ‘full and comprehensive’ deal between the UK and US would be the first agreement announced since he introduced his ‘liberation day’ tariffs.
Coming on the heels of a UK-India agreement and amid broader signs of rebuilding post-Brexit relations with the EU, markets welcomed the news as a potential positive for the UK economy.

Meanwhile, the US Dollar (USD) managed to avoid significant losses, helped by residual strength from Wednesday’s Federal Reserve decision. The Fed opted to keep interest rates steady, as expected, but struck a tone that suggested policymakers were in no hurry to ease monetary policy.
Fed Chair Jerome Powell reinforced this view during the post-decision press conference, indicating that the bank would prefer to wait and see how tariffs impact the US economy before acting again. He also flagged inflation risks as a key concern, which prompted investors to dial back expectations of a near-term rate cut.
This shift in outlook gave the US Dollar a lift midweek and helped it avoid steeper losses on Thursday, even as the Pound regained some traction.
Looking ahead, GBP/USD could remain sensitive to commentary from key central bank figures due to speak on Friday.
BoE Governor Andrew Bailey is due to speak in the morning, and any indication that the British central bank might speed up rate cuts if inflation cools more quickly could weigh on the Pound.
Later in the day, a string of speeches from Fed officials will be closely watched. If the messaging echoes Powell’s stance – favouring a cautious and data-driven approach – the US Dollar could remain supported. Conversely, if recession risks or concerns over the labour market come to the fore, the ‘Greenback’ may weaken.

International Money Transfer? Ask our resident FX expert a money transfer question or try John’s new, free, no-obligation personal service! ,where he helps every step of the way,
ensuring you get the best exchange rates on your currency requirements.
TAGS: Pound Dollar Forecasts
May 8, 2025 – Written by David Woodsmith
STORY LINK Euro to Dollar Forecast: “Remains Range Bound” Between 1.12-1.15
The Federal Reserve’s refusal to consider any near-term cut in interest rates has supported the dollar in global markets with the Euro to Dollar (EUR/USD) exchange rate trading around 1.1300 from 1.1270 lows.
The dollar is still being hampered by fragile underlying confidence.
ING commented; “We think there will be sustained support around the 1.1250-1.130 area in EUR/USD in the near term.”
According to Scotiabank; “EURUSD remains range bound, and its movement since mid-April has been limited between support in the mid-1.12s and resistance above 1.15.”
The Euro could gain some support if the trumpeted UK-US trade deal is short on content.
On a longer-term view, Natixis has an end-2025 EUR/USD forecast of 1.20; “As we anticipate a technical recession in the US economy, the dollar will resume its decline, given that it remains overvalued in terms of real effective exchange rates.”
The Federal Reserve held interest rates at 4.50% at the May meeting, in line with strong consensus forecasts.
Chair Powell commented that inflation and unemployment are both likely to increase due to the impact of tariffs.
Powell repeated recent commented that the inflation and employment goals are liable to be in tension which will make it difficult for the central bank to set policy.
His key message, however, was that the Fed needed to be patient and wait for the economic data to judge the correct policy response.
Commonwealth Bank of Australia head of international and sustainable economics Joseph Capurso commented; “The FOMC does not want to pre-empt changes in the U.S. economy – it wants to wait for ‘hard’ economic data to guide its policy actions.”
He added; “From here, we expect communication from Chair Powell and other FOMC members to focus on making sure inflation expectations are anchored.”
There has been a sharp shift in market pricing with traders considering that the chance of a June rate cut has dipped to near 20%.
As far as US data is concerned, US initial jobless claims declined to 228,000 from 241,000 the previous week and slightly below consensus forecasts of 230,000 while continuing claims retreated to 1.88mn from 1.91mn.
According to ING; “Another hold from the Federal Reserve with an acknowledgement that uncertainty has increased with more upside risk for both inflation and unemployment. This suggests little inclination to move until they are confident of the direction the data is heading, meaning rate cuts could be delayed, but risk being sharper when they come.”
MUFG took a similar view; “We expect the Fed to resume rate cuts when evidence emerges that the US labour market is loosening in response to trade disruption and heightened policy uncertainty supporting our outlook for further US dollar weakness in the 2H of this year.”
According to the bank; “A delay to Fed rate cuts may help to offer some much needed support for the US dollar in the near-term although the link with short-term yield spreads has broken down recently.”
ING noted that the dollar still trades with a sizeable risk premium.
It added; “In EUR/USD that translates into around 4% overvaluation in our estimates, but the path to make markets comfortable with a substantially smaller risk premium isn’t going to be smooth. A constant flow of positive news on trade risk de-escalation is necessary, but probably not sufficient in the face of the damage markets think tariffs are already inflicting on the US economy.”
International Money Transfer? Ask our resident FX expert a money transfer question or try John’s new, free, no-obligation personal service! ,where he helps every step of the way,
ensuring you get the best exchange rates on your currency requirements.
TAGS: Euro Dollar Forecasts
U.S. crude oil supply will rise more slowly than expected for the rest of 2025 and in 2026 and peak as early as this year, as WTI benchmark prices below $60 per barrel are testing the breakeven point of shale production, energy flows intelligence firm Kpler said on Monday.
Oil prices have slipped by more than 15% since the beginning of April as the market fears recessions from the U.S. tariffs and oversupply from the aggressive production hikes from OPEC+. Prices dipped early on Monday after the OPEC+ group decided on Saturday to raise collective output by 411,000 barrels per day (bpd), nearly triple the volume originally scheduled.
The U.S. benchmark, WTI Crude, was trading at about $57 per barrel—a price point that is below the breakeven levels for many shale wells, especially those outside the prime acreage and hottest spots in the Permian.
With the low oil prices, Kpler has now cut its U.S. crude supply forecast by 120,000 barrels per day (bpd) to 170,000 bpd for the rest of 2025 and into 2026, “as weaker prices threaten to slow shale production.”
“With WTI, the main US benchmark crude, now near breakeven levels for new wells, producers are likely to cut back drilling,” said the analysts at Kpler.
U.S. shale producers are the most reactive to oil price changes and they are typically quick to follow the price trends. Lower margins are prompting caution among the American oil industry, Kpler noted.
The latest OPEC+ move to fight for market share and discipline U.S. shale is putting pressure on U.S. crude output, said Kpler, which now expects America’s crude production to peak in 2025 and gradually decline after that.
Despite steady near-term activity, growth is slowing in the U.S. shale patch, and U.S. crude output is set to peak this year, Kpler noted.
By Charles Kennedy for Oilprice.com
More Top Reads From Oilprice.com
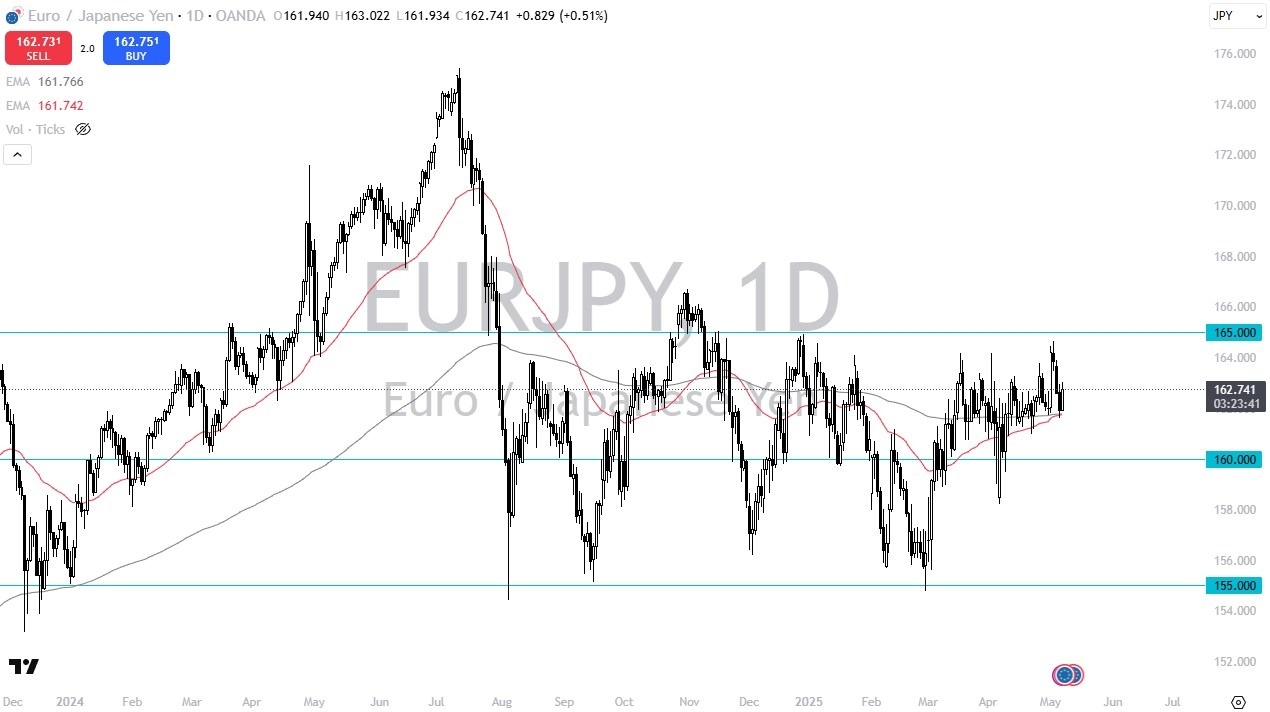
A rally from here probably opens up the possibility of a move towards the 165 yen level, which has been like a pretty significant ceiling here for some time. If we can clear that level, then we have the chance of breaking out. Underneath, if we were to break down below the moving averages, then we could move down to the 160 yen level, which is basically the middle of the overall consolidation.

You’ll notice on the charts that I have the 155 yen level and the 165 yen level drawn out with the 160 yen level right in the middle, you can see where price has flipped there multiple times. The interest rate differential does favor the euro, although not drastically, but at the end of the day, that is something that matters.
Furthermore, I am starting to see the Japanese yen give up some of its grip on other currencies, so that might translate into higher prices here as well. Keep in mind that the Bank of Japan recently flinched when it came time to tighten monetary policy, and it’s difficult to imagine a scenario where traders forget that. I do favor the upside.
Begin trading our daily forecasts and analysis. Here is a list of Forex brokers in Japan to work with.