The main category of Forex News.
You can use the search box below to find what you need.
[wd_asp id=1]
The main category of Forex News.
You can use the search box below to find what you need.
[wd_asp id=1]
Silver price (XAG/USD) falls sharply to near $32.50 in Thursday’s European session after failing to extend a 10-day rally above the key resistance of $33.00. The white metal corrects as the US Dollar (USD) strives to gain ground near its recent lows. The US Dollar Index (DXY), which tracks the Greenback’s value against six major currencies, attracts some bids near its three-year low of 99.00.
The USD Index rebounds slightly as decent progress in negotiations on a trade deal between the United States (US) and Japan has eased some uncertainty over the domestic economic outlook. “A Great Honour to have just met with the Japanese Delegation on Trade. Big Progress!” US President Donald Trump wrote in a post on Truth.Social platform on Wednesday.
This appears to be a meaningful sign that Trump wants favorable bilateral trades over hefty reciprocal tariff policies. More positive outcomes of trade negotiations by Washington with other trading partners will be favorable for the US Dollar. Such a scenario will diminish the global economic uncertainty, which would lead to a decline in demand for safe-haven assets, such as Silver.
Additionally, slight hawkish commentary from Federal Reserve (Fed) Chair Jerome Powell on the monetary policy outlook has also forced traders to book profits in the Silver price. On Wednesday, Powell said in a speech at the Economic Club of Chicago that the Fed seeks more clarity on the economic outlook before making any policy adjustments. Fed’s support for a restrictive monetary policy stance bodes poorly for non-yielding assets, such as Silver.
Meanwhile, the escalated trade war between China and the US will keep the downside in the Silver price limited. Beijing has shown a willingness for trade talks with Washington, but with respect and mutual understanding.
Silver price holds above the 20-day Exponential Moving Average (EMA) near $32.28, suggesting that the near-term outlook is bullish. The white metal aims to revisit the October 22 high of $34.87.
The 14-day Relative Strength Index (RSI) delivers a V-shape recovery after turning oversold below 30.00. The momentum oscillator is expected to find resistance near 60.00.
A fresh upside would appear in the counter if the Silver price breaks above the April 16 high of $33.12. The move will unlock targets of the October 22 high of $34.87 and an over-decade high of $35.50.
On the flip side, a downside move by the Silver price below the April 14 low of $31.74 will expose it to the April 11 low of $30.90, followed by the psychological level of $30.00
Silver is a precious metal highly traded among investors. It has been historically used as a store of value and a medium of exchange. Although less popular than Gold, traders may turn to Silver to diversify their investment portfolio, for its intrinsic value or as a potential hedge during high-inflation periods. Investors can buy physical Silver, in coins or in bars, or trade it through vehicles such as Exchange Traded Funds, which track its price on international markets.
Silver prices can move due to a wide range of factors. Geopolitical instability or fears of a deep recession can make Silver price escalate due to its safe-haven status, although to a lesser extent than Gold’s. As a yieldless asset, Silver tends to rise with lower interest rates. Its moves also depend on how the US Dollar (USD) behaves as the asset is priced in dollars (XAG/USD). A strong Dollar tends to keep the price of Silver at bay, whereas a weaker Dollar is likely to propel prices up. Other factors such as investment demand, mining supply – Silver is much more abundant than Gold – and recycling rates can also affect prices.
Silver is widely used in industry, particularly in sectors such as electronics or solar energy, as it has one of the highest electric conductivity of all metals – more than Copper and Gold. A surge in demand can increase prices, while a decline tends to lower them. Dynamics in the US, Chinese and Indian economies can also contribute to price swings: for the US and particularly China, their big industrial sectors use Silver in various processes; in India, consumers’ demand for the precious metal for jewellery also plays a key role in setting prices.
Silver prices tend to follow Gold’s moves. When Gold prices rise, Silver typically follows suit, as their status as safe-haven assets is similar. The Gold/Silver ratio, which shows the number of ounces of Silver needed to equal the value of one ounce of Gold, may help to determine the relative valuation between both metals. Some investors may consider a high ratio as an indicator that Silver is undervalued, or Gold is overvalued. On the contrary, a low ratio might suggest that Gold is undervalued relative to Silver.
The
According to Forex market trading, the Japanese Yen’s gains against other major currencies increased, with the widespread weakness of the US dollar continuing. Growing concerns about the economic repercussions of a potential new round of US tariffs contributed to the decline of the US dollar. In the latest development in trade policy, US President Donald Trump ordered an investigation into the possibility of imposing tariffs on all essential US metal imports, much of which comes from China. This move has increased investor anxiety, adding pressure on the dollar. Meanwhile, attention is shifting to upcoming trade talks between Japan and the United States, as Tokyo is striving for the complete abolition of Trump’s tariffs.
On the Japanese front, traders absorbed data showing an eight-month high in Japanese manufacturing sector confidence for April. However, the outlook remains cautious amid ongoing concerns about US trade policy.

Dear TradersUp website follower, be cautious; USD/JPY will be affected by the direction of central bank policies and the reaction to the paths of global trade wars.
In this regard, Bank of Japan Governor Kazuo Ueda stated in an interview with the Sankei newspaper that the BOJ may consider taking policy action if US tariffs harm the Japanese economy. He added, “Taking policy action may become necessary,” noting that the risks posed by US President Trump’s trade actions have approached the “bad scenario” anticipated by the central bank.
The governor acknowledged that recent developments are already affecting business and household confidence. While the Board still plans to raise interest rates at an “appropriate pace,” Ueda stressed the importance of assessing the economic impact of US tariffs without prejudging them. He added that domestic food price inflation is likely to decline, real wages are expected to rise mid-year, and that upside and downside risks remain regarding inflation expectations.
The Bank of Japan will hold a monetary policy meeting from April 30 to May 1, where it will also release updated economic forecasts.
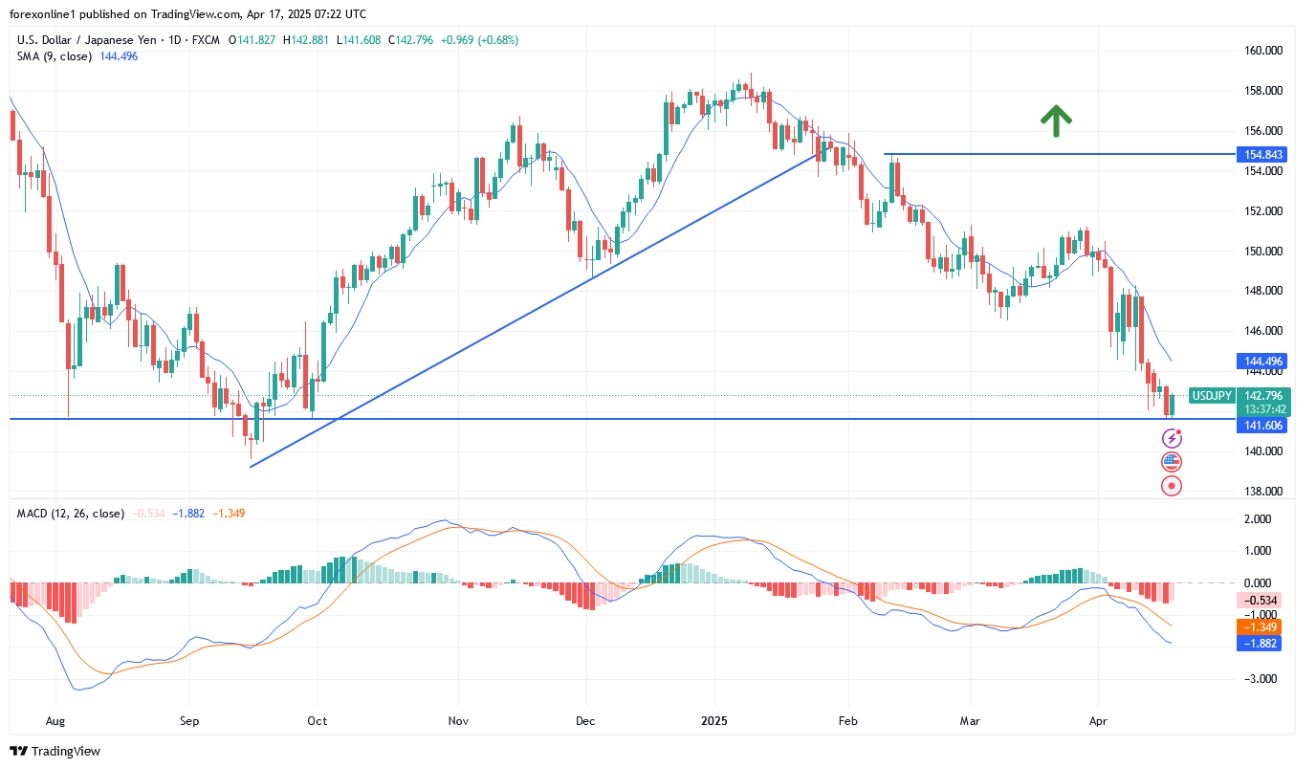
Dear reader, as clearly shown on the daily chart, the overall trend for the USD/JPY currency pair remains bearish. Also, the return to the vicinity of the current support at 141.60 signals a deeper downward move. The psychological support at 140.00 will be an easy target for the bears, and until it moves towards or away from it. Furthermore, technical indicators have moved towards strong oversold zones, as is the case with signals from the MACD, RSI, and other momentum indicators. Therefore, we recommend buying USD/JPY from the vicinity of the support levels 140.90, 140.00, and 139.20 respectively, with future targets at 143.20 and 145.00 respectively, and the stop-loss remains below the 138.00 support.
Ready to trade our Forex daily forecast? We’ve shortlisted the best forex broker list for you to check out.
EURCAD provided bullish trading recently, to settle above the previously broken bullish channel’s support at1.5625 and record some gains by its stability near 1.578
The price success to settle above the mentioned support and stochastic attempt to provide positive momentum, will increase the efficiency of the bullish track, to expect attacking the barrier at 1.5880 soon, and surpassing it will ease the mission of recording new gains that might begin at 1.5980, while the price return to settle below the bullish channel’s support will cancel the bullish suggestion, which pushes the price to suffer several losses by reaching 1.5510 and 1.5390.
The expected trading range for today is between 1.5700 and 1.5880
Trend forecast: Bullish
Do you need help in trading decisions? Do you want to learn how to start trading?
Join Economies.com VIP Club and benefit from over 15 years of market analysis expertise and get:
Special Offer: Subscribe to the Economies.com VIP channel and get also a free subscription to a trusted trading signals channel provided by Best Trading Signal.
EUR/USD gained traction and registered its highest daily close since February 2022 at 1.1400 on Wednesday. The pair corrects lower toward 1.1350 early Thursday as investors await the European Central Bank’s (ECB) monetary policy announcements.
The table below shows the percentage change of Euro (EUR) against listed major currencies this week. Euro was the strongest against the Canadian Dollar.
| USD | EUR | GBP | JPY | CAD | AUD | NZD | CHF | |
|---|---|---|---|---|---|---|---|---|
| USD | -0.02% | -1.15% | -0.81% | 0.06% | -1.03% | -1.63% | -0.01% | |
| EUR | 0.02% | -0.65% | -0.36% | 0.52% | -0.28% | -1.18% | 0.44% | |
| GBP | 1.15% | 0.65% | 0.70% | 1.17% | 0.37% | -0.53% | 1.10% | |
| JPY | 0.81% | 0.36% | -0.70% | 0.85% | -0.45% | -1.03% | 0.98% | |
| CAD | -0.06% | -0.52% | -1.17% | -0.85% | -1.04% | -1.68% | -0.14% | |
| AUD | 1.03% | 0.28% | -0.37% | 0.45% | 1.04% | -0.89% | 0.72% | |
| NZD | 1.63% | 1.18% | 0.53% | 1.03% | 1.68% | 0.89% | 1.66% | |
| CHF | 0.01% | -0.44% | -1.10% | -0.98% | 0.14% | -0.72% | -1.66% |
The heat map shows percentage changes of major currencies against each other. The base currency is picked from the left column, while the quote currency is picked from the top row. For example, if you pick the Euro from the left column and move along the horizontal line to the US Dollar, the percentage change displayed in the box will represent EUR (base)/USD (quote).
The broad-based US Dollar (USD) weakness helped EUR/USD push higher on Wednesday as reports suggesting that the United States (US) President Donald Trump was planning to use ongoing tariff negotiations to pressure US trading partner to isolate China fed into fears over a deepening trade conflict.
The ECB is widely anticipated to lower key rates by 25 basis points (bps) following the April policy meeting. Since the ECB will not be releasing revised economic projections this time, investors will scrutinize the statement language and comments from President Christine Lagarde in the post-meeting press conference.
Earlier in the week, Bloomberg reported that the European Union (EU) was expecting a bulk of the tariffs imposed by the US to remain in place after little progress was made in talks on Monday. In case the ECB puts more emphasis on upside risks to inflation because of tariffs, rather than the growth outlook, markets could assess that as a hawkish tone. In this scenario, the Euro is likely to preserve its strength.
On the flip side, the Euro could struggle to find demand if the ECB, or President Lagarde, reaffirms confidence in the ongoing disinflation process and hints at a continuation of policy-easing.
The Relative Strength Index (RSI) indicator on the 4-hour chart retreated slightly below 60 and EUR/USD declined to test the 20-period Simple Moving Average, reflecting a loss of bullish momentum.
On the downside, 1.1280 (static level) aligns as first support level below 1.1230 (lower limit of the ascending channel) and 1.1200-1.1190 (static level, 50-period SMA). Looking north, resistances could be spotted at 1.1400 (static level, mid-point of the ascending channel), 1.1470 (static level) and 1.1500 (round level).
The European Central Bank (ECB) in Frankfurt, Germany, is the reserve bank for the Eurozone. The ECB sets interest rates and manages monetary policy for the region.
The ECB primary mandate is to maintain price stability, which means keeping inflation at around 2%. Its primary tool for achieving this is by raising or lowering interest rates. Relatively high interest rates will usually result in a stronger Euro and vice versa.
The ECB Governing Council makes monetary policy decisions at meetings held eight times a year. Decisions are made by heads of the Eurozone national banks and six permanent members, including the President of the ECB, Christine Lagarde.
In extreme situations, the European Central Bank can enact a policy tool called Quantitative Easing. QE is the process by which the ECB prints Euros and uses them to buy assets – usually government or corporate bonds – from banks and other financial institutions. QE usually results in a weaker Euro.
QE is a last resort when simply lowering interest rates is unlikely to achieve the objective of price stability. The ECB used it during the Great Financial Crisis in 2009-11, in 2015 when inflation remained stubbornly low, as well as during the covid pandemic.
Quantitative tightening (QT) is the reverse of QE. It is undertaken after QE when an economic recovery is underway and inflation starts rising. Whilst in QE the European Central Bank (ECB) purchases government and corporate bonds from financial institutions to provide them with liquidity, in QT the ECB stops buying more bonds, and stops reinvesting the principal maturing on the bonds it already holds. It is usually positive (or bullish) for the Euro.
Copper price provided a positive signal this morning by hitting the $4,7200 level, but its neediness to the positive momentum pushed it to return to provide new sideways fluctuated moves below 50%Fibonacci correction level at $4.6600.
Breaching the current barrier is important for reinforcing the chances for resuming the bullish attack, which might target $4.7500 level, reaching 61.8%Fibonacci correction level at $4.8200.
The expected trading range for today is between $4.5800 and $4.7500
Trend forecast: Bullish
Do you need help in trading decisions? Do you want to learn how to start trading?
Join Economies.com VIP Club and benefit from over 15 years of market analysis expertise and get:
Special Offer: Subscribe to the Economies.com VIP channel and get also a free subscription to a trusted trading signals channel provided by Best Trading Signal.
The GBPJPY pair activated the negative attack in yesterday’s trading, achieving the initial negative target by hitting 187.55 level, then it rebounded to settle above 38.2%Fibonacci correction level at 188.00, to gather the required negative momentum to confirm the continuation of the bearish trend in the upcoming trading.
In general, the bearish scenario would remain valid if the trading settled below the main resistance at 189.90, as confirming breaking 188.00 level makes us expect targeting new negative stations, and 186.50 level represents the next target for the negative trading, while the attempt of breaching the mentioned resistance will cancel the bearish suggestion in the near trading, as there is a chance for achieving some gains by the price rally towards 190.50 initially.
The expected trading range for today is between 186.50 and 189.20
Trend forecast: Bearish
Do you need help in trading decisions? Do you want to learn how to start trading?
Join Economies.com VIP Club and benefit from over 15 years of market analysis expertise and get:
Special Offer: Subscribe to the Economies.com VIP channel and get also a free subscription to a trusted trading signals channel provided by Best Trading Signal.
Silver (XAG/USD) is trading around $32.30 per troy ounce during Thursday’s Asian session, paring some of its gains from the previous day. The precious metal is under pressure as global risk sentiment improves following US President Donald Trump’s announcement of exemptions for key technology products from newly proposed “reciprocal” tariffs.
The exemptions, which cover smartphones, computers, semiconductors, solar cells, and flat-panel displays, primarily benefit goods manufactured in China. However, Silver’s downside remains limited as Trump simultaneously launched a probe into potential tariffs on critical minerals, further escalating trade tensions with China. The investigation also extends to sectors like copper, pharmaceuticals, lumber, and semiconductors, highlighting the US’s limited domestic production capacity in these areas.
Safe-haven demand for Silver is also underpinned by persistent uncertainty around US trade policy, along with subdued demand for the US Dollar (USD) and Treasury securities. The US Dollar Index (DXY) hovers around 99.50, while yields on 2-year and 10-year US Treasury notes stand at 3.80% and 4.30%, respectively.
Meanwhile, dovish signals from major central banks continue to support non-yielding assets like bullion. Softer-than-expected inflation in the US, Canada, UK, India, and the Euro Area in March—alongside the PBoC’s potential rate cut this quarter—further bolsters the case for precious metals.
Silver is a precious metal highly traded among investors. It has been historically used as a store of value and a medium of exchange. Although less popular than Gold, traders may turn to Silver to diversify their investment portfolio, for its intrinsic value or as a potential hedge during high-inflation periods. Investors can buy physical Silver, in coins or in bars, or trade it through vehicles such as Exchange Traded Funds, which track its price on international markets.
Silver prices can move due to a wide range of factors. Geopolitical instability or fears of a deep recession can make Silver price escalate due to its safe-haven status, although to a lesser extent than Gold’s. As a yieldless asset, Silver tends to rise with lower interest rates. Its moves also depend on how the US Dollar (USD) behaves as the asset is priced in dollars (XAG/USD). A strong Dollar tends to keep the price of Silver at bay, whereas a weaker Dollar is likely to propel prices up. Other factors such as investment demand, mining supply – Silver is much more abundant than Gold – and recycling rates can also affect prices.
Silver is widely used in industry, particularly in sectors such as electronics or solar energy, as it has one of the highest electric conductivity of all metals – more than Copper and Gold. A surge in demand can increase prices, while a decline tends to lower them. Dynamics in the US, Chinese and Indian economies can also contribute to price swings: for the US and particularly China, their big industrial sectors use Silver in various processes; in India, consumers’ demand for the precious metal for jewellery also plays a key role in setting prices.
Silver prices tend to follow Gold’s moves. When Gold prices rise, Silver typically follows suit, as their status as safe-haven assets is similar. The Gold/Silver ratio, which shows the number of ounces of Silver needed to equal the value of one ounce of Gold, may help to determine the relative valuation between both metals. Some investors may consider a high ratio as an indicator that Silver is undervalued, or Gold is overvalued. On the contrary, a low ratio might suggest that Gold is undervalued relative to Silver.
The GBPJPY pair activated the negative attack in yesterday’s trading, achieving the initial negative target by hitting 187.55 level, then it rebounded to settle above 38.2%Fibonacci correction level at 188.00, to gather the required negative momentum to confirm the continuation of the bearish trend in the upcoming trading.
In general, the bearish scenario would remain valid if the trading settled below the main resistance at 189.90, as confirming breaking 188.00 level makes us expect targeting new negative stations, and 186.50 level represents the next target for the negative trading, while the attempt of breaching the mentioned resistance will cancel the bearish suggestion in the near trading, as there is a chance for achieving some gains by the price rally towards 190.50 initially.
The expected trading range for today is between 186.50 and 189.20
Trend forecast: Bearish
Do you need help in trading decisions? Do you want to learn how to start trading?
Join Economies.com VIP Club and benefit from over 15 years of market analysis expertise and get:
Special Offer: Subscribe to the Economies.com VIP channel and get also a free subscription to a trusted trading signals channel provided by Best Trading Signal.
Gold price has paused its record run to near the $3,360 region early Thursday as buyers digest this week’s tariff play by US President Donald Trump heading into a light Holy Friday.
This week, the resumption of the Gold price record-setting rally could be mainly linked to the escalation of US-China trade war and the uncertainty over US tariffs’ implementation across all its major trading partners.
Increased demand for safe-haven assets and unabated fears over a potential recession in the United States (US) continued to power Gold price advance.
“Chip stocks across the globe were pummelled on Wednesday after Dutch giant ASML warned that tariffs were increasing uncertainty around its outlook for 2025 and 2026. Also weighing on sentiment was the American artificial intelligence (AI) pioneer Nvidia warning of a $5.5 billion hit after Washington restricted exports of its AI processor tailored for China,” per Reuters.
Aggravating US-Sino trade tensions, China reportedly instructed its airlines not to take any more deliveries of Boeing Co planes, Bloomberg reported.
However, US Federal Reserve (Fed) Chair Jerome Powell’s cautious stance on the interest rate outlook and the US-Japan constructive trade talks remain a headwind for the bright metal, providing some reprieve to the US Dollar (USD).
At the Economic Club of Chicago on Wednesday, Powell said, “for the time being, we are well-positioned to wait for greater clarity before considering any adjustments to our policy stance.” Powell warned of increased stagflation risks due to the likely impact of the US tariffs.
Meanwhile, Japan’s Prime Minister (PM) Shigeru Ishiba said on Thursday that talks with the US were constructive, adding that the government will continue to consider trade negotiations a top priority.
In the day ahead, Gold price could see a corrective decline as traders might take profits off the table on their Gold longs ahead of the Good Friday holiday-thinned markets. Amid tariffs uncertainty, markets will prefer to reposition, gearing up for more tariff headlines next week.
In the meantime, the focus will remain on the meeting between Trump and Italy’s PM Giorgia Meloni, due later on Thursday. Bloomberg News reported on Tuesday that the European Union (EU) expects most of the US import tariffs to remain in place after little progress was made in the latest talks.
Meanwhile, Gold traders will also take cues from the mid-tier weekly US Jobless Claims and housing data.
The daily chart shows that the 14-day Relative Strength Index (RSI) stays heavily overbought, currently near 75, hinting at a likely correction.
However, if Gold buyers find acceptance above the $3,350 level on a daily closing basis, the next upside target will be seen at the $3,400 threshold.
Conversely, the corrective decline could initially test the $3,300 demand area, below which the $3,250 psychological level could come into play.
Further south, Gold sellers will keep sight on the $3,200 mark.
Gold has played a key role in human’s history as it has been widely used as a store of value and medium of exchange. Currently, apart from its shine and usage for jewelry, the precious metal is widely seen as a safe-haven asset, meaning that it is considered a good investment during turbulent times. Gold is also widely seen as a hedge against inflation and against depreciating currencies as it doesn’t rely on any specific issuer or government.
Central banks are the biggest Gold holders. In their aim to support their currencies in turbulent times, central banks tend to diversify their reserves and buy Gold to improve the perceived strength of the economy and the currency. High Gold reserves can be a source of trust for a country’s solvency. Central banks added 1,136 tonnes of Gold worth around $70 billion to their reserves in 2022, according to data from the World Gold Council. This is the highest yearly purchase since records began. Central banks from emerging economies such as China, India and Turkey are quickly increasing their Gold reserves.
Gold has an inverse correlation with the US Dollar and US Treasuries, which are both major reserve and safe-haven assets. When the Dollar depreciates, Gold tends to rise, enabling investors and central banks to diversify their assets in turbulent times. Gold is also inversely correlated with risk assets. A rally in the stock market tends to weaken Gold price, while sell-offs in riskier markets tend to favor the precious metal.
The price can move due to a wide range of factors. Geopolitical instability or fears of a deep recession can quickly make Gold price escalate due to its safe-haven status. As a yield-less asset, Gold tends to rise with lower interest rates, while higher cost of money usually weighs down on the yellow metal. Still, most moves depend on how the US Dollar (USD) behaves as the asset is priced in dollars (XAU/USD). A strong Dollar tends to keep the price of Gold controlled, whereas a weaker Dollar is likely to push Gold prices up.
Although a minor bearish trend continuation signal triggered today, there remains a possibility that support around the 88.6% retracement at $3.21 could hold. Notice that the lower end (25% extended) of a descending trend channel (blue lines) is nearby, and it represents an area of potential support as well. That would change on a decisive drop below today’s low. Notice that today’s high found resistance at the bottom of a lower channel line, in blue. Since that line was previously identifying support, today’s price action recognized it as resistance. This is a bearish sign as a downtrend typically progresses in this manner.
A one-day bullish reversal above today’s high of $3.32 may start to change the near-term bearish outlook if it leads to a daily close above that price level. Otherwise, a decline below today’s low signals another continuation signal and improves the chance that the next lower potential support zone is tested. It starts with the completion of a falling ABCD pattern at $3.08. That is where the change in price in the two downswings of the current correction match. Once there is a match, a potential pivot level is identified, in this case support.
The 200-Day MA is slightly below that target at $3.06 and is rising. Therefore, it could converge with the ABCD pattern target upon approach. Since the 200-Day MA is a long-term trend indicator, it takes priority over the pattern target. But if the two indicators identify the same or a very similar price level, that price level gains in significance. Since the 200-Day MA hasn’t been approached as support since October 2024, it should do so if touched soon. Bearish momentum has dominated since the lower swing high (C), so natural gas would be approaching that potential support area potentially near the end of the trend.
For a look at all of today’s economic events, check out our economic calendar.