The main category of Forex News.
You can use the search box below to find what you need.
[wd_asp id=1]
The main category of Forex News.
You can use the search box below to find what you need.
[wd_asp id=1]
EUR/USD moves up and down in a narrow channel at around 1.1350 after posting small gains on Monday. The pair’s near-term technical outlook suggests that the bullish bias remains intact but investors could remain on the sidelines, waiting for the European Central Bank’s (ECB) monetary policy announcements due Thursday.
The table below shows the percentage change of Euro (EUR) against listed major currencies last 7 days. Euro was the strongest against the US Dollar.
| USD | EUR | GBP | JPY | CAD | AUD | NZD | CHF | |
|---|---|---|---|---|---|---|---|---|
| USD | -3.87% | -3.84% | -3.45% | -2.77% | -5.79% | -6.31% | -5.36% | |
| EUR | 3.87% | -0.02% | 0.39% | 1.13% | -2.00% | -2.50% | -1.56% | |
| GBP | 3.84% | 0.02% | 0.42% | 1.17% | -1.97% | -2.48% | -1.47% | |
| JPY | 3.45% | -0.39% | -0.42% | 0.71% | -2.41% | -2.98% | -1.92% | |
| CAD | 2.77% | -1.13% | -1.17% | -0.71% | -3.11% | -3.61% | -2.59% | |
| AUD | 5.79% | 2.00% | 1.97% | 2.41% | 3.11% | -0.51% | 0.51% | |
| NZD | 6.31% | 2.50% | 2.48% | 2.98% | 3.61% | 0.51% | 1.04% | |
| CHF | 5.36% | 1.56% | 1.47% | 1.92% | 2.59% | -0.51% | -1.04% |
The heat map shows percentage changes of major currencies against each other. The base currency is picked from the left column, while the quote currency is picked from the top row. For example, if you pick the Euro from the left column and move along the horizontal line to the US Dollar, the percentage change displayed in the box will represent EUR (base)/USD (quote).
The improving risk mood helped EUR/USD hold its ground at the beginning of the week. On the other hand, the US Dollar (USD) found its footing following the previous week’s steep decline and limited the pair’s upside amid easing fears over a deepening global trade conflict.
In an interview with Fox Business Network on Monday, Kevin Hassett, Director of the United States (US) National Economic Council (NEC), said that they are making “enormous progress” on tariff talks with the European Union.
The US economic calendar will feature the Federal Reserve Bank of New York’s Empire State Manufacturing Survey, alongside the Imports Price Index and Export Price Index data for March. A significant decline in the Empire State Manufacturing Index could revive concerns over an economic downturn in the US and caused the USD to come under renewed selling pressure with the immediate reaction.
Meanwhile, the data from the Eurozone showed that Industrial Production expanded by 1.1% on a monthly basis in February, surpassing the market expectation for an increase of 0.2%. On a negative note, ZEW Survey – Economic Sentiment slumped to -18.5 in April from 39.8 in March.
The Relative Strength Index (RSI) holds above 60 on Tuesday, suggesting that the bullish bias remains intact in the near term. Additionally, EUR/USD holds comfortably above the 20-period Simple Moving Average (SMA).
On the upside, 1.1400 (psychological level, static level) aligns as first resistance before 1.1470 (static level) and 1.1500 (round level). Looking south, first support could be spotted at 1.1340 (static level) ahead of 1.1300 (static level, round level) and 1.1250 (static level).
The Euro is the currency for the 19 European Union countries that belong to the Eurozone. It is the second most heavily traded currency in the world behind the US Dollar. In 2022, it accounted for 31% of all foreign exchange transactions, with an average daily turnover of over $2.2 trillion a day.
EUR/USD is the most heavily traded currency pair in the world, accounting for an estimated 30% off all transactions, followed by EUR/JPY (4%), EUR/GBP (3%) and EUR/AUD (2%).
The European Central Bank (ECB) in Frankfurt, Germany, is the reserve bank for the Eurozone. The ECB sets interest rates and manages monetary policy.
The ECB’s primary mandate is to maintain price stability, which means either controlling inflation or stimulating growth. Its primary tool is the raising or lowering of interest rates. Relatively high interest rates – or the expectation of higher rates – will usually benefit the Euro and vice versa.
The ECB Governing Council makes monetary policy decisions at meetings held eight times a year. Decisions are made by heads of the Eurozone national banks and six permanent members, including the President of the ECB, Christine Lagarde.
Eurozone inflation data, measured by the Harmonized Index of Consumer Prices (HICP), is an important econometric for the Euro. If inflation rises more than expected, especially if above the ECB’s 2% target, it obliges the ECB to raise interest rates to bring it back under control.
Relatively high interest rates compared to its counterparts will usually benefit the Euro, as it makes the region more attractive as a place for global investors to park their money.
Data releases gauge the health of the economy and can impact on the Euro. Indicators such as GDP, Manufacturing and Services PMIs, employment, and consumer sentiment surveys can all influence the direction of the single currency.
A strong economy is good for the Euro. Not only does it attract more foreign investment but it may encourage the ECB to put up interest rates, which will directly strengthen the Euro. Otherwise, if economic data is weak, the Euro is likely to fall.
Economic data for the four largest economies in the euro area (Germany, France, Italy and Spain) are especially significant, as they account for 75% of the Eurozone’s economy.
Another significant data release for the Euro is the Trade Balance. This indicator measures the difference between what a country earns from its exports and what it spends on imports over a given period.
If a country produces highly sought after exports then its currency will gain in value purely from the extra demand created from foreign buyers seeking to purchase these goods. Therefore, a positive net Trade Balance strengthens a currency and vice versa for a negative balance.
(This story was corrected on April 15 at 09:41 GMT to say that ZEW Survey – Economic Sentiment slumped to -18.5 in April, not February.)
Ethereum’s price (ETHUSD) settled with a slight decline in its most recent intraday trades, pressured by negative signals from the Relative Strength Index (RSI) after reaching overbought areas, as an attempt to gain positive momentum that may help it breach the key resistance level at $1,636, coinciding with attacking a minor bearish bias on a short-term basis. The move is supported by continued positive support, due to trading above the EMA50.
To get our more detailed analysis and 100% accurate signals provided by Best Trading Signal, subscribe to Economies.com VIP Club through the link below!
Platinum price formed a new bullish rally achieving $958.00 level, then rebound directly to settle near the barrier at $950.00 level, affected by the continuation of the contradiction between the main indicators.
The price might be forced to form mixed sideways trading, but the main stability above the support level at $920.00 represents a main factor that motivates the bullish trading, reminding you that the main targets settled near $966,00, and surpassing it will confirm regaining the main bullish bias, by its stability within the bullish channel’s levels that appear in the above image.
The expected trading range for today is between $940,00 and $966.00
Trend forecast: Bullish
Gold price is bouncing back toward the record highs of $3,246 set on Monday as buyers fight back control despite a sense of calm across the financial markets early Tuesday.
The US bond market seems to have stabilized after a brutal last week as the benchmark 10-year US Treasury bond yields fell about 10 basis points (bps), reversing a part of the recent 50 bps relentless rally.
Investors take a breather, pausing the rotation out of the US assets, digesting the ongoing back-and-forth on US President Donald Trump’s tariff headlines while bracing for the earnings results from top American banks and tech companies.
The risk reset allows the US Dollar (USD) to find its feet following the massive sell-off to three-year troughs.
US President Donald Trump said on Monday he was considering modifying the 25% tariffs imposed on foreign auto and auto parts imports from Mexico, Canada and other places, noting that car companies “need a little bit of time because they’re going to make ’em here.”
This comes after the Trump administration announced exemptions on some technology imports, including smartphones, computers, laptops and disc drives, from reciprocal tariffs imposed on China. But Trump clarified that these products will be subject to the 20% existing tariffs on China, not the steep 145% tariffs. Trump said he “will announce the tariff rate for semiconductors over the next week.”
However, markets continue to remain wary amid uncertainty over Trump’s trade policies, and his constant backpedalling on tariffs raises worries over the global economic outlook, keeping the sentiment around the traditional Gold price underpinned.
Further, increased dovish bets surrounding the US Federal Reserve (Fed) interest rate cuts also continue to act as a tailwind for the non-yielding Gold price. Fed Governor Christopher Waller said Monday that “the Trump administration’s tariff policies are a major shock to the US economy that could lead the Fed to cut rates to head off recession even if inflation remains high,” per Reuters.
Meanwhile, markets ignored comments from Atlanta Fed Bank President Raphael Bostic, who suggested that the US central bank should stay on hold until there is more clarity. They continued pricing in about 85 bps of rate cuts by December, with an 80% probability that the Fed will hold rates at its May 7 policy meeting.
Gold price also draws support from increased investment flows into China’s physically backed gold exchange-traded funds (ETFs) so far this month, according to the latest data published by the World Gold Council (WGC).
Looking ahead, the further upside in Gold price will likely remain at the mercy of Trump’s tariff headlines and the upcoming Fedspeak as the US calendar remains devoid of top-tier economic data publication.
Investors also remain unnerved ahead of China’s first-quarter Gross Domestic Product (GDP) data release on Wednesday, which could significantly impact the broader market sentiment and the Gold price action.
On Monday, China Customs reported a 12.4% surge in the country’s exports in March from a year earlier as Chinese companies rushed to ship goods before higher US tariffs took effect.
The daily chart shows that the 14-day Relative Strength Index (RSI) hovers just below the overbought region, currently near 69, pointing to more gains in the near term. T
The record high of $3,246 is the immediate topside barrier for Gold buyers. Scaling that level will open the door toward the $3,300 mark
Alternatively, the initial support aligns at the $3,200 threshold, below which the April 11 low of $3,176 will be challenged.
Additional declines could test the $3,100 round level, followed by the 21-day Simple Moving Average (SMA) resistance-turned-support at $3,084.
Gold has played a key role in human’s history as it has been widely used as a store of value and medium of exchange. Currently, apart from its shine and usage for jewelry, the precious metal is widely seen as a safe-haven asset, meaning that it is considered a good investment during turbulent times. Gold is also widely seen as a hedge against inflation and against depreciating currencies as it doesn’t rely on any specific issuer or government.
Central banks are the biggest Gold holders. In their aim to support their currencies in turbulent times, central banks tend to diversify their reserves and buy Gold to improve the perceived strength of the economy and the currency. High Gold reserves can be a source of trust for a country’s solvency. Central banks added 1,136 tonnes of Gold worth around $70 billion to their reserves in 2022, according to data from the World Gold Council. This is the highest yearly purchase since records began. Central banks from emerging economies such as China, India and Turkey are quickly increasing their Gold reserves.
Gold has an inverse correlation with the US Dollar and US Treasuries, which are both major reserve and safe-haven assets. When the Dollar depreciates, Gold tends to rise, enabling investors and central banks to diversify their assets in turbulent times. Gold is also inversely correlated with risk assets. A rally in the stock market tends to weaken Gold price, while sell-offs in riskier markets tend to favor the precious metal.
The price can move due to a wide range of factors. Geopolitical instability or fears of a deep recession can quickly make Gold price escalate due to its safe-haven status. As a yield-less asset, Gold tends to rise with lower interest rates, while higher cost of money usually weighs down on the yellow metal. Still, most moves depend on how the US Dollar (USD) behaves as the asset is priced in dollars (XAU/USD). A strong Dollar tends to keep the price of Gold controlled, whereas a weaker Dollar is likely to push Gold prices up.
Platinum price formed a new bullish rally achieving $958.00 level, then rebound directly to settle near the barrier at $950.00 level, affected by the continuation of the contradiction between the main indicators.
The price might be forced to form mixed sideways trading, but the main stability above the support level at $920.00 represents a main factor that motivates the bullish trading, reminding you that the main targets settled near $966,00, and surpassing it will confirm regaining the main bullish bias, by its stability within the bullish channel’s levels that appear in the above image.
The expected trading range for today is between $940,00 and $966.00
Trend forecast: Bullish
Trading continues near the lows of the day at the time of this writing and natural gas looks poised to close in the lower third of the day’s trading range. Currently, the low for the day is $3.31. Monday’s session began with a brief rally above Friday’s high to a high of $3.61. A retest of resistance around the center line of a falling parallel trend channel occurred before sellers took back control. A bearish outside day subsequently formed as Friday’s low was busted. Furthermore, the lower line of the descending parallel channel has also failed to hold as support.
This puts natural gas in a position to possibly test support around the 200-Day MA, now at $3.05. There are several other indicators pointing out that price zone as possible support. A falling ABCD pattern completes at $3.08, while a 61.8% Fibonacci retracement level is at $3.03, coinciding with support from the January 31 swing low at $2.99. In addition, a breakout of a symmetrical triangle pattern triggered on a move above $3.02 in November. Therefore, along with the last-January swing low, the current decline may provide a retest of that breakout zone.
The 200-Day MA was last reclaimed in September of last year and that was followed by a successful test of the line as support later in October. Since then, the price of natural gas has not approached the 200-Day line. Therefore, given the indicator confluence around the 200-Day line, the expectation is for support to be seen. Moreover, although a decline below the line is a bearish sign. Natural gas has been falling since a high of $4.90 and it may run out of bearish momentum by the time it tests the 200-Day MA.
For a look at all of today’s economic events, check out our economic calendar.

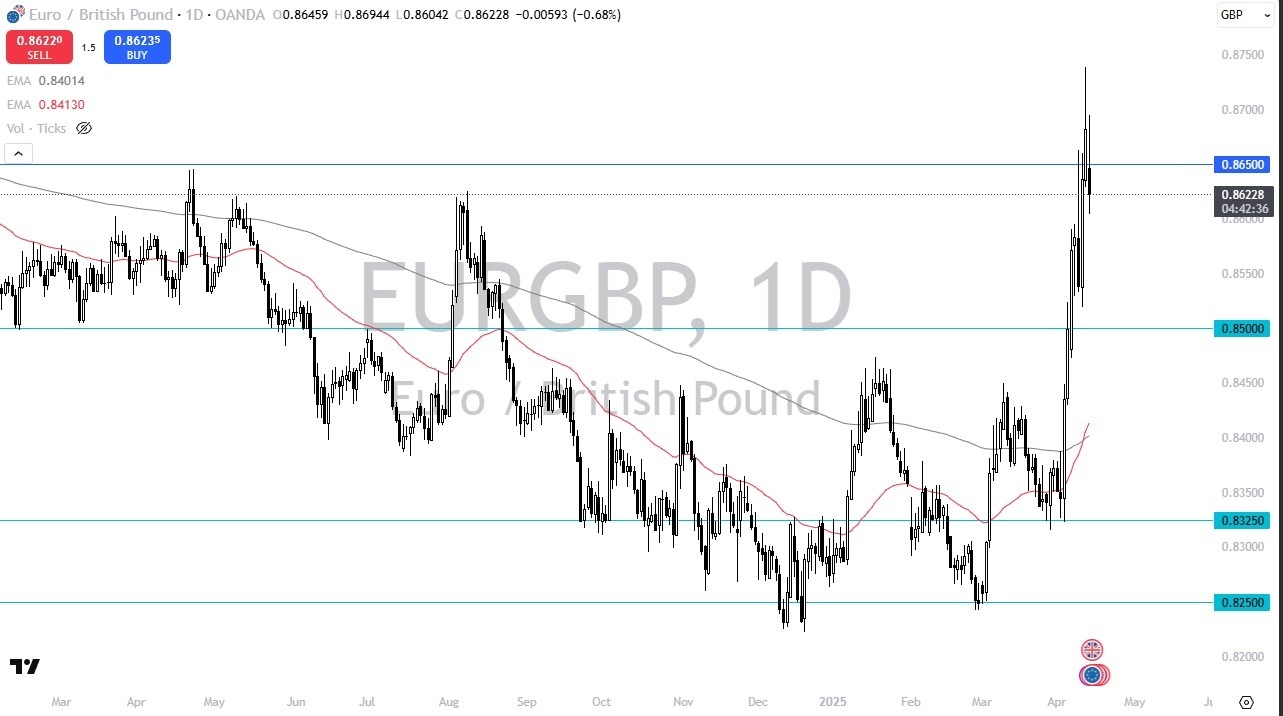
Analysis for this pair is obviously very bullish from the last couple of weeks, but when you look out at the longer-term charts, it makes a lot of sense that we could failure, because it’s an area that’s been important multiple times. In fact, I can see reactions to this level multiple times over the last several years, and that does suggest that perhaps a bit of a pullback is coming. If we do in fact fall from here, then I would anticipate buyers to come back into the picture near the 0.8520 level.
On the other hand, if we turn around and rally at this point, breaking above the 0.8750 level could very well turn this market into a runaway market on the upside. I find that a little bit difficult to swallow, but I suppose it’s possible. If that were to happen, then I think you would see the British pound suffer against most currencies, and the Euro just simply runaway against currencies at the same time. All things being equal though, the euro is overbought, and I think a pullback makes more sense than not.
All things being equal, this is a market that doesn’t typically move this quickly, and I think that in and of itself could have ramifications as to where we are going. Ultimately, this is a shorting opportunity that has a low risk to reward, mainly due to the fact that it would take so little to stop you out if you put your stop loss just above the 0.8650 area, perhaps by 20 pips or so. The downside could be the 0.8520 level rather quickly, maybe even the 0.85 level without changing the trend at all.
Ready to trade our daily forecast and analysis? Here’s a list of some of the top forex brokers UK to check out
Bitcoin price (BTCUSD) settles after a slight rise in its recent intraday trading, after witnessing fluctuated trading all day, attempting to breach the stubborn resistance level at $84,500, supported by the dominance of the bullish correctional trend on the short- term basis, accompanied by the positive signals that appear on the (RSI).
To get our more detailed analysis and 100% accurate signals provided by Best Trading Signal, subscribe to Economies.com VIP Club through the link below!
Friday’s advance to a high of $32.31 completed a 61.8% Fibonacci retracement at $32.19 and tested resistance at another trendline. The day ended at the high of the day and at the trendline but above the Fibonacci level. Signs of strength continued Monday, today, as silver traded in the top half of last Friday’s wide range day. It is on track to close strong, near the highs of the day and possibly above last week’s high. Therefore, a daily close above $32.31 will confirm the bull trend continuation signal.
Nevertheless, in the short-term silver may be extended as it challenges a key resistance zone. In particular, the 50-Day MA is at $32.51. It was a key trend indicator showing potential support until it failed on April 3, as silver fell sharply through the 20-Day MA, the 50-Day MA, and an uptrend line in one day. The decline was confirmed with a daily close below the trendline.
Prior support of the uptrend was successfully tested as resistance last Friday and then again today. Since silver has advanced by as much as $4.08 or 14.4% as of today’s high, bullish momentum may not be strong enough to reclaim the 50-Day MA and keep rising. A pullback or consolidation may come first. That was a relatively sharp advance in a short amount of time.
However, if silver can reclaim the 50-Day line and then keep rising, the 20-Day MA could see signs of resistance, now at $32.66, and the 78.6% retracement is at $33.25. Either price level could see signs of resistance. A daily close above the 50-Day MA will show continued strength and improve the chance of siler continuing higher.
For a look at all of today’s economic events, check out our economic calendar.
(Reuters) – JP Morgan on Monday lowered its oil price forecasts for 2025 and next year, citing higher production from OPEC+ and weaker demand.
The bank cut its 2025 Brent price forecast to $66 per barrel from $73 and its 2026 target to $58 from $61. It lowered the 2025 WTI price outlook to $62 per barrel from $69 and the 2026 view to $53 from $57.
Brent crude futures were trading around $65 on Monday, and U.S. West Texas Intermediate crude futures were around $61. [O/R]
JP Morgan now expects global oil demand to increase by 0.8 million barrels per day (mbd), with growth averaging only 0.3 mbd in the third quarter.
“Higher production volumes from the OPEC+ alliance indicate a shift in the reaction function, which, when combined with weaker demand, will push balances into a large surplus and drive Brent down below $60 towards year-end,” the bank said in a note.
The oil market remains under pressure from an “80% probability of a mild recession coupled with an additional 1 mbd of increased” production by the Organization of Petroleum Exporting Countries (OPEC), JP Morgan analysts said.
While OPEC+ is poised to gain market share in 2025, stabilizing the market at $60 Brent in 2026 would require the alliance not only to reverse current production increases, but to implement further cuts, JP Morgan said.
Earlier this month, Goldman Sachs reduced its Brent and WTI oil forecasts for 2025 and 2026 on the expectation of higher OPEC+ supply and the risk of an escalating trade conflict will trigger a global recession, denting demand.
(Reporting by Brijesh Patel and Ishaan Arora in Bengaluru; Editing by Chris Reese and Leslie Adler)