The main category of Forex News.
You can use the search box below to find what you need.
[wd_asp id=1]
The main category of Forex News.
You can use the search box below to find what you need.
[wd_asp id=1]
Natural gas price continued resisting the negative pressures, by its stability above $3.350 level, to decrease the chances for suffering extra losses, and increase the chances for activating the bullish track, due to stochastic exit from the oversold levels as appear in the above image.
The price rally is expected toward the extra resistance at $3.640, confirming that surpassing it is important to confirm regaining the bullish bias, by its rally directly to the positive stations near $3.950 reaching $4.180 in the medium period trading.
The expected trading range for today is between $3.450 and $3.950
Trend forecast: Bullish
Recently, the decline in the value of the US dollar to its lowest in 3 years coincided with a sharp deterioration in US stock markets, in a clear response to the White House’s trade policy, which aims to bring consumer goods production back domestically. This is expected to erode the earnings and margins of US companies in the short to medium term. This makes the astronomical, if not scandalous, valuations that have prevailed across the Pacific since at least the beginning of the first administration led by Donald Trump, if not longer, indefensible.
According to reliable trading company platforms, the stock market decline is providing a strong boost to the Euro, Swiss Franc, and Japanese Yen, which in turn exacerbates the ongoing declines in both the US Dollar (trade-weighted) and the Chinese Renminbi (trade-weighted), which has fallen significantly below the minimum level set by Beijing for the currency (CHF/CNY, JPY/CNY, and EUR/CNY).

The Pound will remain the strongest even with a rebound in the US Dollar price, and therefore, the strategy to buy GBP/USD remains in place.
Amid significant activity in the global bond market, analysts are asking, “If the US government causes stock prices to fall and reduces the profitability of US companies, we must ask ourselves: does the rest of the world still want to invest all its money in US bonds or in stocks?” and “Cash flows have become much larger than trading flows.”
Recently, the UK 10-year bond yield has been trading around 4.75%, maintaining a sense of unease about financial stability in Britain.
According to financial market experts, while bond market instability is driving outflows of US dollars from the United States, markets are anticipating instability in the UK bond market. The sell-off in British government bonds, as we have seen previously following UK financial events, coincided with temporary periods of weakness in the British pound and will increase the risk of a decline in growth in the UK if high yields persist.
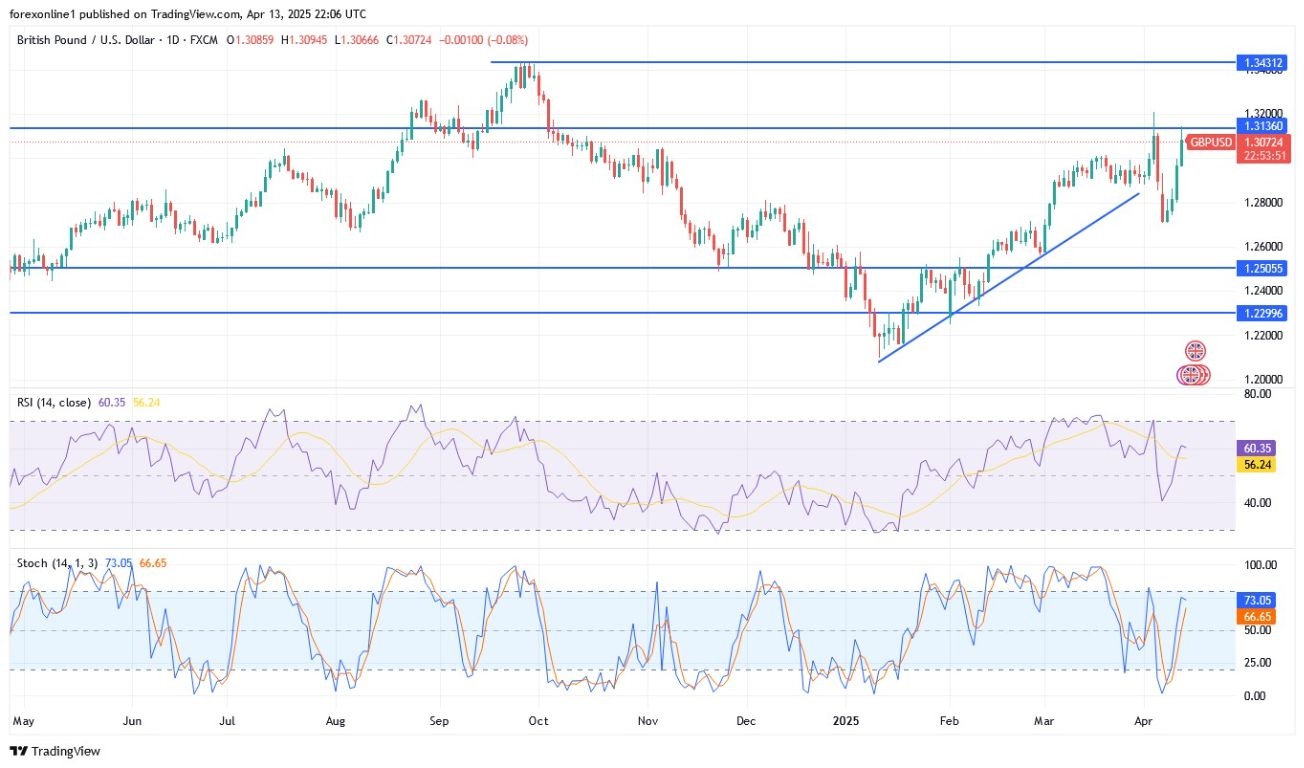
Looking at the daily chart above, you will notice that the overall trend for GBP/USD remains bullish and may continue as long as it remains stable above the psychological resistance of 1.3000. As mentioned before, this encourages technical buying for the GBP/USD pair. With the recent gains, the 14-day RSI has turned upwards and still has more room before reaching the overbought barrier. At the same time, the Stochastic oscillator is closest to breaking this barrier. The MACD indicator is also in a bullish turn. The nearest resistance levels for GBP/USD are currently 1.3140, 1.3220, and 1.3300 respectively. From the last level, technical indicators will move towards strong overbought levels.
Conversely, over the same timeframe, the 1.2880 support level will remain an important barrier to a downward trend. The currency pair is not awaiting significant performance-influencing data during today’s trading. Therefore, investor sentiment regarding risk appetite and the performance of global financial markets will continue to influence today’s trading.
Ready to trade the Forex GBP/USD analysis and predictions? Here are the best forex trading platforms UK to choose from.
Copper price resumed its bullish rally, to notice its approach from $4.5600 this morning, which represents 50%Fibonacci correction level for the last decline, which began from the top at $5.3200.
Note that the continuation of copper’s price stability below $4.5600 level as an important barrier might push it to delay the bullish attack, and providing new negative trading, to target $4.4300 and $4.3200, while breaching the barrier and holding above it will reinforce the chances for recording extra gains that might extend to $4.6800 and $4.7500.
The expected trading range for today is between $4.4300 and $4.5600
Trend forecast: Bearish
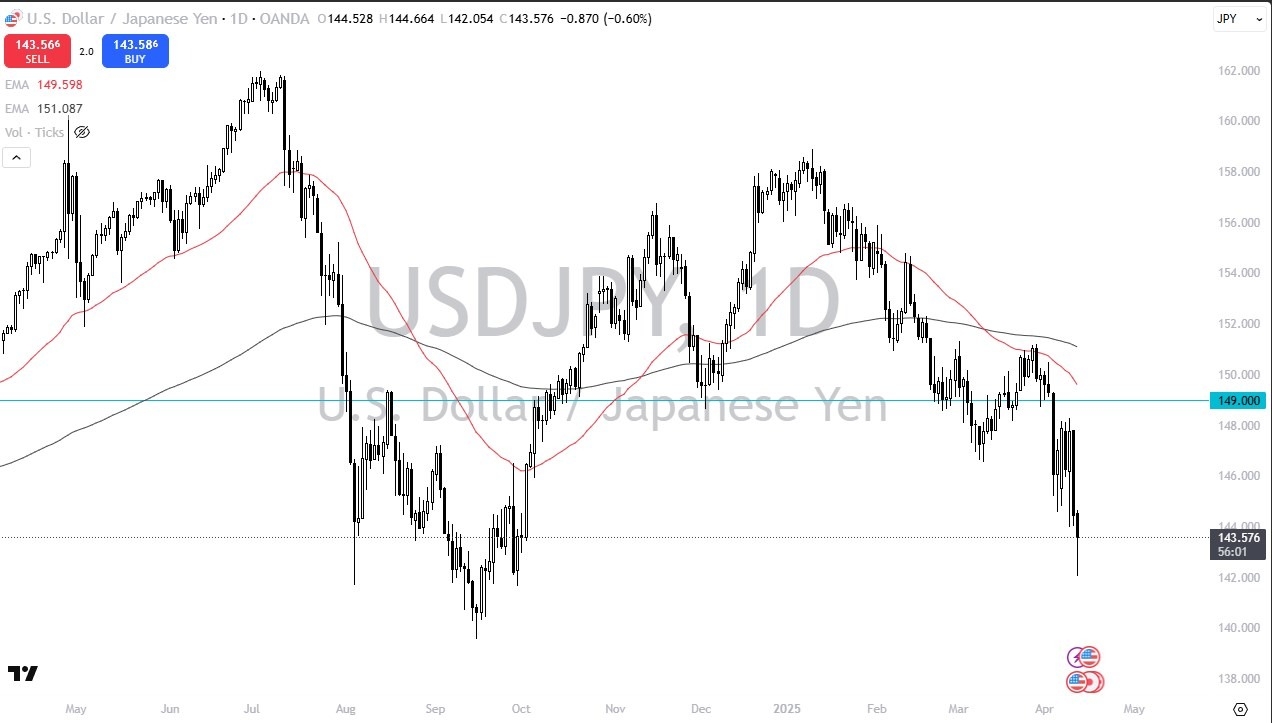
The technical analysis for this USD/JPY pair is extraordinarily negative, and I do recognize that although the interest rate differential continues to favor the US dollar, especially as bonds in America selloff, sometimes higher interest rates can be a bad thing. I think we are in one of those times right now, but if we do get some type of stability in the markets, that will probably turn this market right back around, sending the US dollar much higher against the Japanese yen.
If we were to break down below the ¥142 level, then I think it opens up the possibility of a move down to the 140 in level, which is a large, round, psychologically significant figure, and an area that historically speaking, has been important. On the other hand, if we can recapture the ¥145 level to the upside, then I think the US dollar starts to rally toward the crucial ¥148 level, an area that had been a massive barrier multiple times in the recent past. Regardless, I do think that we will see a fairly big move, and it might also be worth noting that the Friday session was when we saw a bit of a bounce, perhaps traders are a bit concerned about trying to hang onto a short trade heading into the weekend.
Want to trade our USD/JPY forex analysis and predictions? Here’s a list of forex brokers in Japan to check out.
No news for Platinum price by its repeated fluctuations below the obstacle at $950.00, which forces it to provide weak sideways trading, delaying the waited bullish rally.
Note that stochastic attempt to reach the overbought level supports the chances for gaining positive momentum, to keep waiting for breaching the current obstacle to ease achieving the extra gains, which are located near $963.00 and$976.00, while the failure of the breach will confirm the domination of the sideways scenario, with a chance for retesting the initial support at $920.00 before any attempt to reach the previously suggested targets.
The expected trading range for today is between $935.00 and $963.00
Trend forecast: Bullish
EUR/USD gained more than 3.5% in the previous week and touched its highest level in over three years above 1.1470 on Friday. Following a technical correction heading into the weekend, the pair started the week slightly lower but didn’t have a difficult time regaining its traction. At the time of press, EUR/USD was trading in positive territory at around 1.1400.
The table below shows the percentage change of Euro (EUR) against listed major currencies last 7 days. Euro was the strongest against the US Dollar.
| USD | EUR | GBP | JPY | CAD | AUD | NZD | CHF | |
|---|---|---|---|---|---|---|---|---|
| USD | -3.87% | -2.28% | -1.76% | -3.00% | -4.73% | -5.24% | -4.55% | |
| EUR | 3.87% | 1.94% | 2.82% | 1.54% | -0.96% | -0.80% | -0.09% | |
| GBP | 2.28% | -1.94% | -0.41% | -0.39% | -2.85% | -2.70% | -2.00% | |
| JPY | 1.76% | -2.82% | 0.41% | -1.22% | -2.08% | -2.33% | -2.50% | |
| CAD | 3.00% | -1.54% | 0.39% | 1.22% | -2.13% | -2.31% | -1.87% | |
| AUD | 4.73% | 0.96% | 2.85% | 2.08% | 2.13% | 0.16% | 0.87% | |
| NZD | 5.24% | 0.80% | 2.70% | 2.33% | 2.31% | -0.16% | 0.72% | |
| CHF | 4.55% | 0.09% | 2.00% | 2.50% | 1.87% | -0.87% | -0.72% |
The heat map shows percentage changes of major currencies against each other. The base currency is picked from the left column, while the quote currency is picked from the top row. For example, if you pick the Euro from the left column and move along the horizontal line to the US Dollar, the percentage change displayed in the box will represent EUR (base)/USD (quote).
Although easing tensions surrounding the US-China trade conflict seems to be helping the market mood improve at the beginning of the week, the US Dollar (USD) finds it difficult to attract buyers.
US President Donald Trump’s administration granted some technology imports, including smartphones, computers, laptops and disc drives, exemptions from the steep 125% additional tariffs imposed on China. These products will reportedly still be subject to the 20% existing tariffs, which were imposed initially because of the fentanyl crisis in the US.
Over the weekend, US Commerce Secretary Howard Lutnick said that technology imports, alongside semiconductors, will face separate new levies within the next two months.
Reflecting the positive shift in risk sentiment, US stock index futures rise between 0.9% and 1.8% in the European morning.
The economic calendar will not feature any high-tier data releases on Monday. Later in the American session, several Federal Reserve (Fed) policymakers will be delivering speeches. The CME FedWatch Tool shows that markets are currently pricing in about a 20% probability of a 25 basis points Fed rate cut at the May policy meeting. In case Fed officials reiterate the need to remain patient regarding policy-easing, the USD could stay resilient against its peers and limit EUR/USD’s upside.
The Relative Strength Index (RSI) indicator on the 4-hour chart holds above 70, suggesting that EUR/USD remains technically overbought.
In case EUR/USD stabilizes above 1.1400 (psychological level, static level), 1.1470 (static level) could be seen as next resistance before 1.1500 (round level). Looking south, first support could be spotted at 1.1340 (static level) ahead of 1.1300 (static level, round level) and 1.1250 (static level).
The Euro is the currency for the 19 European Union countries that belong to the Eurozone. It is the second most heavily traded currency in the world behind the US Dollar. In 2022, it accounted for 31% of all foreign exchange transactions, with an average daily turnover of over $2.2 trillion a day.
EUR/USD is the most heavily traded currency pair in the world, accounting for an estimated 30% off all transactions, followed by EUR/JPY (4%), EUR/GBP (3%) and EUR/AUD (2%).
The European Central Bank (ECB) in Frankfurt, Germany, is the reserve bank for the Eurozone. The ECB sets interest rates and manages monetary policy.
The ECB’s primary mandate is to maintain price stability, which means either controlling inflation or stimulating growth. Its primary tool is the raising or lowering of interest rates. Relatively high interest rates – or the expectation of higher rates – will usually benefit the Euro and vice versa.
The ECB Governing Council makes monetary policy decisions at meetings held eight times a year. Decisions are made by heads of the Eurozone national banks and six permanent members, including the President of the ECB, Christine Lagarde.
Eurozone inflation data, measured by the Harmonized Index of Consumer Prices (HICP), is an important econometric for the Euro. If inflation rises more than expected, especially if above the ECB’s 2% target, it obliges the ECB to raise interest rates to bring it back under control.
Relatively high interest rates compared to its counterparts will usually benefit the Euro, as it makes the region more attractive as a place for global investors to park their money.
Data releases gauge the health of the economy and can impact on the Euro. Indicators such as GDP, Manufacturing and Services PMIs, employment, and consumer sentiment surveys can all influence the direction of the single currency.
A strong economy is good for the Euro. Not only does it attract more foreign investment but it may encourage the ECB to put up interest rates, which will directly strengthen the Euro. Otherwise, if economic data is weak, the Euro is likely to fall.
Economic data for the four largest economies in the euro area (Germany, France, Italy and Spain) are especially significant, as they account for 75% of the Eurozone’s economy.
Another significant data release for the Euro is the Trade Balance. This indicator measures the difference between what a country earns from its exports and what it spends on imports over a given period.
If a country produces highly sought after exports then its currency will gain in value purely from the extra demand created from foreign buyers seeking to purchase these goods. Therefore, a positive net Trade Balance strengthens a currency and vice versa for a negative balance.
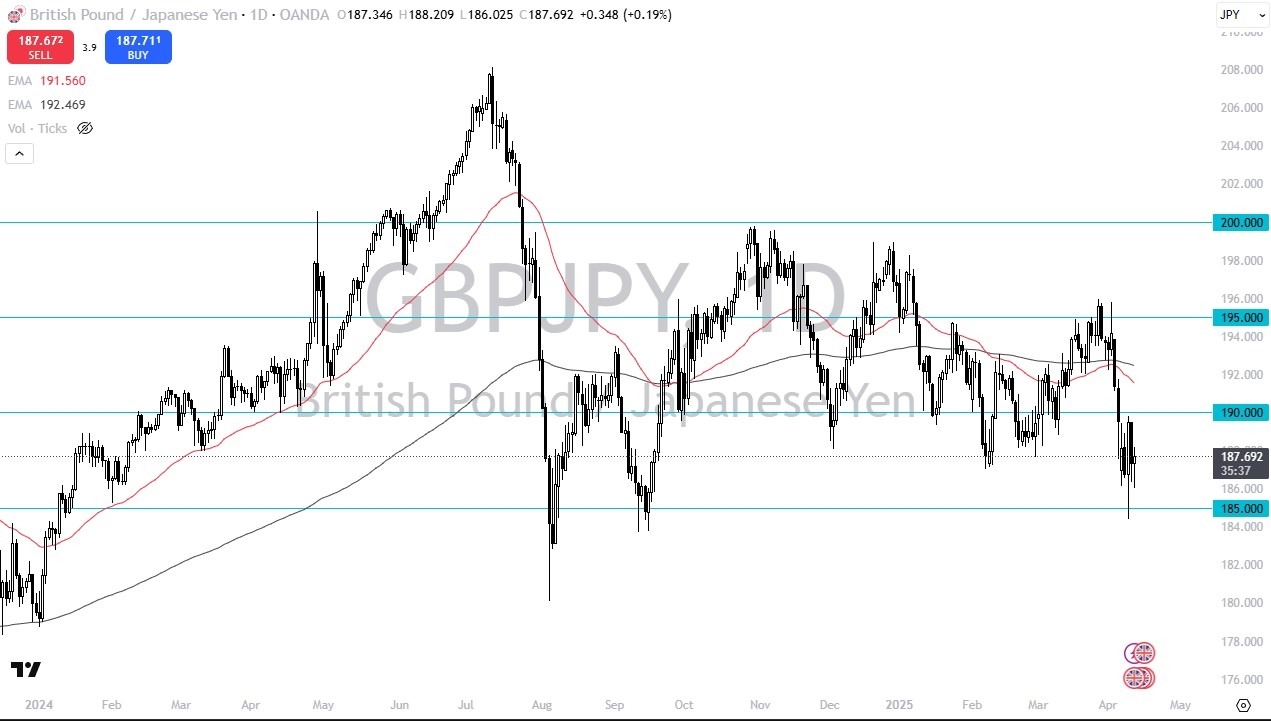
This is a market that I think given enough time we will have to sort out what was to do next, but in the meantime, I think we should probably look at this as being in the middle of a consolidation pattern, with the ¥185 level on the bottom in the ¥190 level on the top. As we are basically hanging around the ¥187.50 level, we are essentially in the middle of this range, and therefore you can make an argument that we are basically at “fair value.”
If we were to break above the ¥190 level, then I think we have a real shot at this pair going much higher, perhaps to the ¥195 level, and also I think you could see the Japanese yen get hammered against most currencies, not just this one. On the other hand, if this pair were to break down below the ¥185 level, then there’s a real shot that the Japanese yen strengthens against almost everything else as well. At this point, it seems like it’s all about the Japanese yen and the safety trade, which of course the Japanese yen is considered to be a “safety currency.” Until things settle down, it’s probably somewhat sluggish to the upside.
Begin trading our daily forecasts and analysis. Here is a list of Forex brokers in Japan to work with.
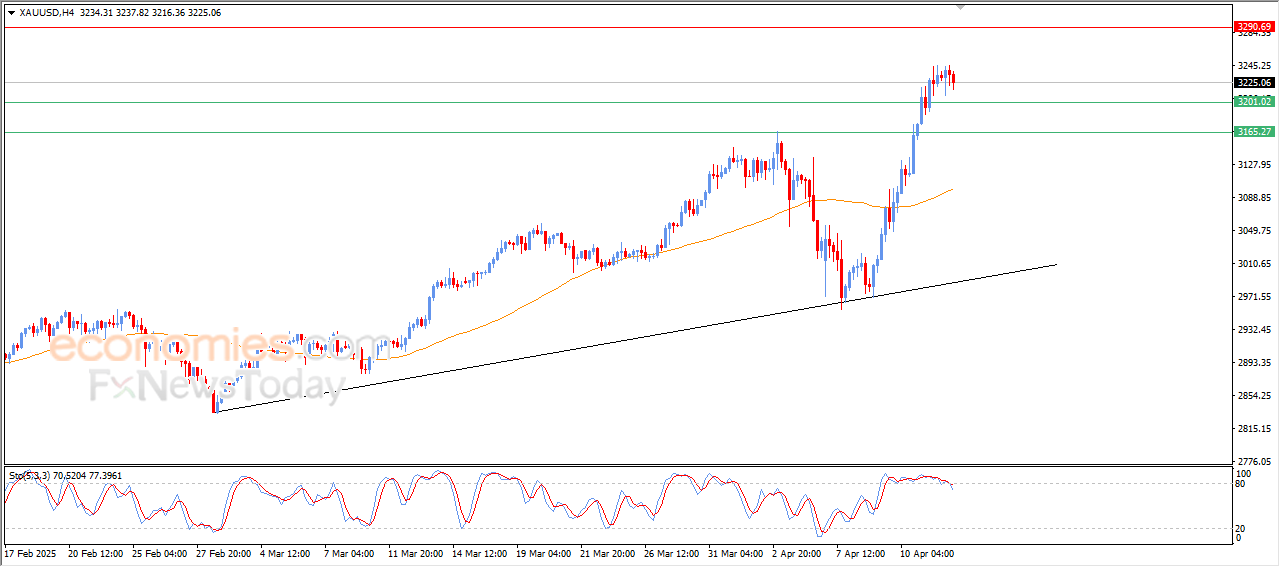
Gold price is sustaining its retreat from all-time highs of $3,245 reached on Friday, reverting toward $3,200 early Monday.
Having posted an outstanding 6.5% weekly gain, Gold price kicks off a new week on the back foot, pausing its three-day record-setting rally. The latest downtick in Gold price could be attributed to the positive shift in risk sentiment following a tumultuous week.
US President Donald Trump’s tariff concession on the Chinese electronics supply chain, hopes of more stimulus coming from China and Beijing’s stance of ignoring further US responses have offered markets some relief, diminishing the safe-haven appeal of the Gold price.
Trump clarified late Sunday that there will be no tariff exemption on semiconductors and the electronics supply chain but these products will be subject to the existing 20% tariffs on fentanyl and not the 145% levies.
This comes after China said on Friday that it will ignore further US responses after raising tariffs on US good to 125%, in retaliation to Trump’s 145% tariffs.
Meanwhile, Chinese policymakers vow to step up stimulus to cushion the world’s second-largest economy from the impact of the escalating trade war with the United States (US).
Gold price also bears the brunt of some progress on the US-Iran geopolitical talks. According to Reuters, US envoy Steve Witkoff and Iranian Foreign Minister Abbas Araghchi spoke for around 45 minutes on Saturday, with the Trump administration reportedly satisfied with the first round of talks. The second round of negotiations are expected to continue later this week.
That said, any dip in Gold price is likely to be bought in as traders remain wary about tariff talks and ahead of Wednesday’s Chinese first-quarter growth figures. Markets also remain unnerved as the US earnings season begins later this week.
In the meantime, Gold traders will look forward to China’s March trade data. However, the data is unlikely to show the full impact of the US-Sino trade war. Later in the day, several Federal Reserve (Fed) policymakers are scheduled to speak. Their take on Trump’s tariffs and hints on the Fed’s next interest rate move could provide some trading incentives in Gold price.
The daily chart shows that the 14-day Relative Strength Index (RSI) has eased from the overbought region to currently trade near 69, suggesting that the corrective pullback will likely be shallow.
The first area of contention for sellers is at the $3,200 threshold, below which Friday’s low of $3,176 will be challenged.
Additional declines could test the $3,100 round level, followed by the 21-day Simple Moving Average (SMA) resistance-turned-support at $3,074.
Conversely, the record high of $3,245 is the immediate topside barrier for Gold buyers. Scaling that level will open the door toward the $3,300 mark.
Gold price is back in the red early Monday, snapping a three-day record rally to lifetime highs of $3,245 set on Friday.
Safe-haven flows appear to have eased in Asian trading on Monday as traders rejoice in Wall Street’s turnaround on Friday alongside some positive updates on the US-China tariff war, alleviating the bullish pressure on the Gold price for now.
On Friday, China responded to the US tariff hike to 145% by raising tariffs on American goods to 125%. However, Beijing said it would ignore further US responses.
Over the weekend, US President Donald Trump considered imposing 20% tariffs on Chinese semiconductors and the electronics supply chain against the previously announced 145% levies.
These tariff updates seem to be perceived positively by markets, as they provide some consolation and allow a modest recovery in the US Dollar against its major currency rivals from 35-month lows.
The US Dollar uptick and risk appetite keep the corrective downside intact in Gold price as traders await China’s Trade Balance report and speeches from several US Federal Reserve (Fed) policymakers for further trading impetus.
Markets could use the excuse of not-so-steep tariffs on Chinese electronics and chips to take profits off the table following the recent Gold price upsurge.
Tariffs are customs duties levied on certain merchandise imports or a category of products. Tariffs are designed to help local producers and manufacturers be more competitive in the market by providing a price advantage over similar goods that can be imported. Tariffs are widely used as tools of protectionism, along with trade barriers and import quotas.
Although tariffs and taxes both generate government revenue to fund public goods and services, they have several distinctions. Tariffs are prepaid at the port of entry, while taxes are paid at the time of purchase. Taxes are imposed on individual taxpayers and businesses, while tariffs are paid by importers.
There are two schools of thought among economists regarding the usage of tariffs. While some argue that tariffs are necessary to protect domestic industries and address trade imbalances, others see them as a harmful tool that could potentially drive prices higher over the long term and lead to a damaging trade war by encouraging tit-for-tat tariffs.
During the run-up to the presidential election in November 2024, Donald Trump made it clear that he intends to use tariffs to support the US economy and American producers. In 2024, Mexico, China and Canada accounted for 42% of total US imports. In this period, Mexico stood out as the top exporter with $466.6 billion, according to the US Census Bureau. Hence, Trump wants to focus on these three nations when imposing tariffs. He also plans to use the revenue generated through tariffs to lower personal income taxes.
Important DisclaimersThe content provided on the website includes general news and publications, our personal analysis and opinions, and contents provided by third parties, which are intended for educational and research purposes only. It does not constitute, and should not be read as, any recommendation or advice to take any action whatsoever, including to make any investment or buy any product. When making any financial decision, you should perform your own due diligence checks, apply your own discretion and consult your competent advisors. The content of the website is not personally directed to you, and we does not take into account your financial situation or needs.The information contained in this website is not necessarily provided in real-time nor is it necessarily accurate. Prices provided herein may be provided by market makers and not by exchanges.Any trading or other financial decision you make shall be at your full responsibility, and you must not rely on any information provided through the website. FX Empire does not provide any warranty regarding any of the information contained in the website, and shall bear no responsibility for any trading losses you might incur as a result of using any information contained in the website.The website may include advertisements and other promotional contents, and FX Empire may receive compensation from third parties in connection with the content. FX Empire does not endorse any third party or recommends using any third party’s services, and does not assume responsibility for your use of any such third party’s website or services.FX Empire and its employees, officers, subsidiaries and associates, are not liable nor shall they be held liable for any loss or damage resulting from your use of the website or reliance on the information provided on this website.Risk DisclaimersThis website includes information about cryptocurrencies, contracts for difference (CFDs) and other financial instruments, and about brokers, exchanges and other entities trading in such instruments. Both cryptocurrencies and CFDs are complex instruments and come with a high risk of losing money. You should carefully consider whether you understand how these instruments work and whether you can afford to take the high risk of losing your money.FX Empire encourages you to perform your own research before making any investment decision, and to avoid investing in any financial instrument which you do not fully understand how it works and what are the risks involved.