The main category of Forex News.
You can use the search box below to find what you need.
[wd_asp id=1]
The main category of Forex News.
You can use the search box below to find what you need.
[wd_asp id=1]
April 9, 2025 – Written by Tim Boyer
STORY LINK Euro to Pound Forecasts RAISED to 0.86 in Six Months at Rabobank
Foreign exchange analysts at Rabobank have raised their exchange rate forecasts for the Euro versus the Pound Sterling.
Recent US tariff concerns have driven investors towards currencies backed by current account surpluses, benefiting the Euro (EUR).
“The Eurozone’s current account surplus appears to be a source of support for the EUR currently.”
The Euro’s resilience as a temporary safe haven reflects investors’ preference to hold cash amid market uncertainty.
“Investors appear to be sitting on cash in CHF, JPY and EURs while waiting for current fog of uncertainty to clear.”
The Pound Sterling (GBP) remains vulnerable due to the UK’s persistent current account deficit, especially when domestic fundamentals weaken.
“The UK’s current account deficit can leave GBP exposed when UK fundamentals turn sour and international investors look for the exits.”

Germany’s shift towards increased public spending, notably in defence and technology, further boosts the Euro’s attractiveness.
“Investors had already been looking for fresh opportunities in Europe, so sitting on cash in EURs may seem like a reasonable position.”
Consequently, Rabobank has raised its EUR/GBP forecast to 0.85 for the six-month horizon.
“We have adjusted our EUR/GBP forecasts higher and now see the currency pair at 0.85 on a 6 month vs. compared with a previous forecast of 0.83.”

International Money Transfer? Ask our resident FX expert a money transfer question or try John’s new, free, no-obligation personal service! ,where he helps every step of the way,
ensuring you get the best exchange rates on your currency requirements.
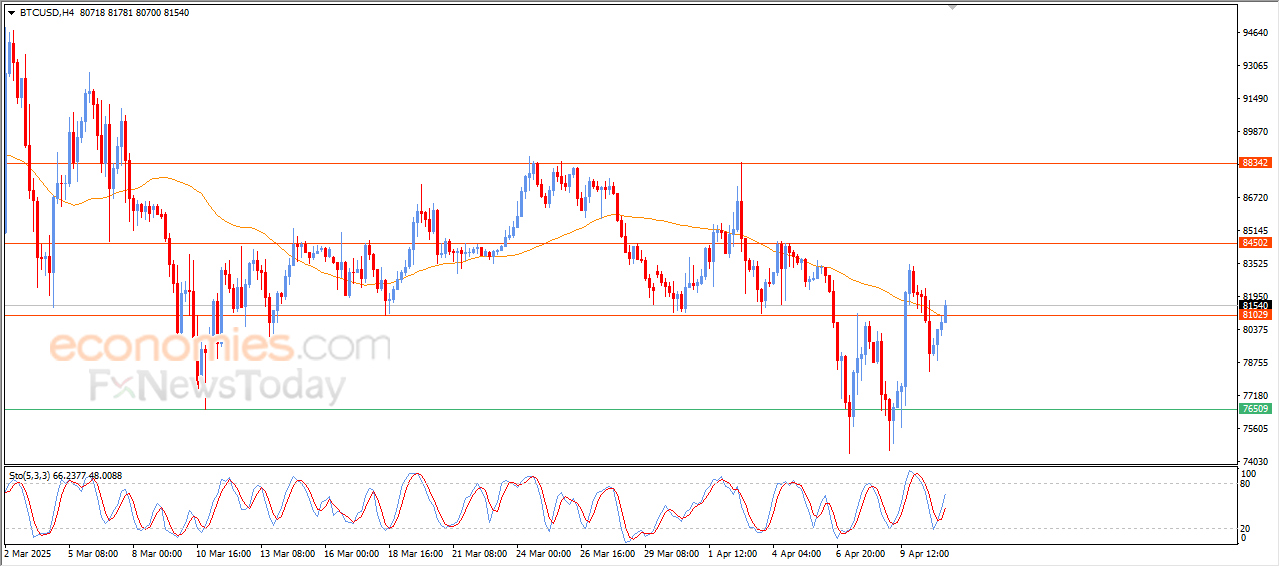
Bitcoin (BTCUSD) has risen in its recent intraday trading, surpassing the negative pressure from the EMA50, breaching the strong resistance level at $81,000, which supports the bullish scenario, especially with the positive signals that appearing on the Relative Strength Index (RSI).
To get our more detailed analysis and 100% accurate signals provided by Best Trading Signal, subscribe to Economies.com VIP Club through the link below!
At the time of this writing, natural gas continues to trade above the midpoint of the day’s trading range and looks likely to end the day with a potentially bullish hammer or doji hammer candlestick pattern. The high for the day was $3.58. Earlier in the session a breakdown of an inside day pattern from Thursday triggered, resulting in a test of support as mentioned above. Since a potentially bullish one-day pattern followed, today’s closing price is likely to be above Thursday’s low of $3.47. This sets up a potentially bullish pattern heading into next week.
Nonetheless, it is not just today’s pattern that is potentially bullish, it is also the combination with the patterns of the prior two days. Since natural gas is likely to close inside yesterday’s range and in the top half of today’s price range, the bearish breakdown shows signs of a failed pattern. The three-candle combination is a potentially bullish hikkake pattern. It can be both a reversal or continuation pattern and it will trigger on a rally above Thursday’s high of $3.75.
However, an advance above today’s high can provide an earlier valid bullish signal regardless of the hikkake pattern being present. Given the three-period combination, it is a potentially powerful short-term pattern. Of course, a drop below today’s low is short-term bearish and indicates a failure of the potentially bullish pattern
Initial upside targets start with the four-day high of $3.83 and the 50-Day MA, now at $3.89. A declining trendline at the top of the channel may also be around the 50-Day line when approached, and it may provide clues. Subsequently, if an upside breakout of the downtrend line triggers the 50% retracement at $4.12 becomes a potential target, followed by an interim swing high and 61.8% Fibonacci retracement at $4.26 and $4.30, respectively.
For a look at all of today’s economic events, check out our economic calendar.
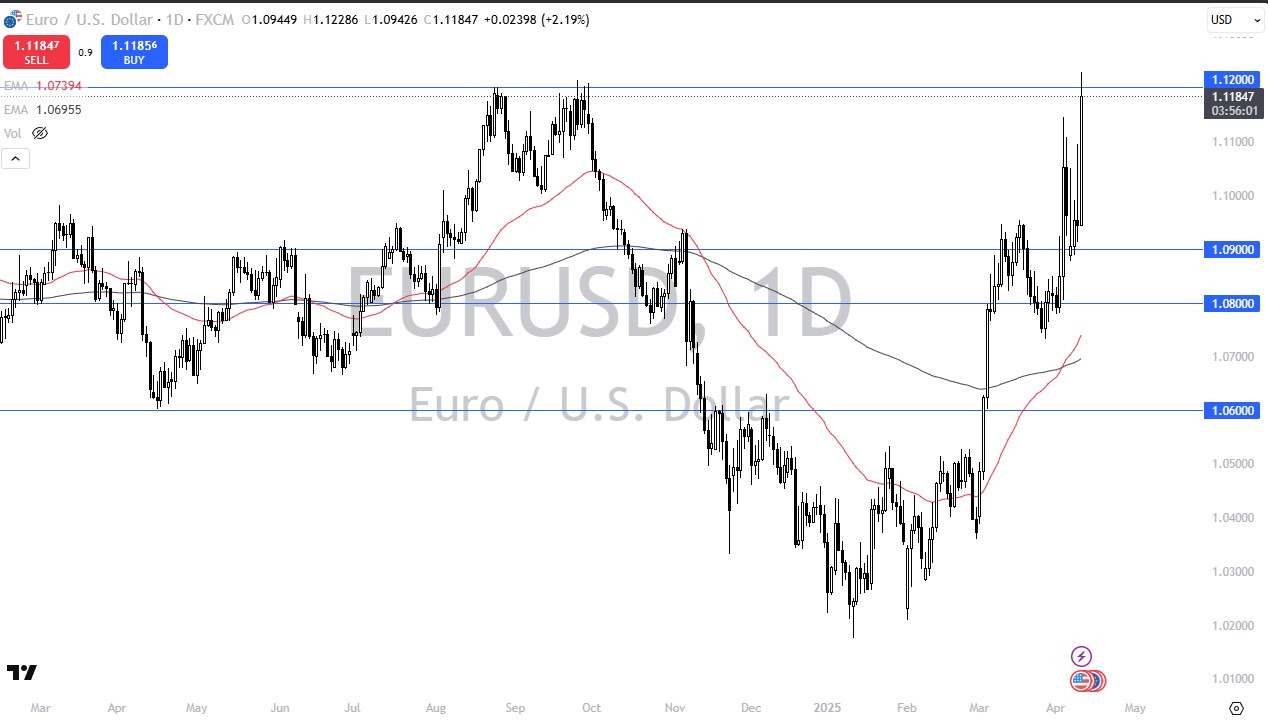
While Germany is exiting a recession, it looks like the United States might be heading toward one. Whether or not it is a long-term recession remains to be seen, but it’s worth noting that the CPI numbers were lower than anticipated during the trading session on Thursday, and of course traders are already starting to perhaps get in the back of their mind that the Federal Reserve may have to come in and start cutting rates. If they actually do that, then it makes a lot of sense that we would see the US dollar weaken.

What’s interesting to me is that this is a market that could turn around just as quickly as it rallied, because quite frankly, if the global economy slows down, Europe is not going to be immune from it. Ironically, yields in America are rallying while the dollar is falling, suggesting that perhaps there is still a major influence on the air due to U.S. Treasury selling. Eventually, if countries wish to do cross-border transactions, they will need those US dollars. It is because of this and the structure of the Euro dollar system that I think the upside will eventually slow down.
That being said, we could go to the 1.15 level, but we could just as easily see some type of shock to the system that sends everybody back down to the 1.10 level. Ultimately, the market is certainly trying to break out, but it still got some work to do see if it has any real follow-through at this point.
Ready to trade our daily Forex analysis? We’ve made a list of the best online forex trading platform worth trading with.
The CADCHF pair’s price kept the negative stability below 0.6020 barrier, affected by the negativity of the main indicators, to notice resuming the negative attack by reaching 0.5850.
No escape of the price from forming more of the bearish waves, due to the validation of the main negative factors, to expect reaching the extra target at 0.5785, and breaking it might extend the losses in the near period towards 0.5715 reaching to the support level of the bearish channel’s support at 0.5645.
The expected trading range for today is between 0.5715 and 0.5950.
Trend forecast: Bearish
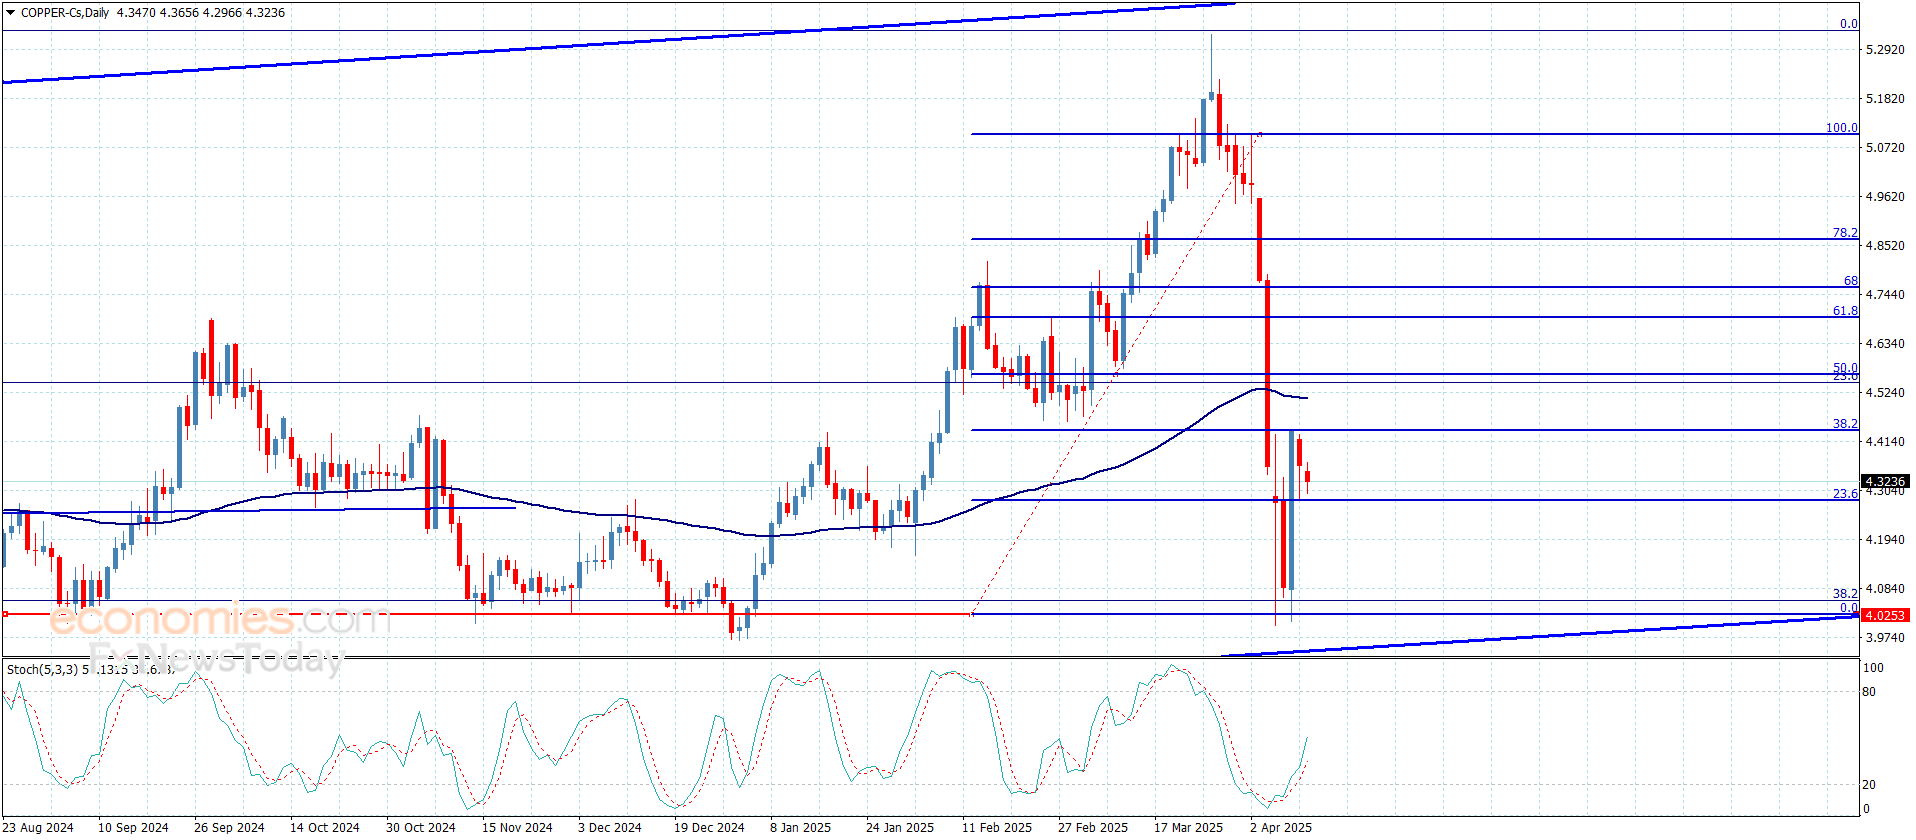
Copper price didn’t move anything since yesterday’s trading, delaying the bullish rally by its repeated fluctuation below 38.2%Fibonacci correction level, which represents an intraday obstacle by its stability near $4.4000.
The continuation of stochastic attempts to provide positive momentum and the repeated stability above the critical support at $4.000, these factors make us keep the bullish suggestion, to expect the mentioned obstacle and holding above it, targeting extra positive stations that begin at $4.5600 and $4.6800.
The expected trading range for today is between $4.2300 and $4.5600
Trend forecast: Bullish
While Germany is exiting a recession, it looks like the United States might be heading toward one. Whether or not it is a long-term recession remains to be seen, but it’s worth noting that the CPI numbers were lower than anticipated during the trading session on Thursday, and of course traders are already starting to perhaps get in the back of their mind that the Federal Reserve may have to come in and start cutting rates. If they actually do that, then it makes a lot of sense that we would see the US dollar weaken.
What’s interesting to me is that this is a market that could turn around just as quickly as it rallied, because quite frankly, if the global economy slows down, Europe is not going to be immune from it. Ironically, yields in America are rallying while the dollar is falling, suggesting that perhaps there is still a major influence on the air due to U.S. Treasury selling. Eventually, if countries wish to do cross-border transactions, they will need those US dollars. It is because of this and the structure of the Euro dollar system that I think the upside will eventually slow down.
That being said, we could go to the 1.15 level, but we could just as easily see some type of shock to the system that sends everybody back down to the 1.10 level. Ultimately, the market is certainly trying to break out, but it still got some work to do see if it has any real follow-through at this point.
Ready to trade our daily Forex analysis? We’ve made a list of the best online forex trading platform worth trading with.
The EURJPY pair provided several mixed waves since yesterday, due to the contradiction between the main indicators’ positivity and the overall stability below the bearish channel’s resistance at 163.20, to notice its stability near 161.85 without achieving any of the waited negative targets.
The price needs a new negative momentum, to reinforce the efficiency of the bearish track, which might target 160.60 level and 159.60, while the price surrender to the positivity of the main indicators and its rally above the main resistance will confirm its readiness to build a new bullish track, to begin targeting several positive stations by attacking 164.10 level initially, reaching 164.85.
The expected trading range for today is between 160.60 and 162.50
Trend forecast: Bearish
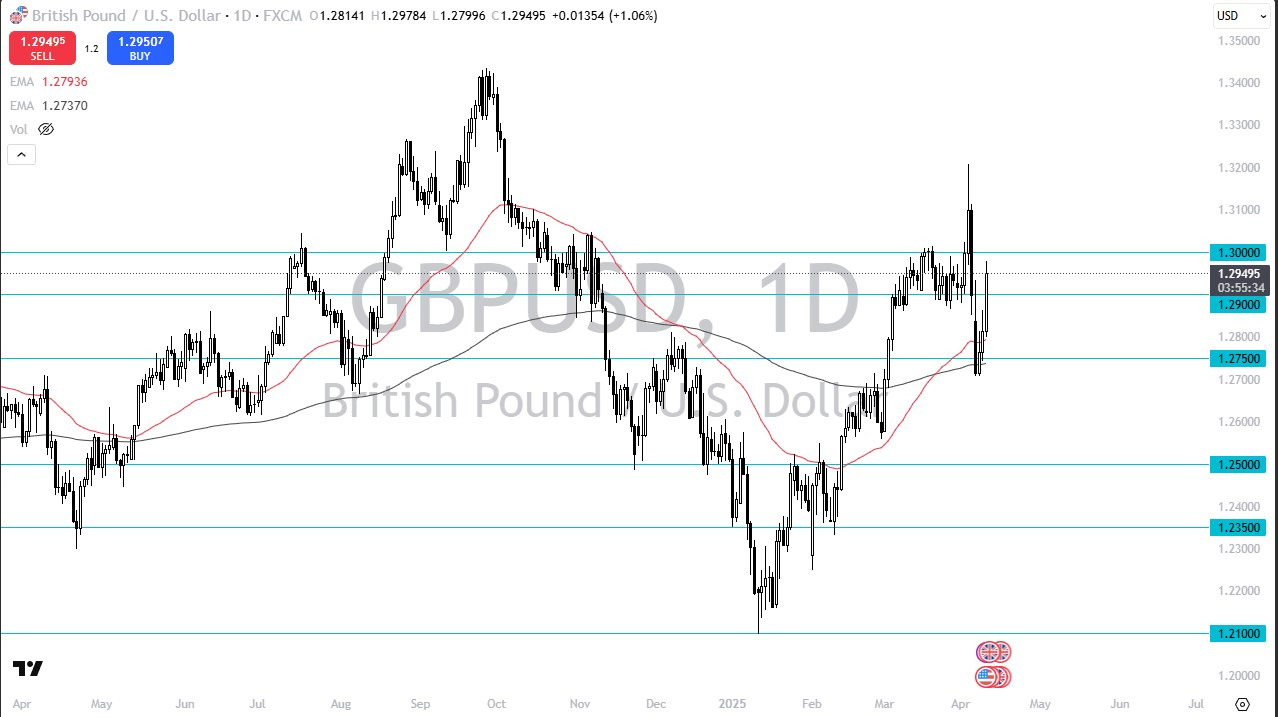
The technical analysis for the GBP/USD pair is all over the place, and it really comes down to what your time frame is. After all, short-term traders have been whipped in both directions over the last couple of days, but longer-term traders have been buyers over the last several months. That being said, the market is likely to continue to see a lot of volatility, see you do have to be cautious with your position sizing. That being said, it is worth noting that the pair is approaching the crucial 1.30 level, which of course is a large, round, psychologically significant figure, and an area where we have seen a lot of business conducted.
I think the next couple of days will be crucial, because it will give us an idea as to what people are going to do for safety. After all, treasuries are selling off, giving higher interest rates in America, which is a bit counterintuitive. As long as that’s the case, then you will see the British pound in other currencies do quite well against the US dollar, but if traders run to treasuries for safety again, that will drive up the US dollar. As things stand right now, it feels a little bit like we are seeing a lot of capital flight from the United States, perhaps due to the tariff wars.
That being said, there’s a lot to take in here, and I do think that we have a situation where we probably try to carve out some type of range using the 1.2750 level is the bottom, and it may be the 1.30 level as the top. We could even extend that to the 1.32 level, due to the massive amounts of volatility that we continue to see an all markets, not just this one.
Ready to trade the GBP/USD Forex analysis? Check out the best forex trading company in UK worth using.
Silver (XAG/USD) struggles to capitalize on its modest intraday uptick and retreats slightly after touching a fresh weekly high, around the $31.30 region during the early European session on Thursday. The intraday selling picks up pace in the last hour and drags the white metal back below the $31.00 mark as traders now look forward to the US consumer inflation figures before placing fresh directional bets.
From a technical perspective, the XAG/USD now seems to have found acceptance above the 38.2% Fibonacci retracement level of the recent slump from the March swing high to a fresh year-to-date low touched earlier this week. The subsequent move up, however, stalls ahead of the 50% Fibo. level. Moreover, oscillators on the daily chart – though they have been recovering from lower levels – are holding in negative territory. This, in turn, warrants some caution before positioning for an extension of the weekly uptrend from the $28.25 region, or the lowest level since September 2024.
In the meantime, any further slide below the 38.2% Fibo. level is likely to find some support near the $30.55 region. Some follow-through selling, however, could make the XAG/USD vulnerable to accelerate the fall towards the $30.00 psychological mark en route to the 23.6% Fibo. level, around the $29.80-$29.75 zone. Failure to defend the said support levels would shift the near-term bias back in favor of bearish traders. The white metal might then decline to the $29.35-$29.30 zone en route to the $29.00 mark and eventually aim towards retesting the multi-month low, around the $28.25 region.
On the flip side, bulls might now wait for a sustained strength beyond the daily swing high, around the $31.30 region, which nears the 50% Fibo. level, before placing fresh bets. The subsequent move-up should allow the XAG/USD to reclaim the $32.00 mark and climb further towards the 61.8% Fibo. level, around the $32.15-$32.20 zone. The latter should act as a key pivotal point, which if cleared decisively will be seen as a fresh trigger for bullish traders and lift the white metal beyond the $32.65 intermediate barrier, towards the $33.00 round figure.
Silver is a precious metal highly traded among investors. It has been historically used as a store of value and a medium of exchange. Although less popular than Gold, traders may turn to Silver to diversify their investment portfolio, for its intrinsic value or as a potential hedge during high-inflation periods. Investors can buy physical Silver, in coins or in bars, or trade it through vehicles such as Exchange Traded Funds, which track its price on international markets.
Silver prices can move due to a wide range of factors. Geopolitical instability or fears of a deep recession can make Silver price escalate due to its safe-haven status, although to a lesser extent than Gold’s. As a yieldless asset, Silver tends to rise with lower interest rates. Its moves also depend on how the US Dollar (USD) behaves as the asset is priced in dollars (XAG/USD). A strong Dollar tends to keep the price of Silver at bay, whereas a weaker Dollar is likely to propel prices up. Other factors such as investment demand, mining supply – Silver is much more abundant than Gold – and recycling rates can also affect prices.
Silver is widely used in industry, particularly in sectors such as electronics or solar energy, as it has one of the highest electric conductivity of all metals – more than Copper and Gold. A surge in demand can increase prices, while a decline tends to lower them. Dynamics in the US, Chinese and Indian economies can also contribute to price swings: for the US and particularly China, their big industrial sectors use Silver in various processes; in India, consumers’ demand for the precious metal for jewellery also plays a key role in setting prices.
Silver prices tend to follow Gold’s moves. When Gold prices rise, Silver typically follows suit, as their status as safe-haven assets is similar. The Gold/Silver ratio, which shows the number of ounces of Silver needed to equal the value of one ounce of Gold, may help to determine the relative valuation between both metals. Some investors may consider a high ratio as an indicator that Silver is undervalued, or Gold is overvalued. On the contrary, a low ratio might suggest that Gold is undervalued relative to Silver.