The main category of Forex News.
You can use the search box below to find what you need.
[wd_asp id=1]
The main category of Forex News.
You can use the search box below to find what you need.
[wd_asp id=1]
Foreign exchange analysts at Rabobank have raised its one-month Euro to Dollar forecast to 1.15 from 1.14, but still see little prospect of a clean breakout from the pair’s recent range.
The Euro to US Dollar (EUR/USD) exchange rate was trading around 1.1529 late on Thursday, close to where it began August.
The pair has spent the past 48 hours between roughly 1.1514 and 1.1562, with the latest price towards the lower third of that range.

EUR/USD has struggled to sustain moves above 1.1550, with price action remaining contained inside a relatively narrow 48-hour range.
The US Dollar side of the equation remains complicated.
Rabobank argues that the traditional inverse relationship between oil and the US currency has weakened as the US has become a major energy exporter.
That shift helped the Dollar recover some of its safe-haven appeal when the Iran war began.
More recently, however, interest-rate expectations have taken over as the more important driver.
Rabobank said the earlier oil-Dollar relationship “appeared to break down in June”, adding that this was “likely linked to a run up in market speculation regarding the prospects of Fed rate hikes”.
Those expectations have since softened.
July US CPI matched forecasts, but the market still pared back some expectations for another Federal Reserve rate increase.
The softer payrolls report released beforehand also shaped the reaction, with weaker employment reducing concern over second-round inflation pressures.
“If Fed rate hike speculation continues to be pared back, in line with RaboResearch’s view, the USD will be exposed to potential downside pressures,” the bank said.
That is not quite the same as an outright bearish Dollar call.
Rabobank still sees uncertainty surrounding the Strait of Hormuz as an important source of USD support.
It argues that as long as shipping remains curtailed, the Dollar should retain a safe-haven premium, while the Eurozone remains more vulnerable to the growth and inflation consequences of expensive energy.
“For as long as shipping through the Strait of Hormuz is curtailed, the USD is likely to retain a safe haven premium, supported by the US’s energy exporter status,” Rabobank said.

The bank therefore expects two competing forces to keep EUR/USD unsettled rather than drive a sustained directional move.
Lower Fed hike expectations favour a softer Dollar. Energy and geopolitical risks work the other way, particularly because they make investors less willing to rebuild large Euro positions.
Rabobank concludes that “choppy range trading” should dominate through the rest of 2026, with only a modest medium-term upward bias.
Its one-month EUR/USD forecast has been lifted to 1.15 from 1.14, while the bank expects the 1.15-1.16 area to dominate on a three-to-six-month view.

The broader bank consensus becomes progressively more Euro-positive through 2027, although the forecast range widens substantially further out.
That makes Rabobank noticeably restrained relative to the longer-run consensus.
The bank is not ruling out further Euro gains, but neither falling Fed expectations nor current Dollar weakness are enough to persuade it that EUR/USD is ready for a sustained break higher.
For the time being, 1.15-1.16 is less a target than the battleground.
Silver Price Forecast: XAG/USD Resumes Uptrend, Bulls Target $67.17
Silver prices resumed their upward trajectory on [current date], with the XAG/USD pair gaining momentum as bulls set their sights on the $67.17 level. This technical milestone reflects renewed buying interest in the precious metal, driven by a combination of market factors and chart-based support levels.
The latest move higher in silver comes after a brief consolidation phase, suggesting that buyers are regaining control. While specific catalysts were not detailed in the source material, technical analysts often point to key support levels and breakout patterns as triggers for such momentum shifts. The $67.17 target appears to be a significant resistance level that, if breached, could open the door to further gains.
Market participants are closely watching the U.S. dollar’s performance, interest rate expectations, and industrial demand, all of which typically influence silver prices. A softer dollar and lower real yields tend to boost precious metals, including silver.
From a technical perspective, the resumption of the uptrend suggests that the recent pullback has been absorbed by buyers. The $67.17 level is likely a prior high or a Fibonacci extension that traders are using as a near-term objective. Should silver fail to reach this target, support levels from the recent consolidation could come into play.
It is important to note that technical forecasts are not guarantees. The market remains sensitive to macroeconomic data releases and geopolitical events that could shift sentiment quickly.
For traders and investors, the silver market offers both opportunities and risks. A clear break above $67.17 could signal a continuation of the broader uptrend, potentially attracting momentum buyers. Conversely, a rejection at this level might lead to profit-taking and a retest of lower supports.
Silver’s dual role as an industrial metal and a store of value adds complexity to its price dynamics. Investors should consider both technical signals and fundamental drivers when making decisions.
Silver’s uptrend is back on track, with bulls targeting $67.17. While the technical picture appears constructive, market conditions remain fluid. Traders should monitor key levels and stay informed about broader economic indicators that could influence the next move.
Q1: What does the $67.17 target mean for silver?
The $67.17 level is a technical price target that bulls are aiming for. It likely represents a significant resistance area, and a break above it could signal further upside potential.
Q2: Is the silver uptrend likely to continue?
Based on the recent price action, the uptrend has resumed, but no forecast is certain. Traders should watch for sustained buying momentum and key technical levels to gauge the trend’s strength.
Q3: What factors typically drive silver prices?
Silver prices are influenced by the U.S. dollar, interest rates, industrial demand, geopolitical events, and investor sentiment toward precious metals. A weaker dollar and lower rates often support silver.
This post Silver Price Forecast: XAG/USD Resumes Uptrend, Bulls Target $67.17 first appeared on BitcoinWorld.
Despite the weakness of EURJPY pair’s last trading, its stability above 183.15 level confirms the continuation of the previously suggested bullish scenario, to settle near 183.75 level, attempting to gather extra bullish momentum by stochastic stability within the overbought level.
We expect to reach the moving average of 55 level at 184.30, to confirm the importance of surpassing it to open the way for resuming the bullish trend, to begin recording extra gains by its rally towards 184.85, reaching the next target near 185.45.
The expected trading range for today is between 183.00 and 184.80
Trend forecast: Bullish
Barclays is maintaining its 2026 average Brent crude oil price forecast at $100 a barrel though risks are skewing higher, the bank said in a note on Friday.In trading on Friday, Brent futures were at about $105 a barrel as investors doubted the prospects of a breakthrough in U.S.-Iran peace talks, while the key Strait of Hormuz stayed closed.
Around 20% of global energy supplies transited the strait before the war, and the conflict has removed 14 million barrels per day of oil – or 14% of global supply – from the market from suppliers such as Saudi Arabia, Iraq, the UAE and Kuwait.
“Inventory trends are signaling a 6-8 (million bpd) deficit with the U.S. inventories within reach of the lowest levels since 2020,” the bank said.
Barclays said that even if the Strait of Hormuz were to fully reopen today, the starting point for inventories even in the most optimistic scenario will be roughly 20 million barrel below the tightest level in recent history.
Meanwhile, demand remains largely resilient and any weakness in the end uses linked to industrial activity will likely recover strongly if supply normalizes quickly, the bank added.
(Reporting by Noel John in Bengaluru; Editing by Christian Schmollinger)
For all the talk about today’s US inflation report, it is debatable whether anyone truly has a consistent edge in predicting how the data will print, let alone how markets will respond over a longer time frame. Looking at price action across major currency pairs heading into the release and identifying the technical levels that matter provides a framework as good as any for anticipating or reacting once it comes out.
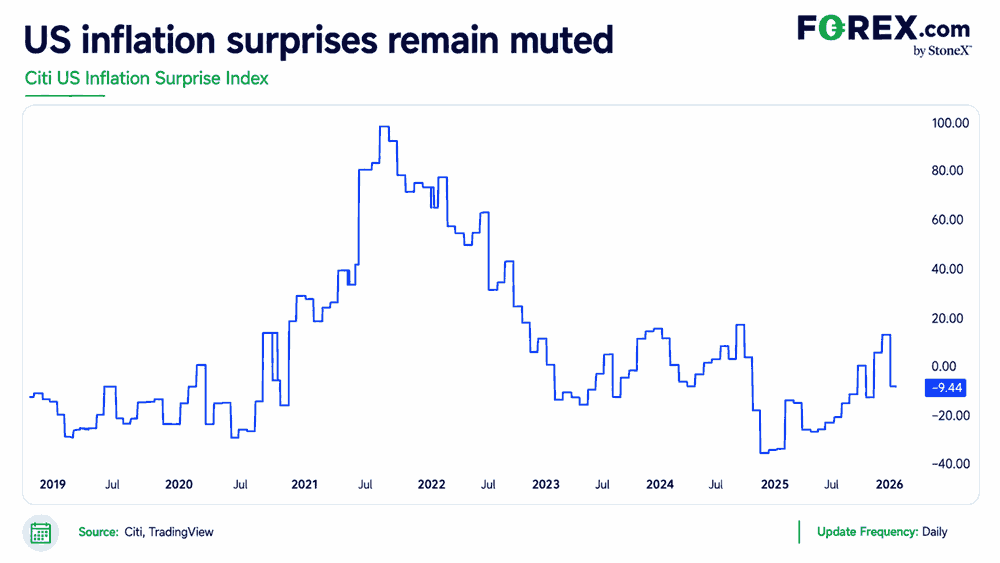
Relative to the supply shock-driven inflation surge coming out of the pandemic and Ukraine war, the inflationary impact from the latest bout of energy price strength has so far been far less significant. Despite disruptions to energy supplies coming out of the Gulf, Citi’s US Inflation Surprise Index shows that, over recent years, inflation prints have by and large either met or undershot expectations.
The index measures whether inflation data is coming in above, in line with, or below market expectations, with readings above zero signalling upside surprises and readings below zero indicating downside surprises.
Source: LSEG, FOREX.com
Of course, that trend does not eliminate the risk of an upside surprise today. But it does suggest the recent skew has been towards inflation meeting or undershooting expectations rather than exceeding them.
Based on forecasts compiled by the Wall Street Journal, monthly estimates for headline CPI range from 0% to 0.16%, centred around a median of 0.12%. For core, the range is 0.16% to 0.26%, with the median at 0.22%. That leaves the hurdle for an upside surprise relatively low.
Importantly, it will not just be the headline figures that matter. Traders will be looking for evidence that inflationary pressures are becoming more entrenched in core services excluding housing, which would provide a read on domestically generated price pressures and labour market conditions. Core goods prices will also be important in assessing whether tariff pass-through is largely complete.
Those components will help shape expectations for the PCE inflation report later this month, with PPI due Thursday providing another piece of the puzzle.
Source: TradingView
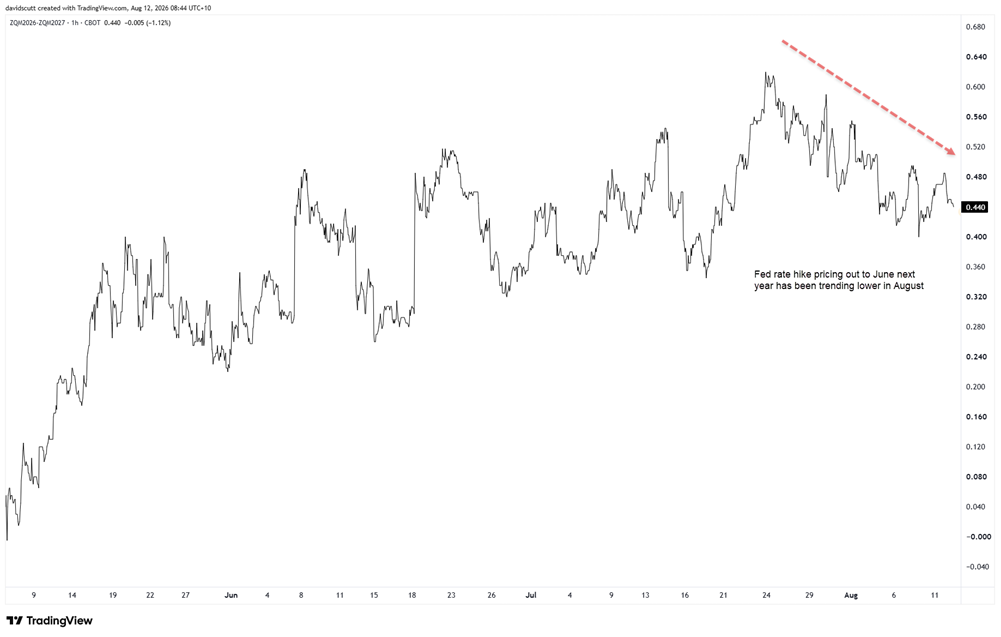
Despite the re-emergence of energy-led inflationary pressures, market pricing for Fed rate hikes out to the June meeting next year has been edging lower in August. According to Fed funds futures, around 44 basis points of tightening is priced over this period, with the September meeting effectively deemed a coin flip.
Back in late July, around 62 basis points of hikes were priced over the same period. But a run of relatively tepid US economic data, following a series of strong beats earlier this year, including an underwhelming payrolls report last Friday, has curtailed hawkish pricing.
Source: TradingView
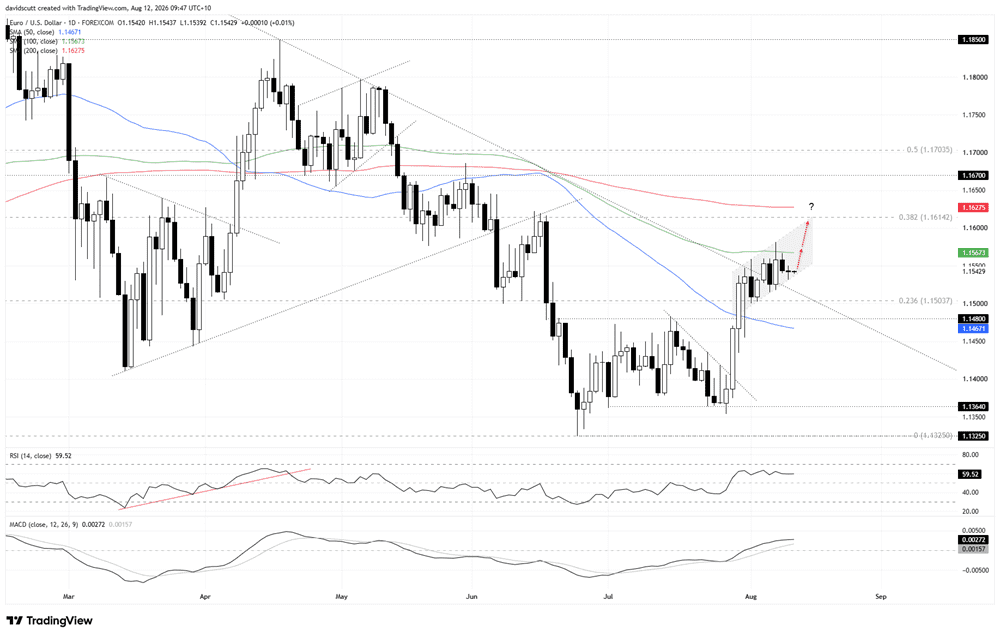
Looking at EUR/USD, we have seen a series of bullish breakouts over recent weeks. The first came from a minor downtrend in the wake of the Fed meeting two weeks ago. Then came the joint intervention by the US Treasury and Japan’s Ministry of Finance, which saw the pair bounce strongly from beneath former resistance around 1.1480, where the 50-day simple moving average was also located.
Since then, the price has settled into a grind within an ascending channel, breaking above downtrend resistance in place from the highs set earlier this year. That slowdown in the bullish move has coincided with renewed energy price strength, with the Gulf effectively shut as geopolitical tensions between Iran and the United States escalate again. Even so, it has not been enough to derail the euro yet.
The pair continues to attract bids within the ascending channel that formed from the 23.6% Fibonacci retracement of the January to June bear move, leaving the near-term options clear cut.
While the structure holds, longs can be considered on dips towards the lower end of the channel, targeting a retest of the 100-day simple moving average, which capped the pair late last week, followed by the upper end of the structure. Beyond that, the 38.2% Fibonacci retracement at 1.1614 comes into view, with the 200-day simple moving average at 1.1627 not far above and now flatlining.
On the downside, a break of the lower end of the ascending channel would bring the 23.6% Fib back into focus. Beneath that, 1.1480 is the next level of note, having previously acted as resistance, followed by the 50-day simple moving average.
Longs are marginally favoured over shorts, with the oscillators still siding with bulls even though upside momentum is no longer strengthening. RSI 14 remains above the neutral 50 level at around 60, while MACD has staged a bullish crossover and moved into positive territory, although it too is flattening out.
While upside momentum is no longer building, the broader technical picture suggests retaining a modest bullish bias may be more advantageous than turning bearish.
Source: TradingView
As correctly flagged in my weekend USD/JPY note, upside risk in the pair has played out so far this week. Importantly, that has occurred despite both the soft US payrolls report and a further pullback in Fed hike pricing, reinforcing the point that yen weakness is broader and more structural than simply a US rates story.
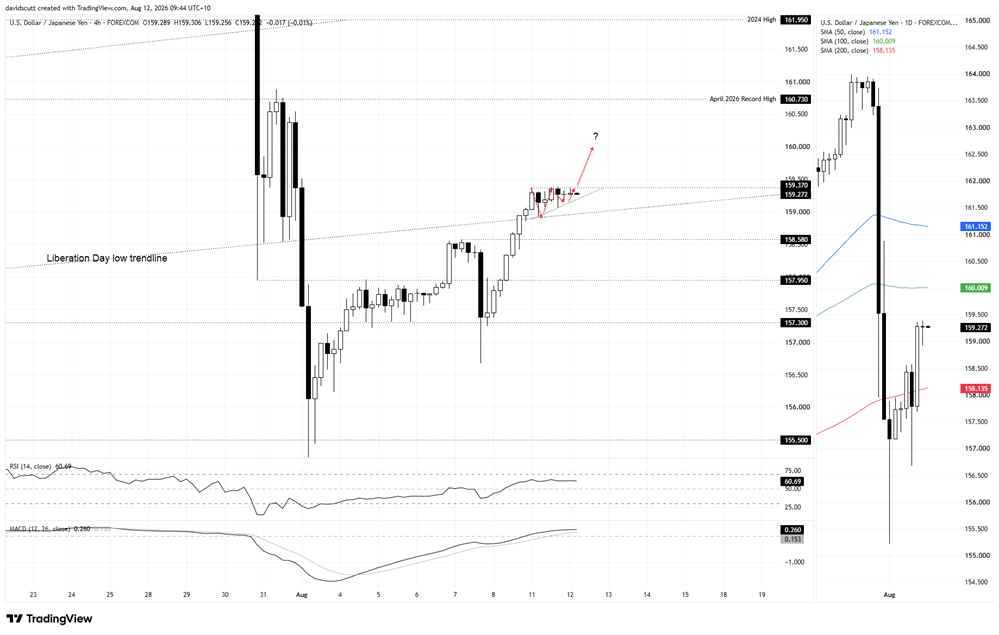
Following the push above last week’s high, USD/JPY finds itself coiling in what resembles an ascending triangle on the four-hourly chart on the left. Gains have been capped around 159.37, while dips continue to be bought at progressively higher levels. The structure has not been in place for an extended period, but it still warns of the potential for an eventual topside break and continuation of the rebound seen so far in August.
On the upside, the first levels of note are the 100-day simple moving average on the daily chart on the right, followed by 160.73, the former record high hit in late April. That level has flipped between support and resistance on subsequent tests, leaving it as an obvious reference point if the rebound extends.
On the downside, the gradually rising trendline visible on the four-hourly chart runs from the Liberation Day lows in April last year. Even though it was broken convincingly during the latest intervention episode, the price respected it earlier this week, suggesting it remains relevant. It kicks in today around 159.00.
Beneath that, 158.58, last week’s high, is the next level of note, followed by 157.95, which has acted as both support and resistance since the intervention episode.
The oscillators are mildly bullish, even though upside momentum is no longer building. RSI 14 is flatlining above the neutral 50 level at around 61, while MACD staged a bullish crossover earlier this month and has since moved into positive territory, although it is now converging back towards the signal line. Overall, the setup still favours retaining a bullish bias on the four-hourly timeframe.
Risk Warning: This article is provided for informational purposes only and does not constitute investment advice, investment research, or a recommendation to trade. The views expressed are those of the author and do not necessarily reflect the position of Markets.com. When considering shares, indices, forex (foreign exchange), and commodities for trading and price predictions, remember that trading CFDs involves a significant degree of risk and may not be suitable for all investors. Leveraged products can result in capital loss. Past performance is not indicative of future results. Before trading, ensure you fully understand the risks involved and consider your investment objectives and level of experience. Cryptocurrency CFD trading restrictions may apply depending on jurisdiction.
– Written by
John Cameron
STORY LINK GBP/USD Outlook: Soft US Producer Prices Keep Dollar Under Pressure
The Pound US Dollar (GBP/USD) exchange rate struggled to establish a clear direction on Thursday, with UK GDP, US PPI and broader risk sentiment failing to drive a decisive move.
At the time of writing, GBP/USD was trading at $1.3508, marginally higher than at the start of the session.
The Pound (GBP) lacked momentum on Thursday, as the latest UK GDP figures failed to provide Sterling with much support.
The UK economy grew by 0.4% during the second quarter, marking a slowdown from the 0.6% expansion seen in Q1. Despite the weaker pace, growth remained reasonably solid.
Sterling found little reason to rally, however, with the figures coming in exactly as expected. Moreover, some of the growth was attributed to temporary and seasonal influences, including the World Cup in June and unusually warm summer weather, both of which gave economic activity a boost.
Looking ahead, some economists warned that UK growth could lose further momentum in the second half of the year. Persistent inflation and the ongoing conflict in the Middle East could add to the pressure facing the economy, limiting the Pound’s ability to make further gains.
The US Dollar (USD) initially found support on Thursday as concerns surrounding the US-Iran war boosted demand for the safe-haven currency.
Get better rates and lower fees on your next international money transfer.
Compare TorFX with top UK banks in seconds and see how much you could save.
However, the ‘Greenback’ later came under pressure following the latest US producer price index figures. Factory gate inflation was unchanged in July, falling short of expectations for a 0.2% increase.
The figures offered further signs that US inflationary pressures may be less persistent than previously feared, reducing expectations that the Federal Reserve will raise interest rates.
Looking ahead, Friday will bring two important US data releases that could put pressure on the ‘Greenback’.
First up are the latest US retail sales figures. Economists expect growth in sales to have slowed from 0.2% in June to just 0.1% in July. A weaker reading could fuel concerns over the strength of US consumer spending and the wider American economy.
The University of Michigan will also release its preliminary consumer sentiment index for August. A deterioration in consumer morale is expected, which could add to the pressure on the US Dollar.
However, risk appetite may also shape GBP/USD movements, potentially offering the ‘Greenback’ some support. Continued concern over tensions in the Middle East could encourage demand for the safe-haven Dollar if markets remain unsettled.

International Money Transfer? Ask our resident FX expert a money transfer question or try John’s new, free, no-obligation personal service! ,where he helps every step of the way,
ensuring you get the best exchange rates on your currency requirements.
TAGS: Pound Dollar Forecasts
The EURUSD pair rose during its recent intraday trading, with the emergence of positive signals from the relative strength indicators, after reaching oversold levels, attempting to offload some of these oversold conditions.
Reaching EMA50’s resistance, which threatens these gains to rebound and resume the downside moves in the near upcoming period, unless it recovers its key and near resistance.