The main category of Forex News.
You can use the search box below to find what you need.
[wd_asp id=1]
The main category of Forex News.
You can use the search box below to find what you need.
[wd_asp id=1]
Meanwhile, recent economic data showed that the eurozone inflation rate fell to 2.2% in March, its lowest level since November 2024. Core inflation fell more than expected to 2.4%, its lowest level since January 2022. With easing inflationary pressures and escalating global trade tensions, market expectations have strengthened that the European Central Bank could cut interest rates by 65 basis points this year.
According to economic calendar data, Eurostat reported a slight decrease in the Eurozone’s annual inflation rate to 2.2% in March, from 2.3% in February, meeting expectations and approaching the ECB’s target of 2%. Economists say, “Eurozone inflation is easing as expected and is likely to fall below the ECB’s 2% target in the coming months.”
Encouragingly for the central bank, the eurozone’s core inflation gauge fell to 2.4% in March, from 2.6% in February, below the consensus forecast of 2.5%. Services inflation also fell to 3.4% from 3.7%, according to the announcement.
The European Central Bank is scheduled to announce its next interest rate decision on April 17, and market expectations now indicate a 72% chance of a rate cut. By then, the extent of the upcoming US tariffs will become clearer, as will any adjustments the White House may make. By the April meeting, the ECB will also learn the nature and scope of the eurozone’s countervailing tariffs, which will impact European import prices.

We still recommend selling the euro against the US dollar from every rising level, but without risk and monitoring the factors affecting prices.
According to yesterday’s trading session and across stock trading platforms, European markets closed lower as investors braced for new US trade tariffs. According to trading, the Stoxx 50 index fell 0.4%, and the Stoxx 600 index lost 0.6%, reversing Tuesday’s rebound.
According to performance, most sectors declined, with healthcare stocks being the hardest hit – falling about 2% – amid fading hopes for tariff exemptions. Bayer shares fell about 4%, leading the declines. Overall, concerns increased after Trump reiterated that his “reciprocal tariffs” would apply to “all countries.” Reports indicate that 20% tariffs will be imposed on most imports, but final details remain uncertain.
Meanwhile, the White House confirmed that the measures will take effect immediately upon their announcement. Further escalating trade tensions, the United States is set to impose a 25% tariff on foreign-made cars. Meanwhile, UniCredit has received approval for its bid to acquire Banco BPM, and Credit Agricole has received approval from the European Central Bank to increase its stake in the Italian bank.
According to the daily chart performance, the EUR/USD pair has an opportunity for a bullish shift, and as I mentioned before, the psychological resistance of 1.1000 will remain the most prominent for this shift, which may technically push the pair towards stronger peaks. I see these peaks as potential selling opportunities for the EUR/USD, but without risk, regardless of the strength of trading opportunities. Markets are now reacting to Trump’s tariffs, and attention will then turn to US jobs data tomorrow.
Conversely, over the same timeframe, the 1.0800 support level will remain a real threat to any upward shift in the EUR/USD pair.
Ready to trade our daily Forex analysis? We’ve made this forex brokers list for you to check out.
The Silver price (XAG/USD) falls to near $33.15 during the early European session on Thursday, pressured by some profit-taking. Nonetheless, the downside for the white metal might be limited as US President Donald Trump announced sweeping new global tariffs on Wednesday, raising the fears of a widening trade war.
According to the daily chart, the bullish trend of Silver remains in place as the commodity is well-supported above the key 100-day Exponential Moving Average (EMA). However, the 14-day Relative Strength Index (RSI) hovers around the midline, displaying neutral momentum in the near term. This suggests that further consolidation cannot be ruled out.
The immediate resistance level for white metal emerges at $34.23, the high of March 18. Further north, the next hurdle to watch is the $34.60-$34.70 zone, representing the high of March 28 and the upper boundary of the Bollinger Band. A decisive break above the mentioned level could pave the way to the $35.00 psychological level.
On the flip side, the first downside target for the silver price is seen at $32.66, the low of March 21. Sustained trading below the mentioned level could see a drop to the next contention level at $31.89, the 100-day EMA. Any follow-through selling could expose $30.82, the low of February 28.
Silver is a precious metal highly traded among investors. It has been historically used as a store of value and a medium of exchange. Although less popular than Gold, traders may turn to Silver to diversify their investment portfolio, for its intrinsic value or as a potential hedge during high-inflation periods. Investors can buy physical Silver, in coins or in bars, or trade it through vehicles such as Exchange Traded Funds, which track its price on international markets.
Silver prices can move due to a wide range of factors. Geopolitical instability or fears of a deep recession can make Silver price escalate due to its safe-haven status, although to a lesser extent than Gold’s. As a yieldless asset, Silver tends to rise with lower interest rates. Its moves also depend on how the US Dollar (USD) behaves as the asset is priced in dollars (XAG/USD). A strong Dollar tends to keep the price of Silver at bay, whereas a weaker Dollar is likely to propel prices up. Other factors such as investment demand, mining supply – Silver is much more abundant than Gold – and recycling rates can also affect prices.
Silver is widely used in industry, particularly in sectors such as electronics or solar energy, as it has one of the highest electric conductivity of all metals – more than Copper and Gold. A surge in demand can increase prices, while a decline tends to lower them. Dynamics in the US, Chinese and Indian economies can also contribute to price swings: for the US and particularly China, their big industrial sectors use Silver in various processes; in India, consumers’ demand for the precious metal for jewellery also plays a key role in setting prices.
Silver prices tend to follow Gold’s moves. When Gold prices rise, Silver typically follows suit, as their status as safe-haven assets is similar. The Gold/Silver ratio, which shows the number of ounces of Silver needed to equal the value of one ounce of Gold, may help to determine the relative valuation between both metals. Some investors may consider a high ratio as an indicator that Silver is undervalued, or Gold is overvalued. On the contrary, a low ratio might suggest that Gold is undervalued relative to Silver.
This announcement triggered a flight to safe havens and a shift towards low-risk assets, as investors grew increasingly concerned about the potential impact on the global economy. For her part, British Foreign Secretary Reynolds stated that the US is Britain’s “closest ally” and that the government’s approach is to “remain calm and committed to securing this deal, which we hope will mitigate the effects of what was announced today.”
UK inflation was a factor in the pound’s decline ahead of the US tariffs. According to forex trading, the pound fell below $1.29, its lowest level in nearly two weeks, as traders reacted to the weaker-than-expected February inflation reading and the Spring Statement. Chancellor Reeves said that UK inflation is expected to average 3.2% in 2025, up from the 2.6% forecast in October. At the same time, growth forecasts for 2025 were lowered to 1% from 2%, and public sector net borrowing is expected to fall from £137.3 billion (4.8% of GDP) this year to £74.0 billion (2.1% of GDP) by 2029-30. However, compared to the October estimate, borrowing for 2025-26 is expected to be £12.1 billion higher (0.4% of GDP).
The UK government has already announced several policy changes to restore the government’s budget, including social welfare reforms, cuts in administrative spending, and a small set of tax changes. The UK’s annual inflation rate fell to 2.8% in February, slightly lower than the expected 2.9% but in line with the Bank of England’s forecast.
The pound will remain supported for some time, but beware of profit-taking.
The British pound is experiencing sharp fluctuations following US President Donald Trump’s announcement of a 10% tariff on British imports. The 10% tariff imposed on Britain is much more lenient than those imposed on other countries, pushing the pound higher.
20% on the European Union
34% on China
46% on Vietnam
24% on Japan
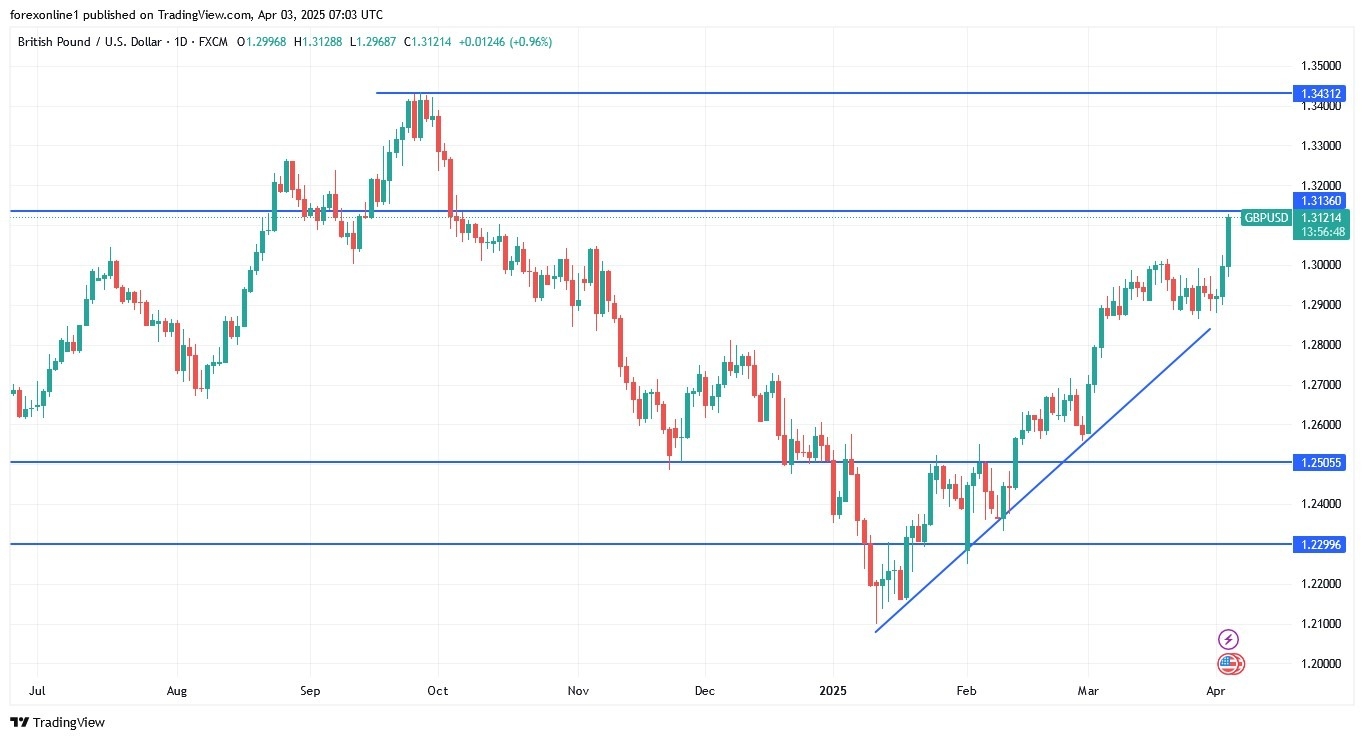
According to licensed trading company platforms, the British pound is rising against most major currencies, confirming its role as a safe haven in tariff trading. The GBP/USD exchange rate is higher at 1.3120, confirming that the dollar is a complete loser. This is understandable; ultimately, US consumers and businesses bear the costs of high imports. Also, the GBP/EUR exchange rate rose to 1.1989, a rise indicating that the EU’s 20% tariffs were lower than expected. In other markets, China-related currencies, such as the Australian dollar and the New Zealand dollar, are experiencing selloffs.
Trump asked a crowd gathered in the White House Rose Garden: “They’re charging us tariffs, and we’re charging them tariffs. How can anyone be upset?” Among other things, he specifically mentioned China and the European Union. “They’re deceiving us. It’s very sad to see this. It’s pathetic.”
He said, “India is very difficult. Very difficult.”
Regarding exchange rate reactions, we reported that the British pound entered the tariff announcements as a hedge due to its relatively low exposure. This is due to Britain’s declining manufacturing base, which keeps it balanced in goods trade with the United States.
Based on the performance on the daily chart, the GBP/USD pair is witnessing a strong upward movement towards levels that confirm this shift. Technically, from the resistance levels of 1.3120 and 1.3230, technical indicators will move towards strong overbought levels. Conversely, the currency pair will not abandon its upward recovery path without moving towards the support level of 1.2880 again. Finally, the GBP/USD may remain on its upward path until the reaction to the US jobs numbers tomorrow.
Ready to trade our daily Forex GBP/USD analysis? We’ve made this UK forex brokers list for you to check out.
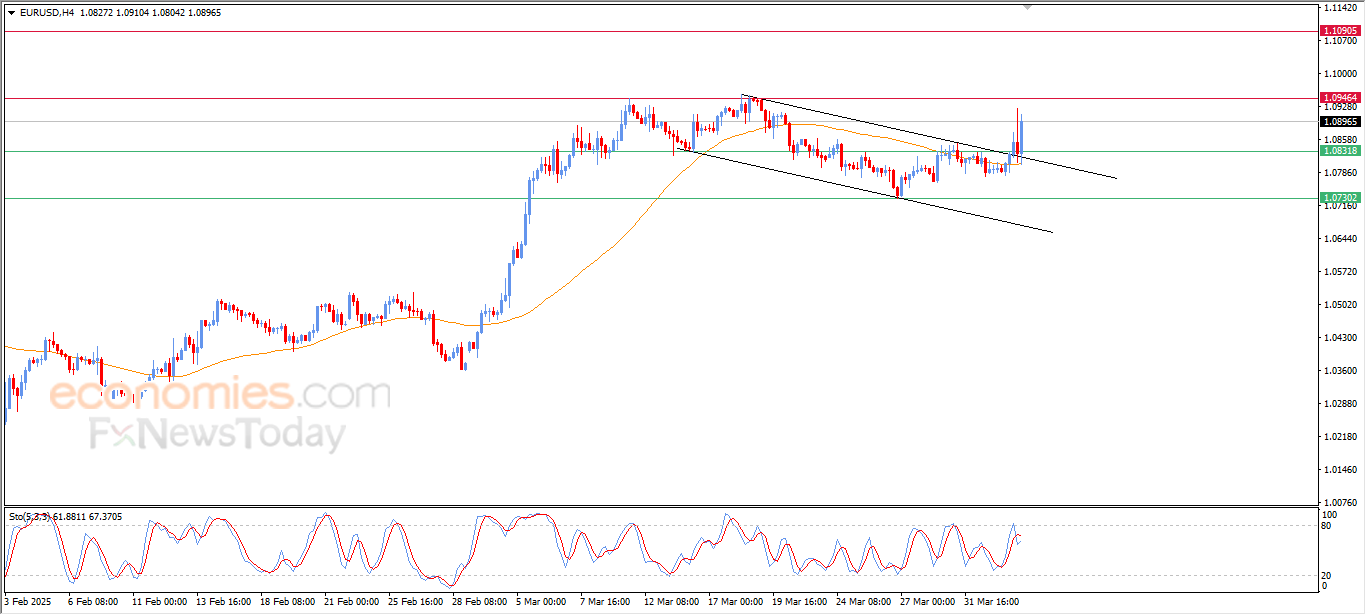
EUR/USD surged in latest intraday trading and managed to pierce the pivotal resistance of $1.0945, amid the dominance of the main upward trend, after the price exited a downward correctional price channel previously, embarking on a new upward wave.
To get our more detailed analysis and 100% accurate signals provided by Best Trading Signal, subscribe to Economies.com VIP Club through the link below!
The USD/JPY outlook is predominantly bearish as the yen capitalizes on safe-haven appeal due to President Trump’s sweeping trade tariffs. The pair plummeted 1.2%, marking fresh 3-week lows near 147.20 during the early Asian session. With mounting fears of a US recession, investors are fleeing to the JPY, reinforcing its strength against the US dollar.
-Are you looking for the best AI Trading Brokers? Check our detailed guide-
Riskier assets saw a broader sell-off after the latest round of Trump’s tariffs. The stocks slipped, and bond yields dipped, creating a demand for conventional safe-haven assets. The US 10Y hit a YTD low at 4.0%, reinforcing the potential for a Fed rate cut.
The ongoing divergence between the Federal Reserve and the Bank of Japan further fueled the JPY rally. While the Fed is widely expected to cut rates, BoJ remains uncertain. Previously, market participants were expecting an aggressive stance from BoJ. However, Japan’s export-driven economy may suffer as a result of recent tariffs. Still, the recent Tokyo consumer inflation figures suggest that the BoJ may retain its hawkish stance.
Despite Trump’s tariffs favoring the US dollar in the long run, the likelihood of a rate cut and the risk of a recession has undermined the Greenback. According to Wells Fargo analysts, monetary easing is expected to be more pronounced in 2025-26, which could keep the dollar defensive.
Looking ahead, traders will primarily focus on the following:
Still, the broader focus remains on trade development and China’s potential reaction.
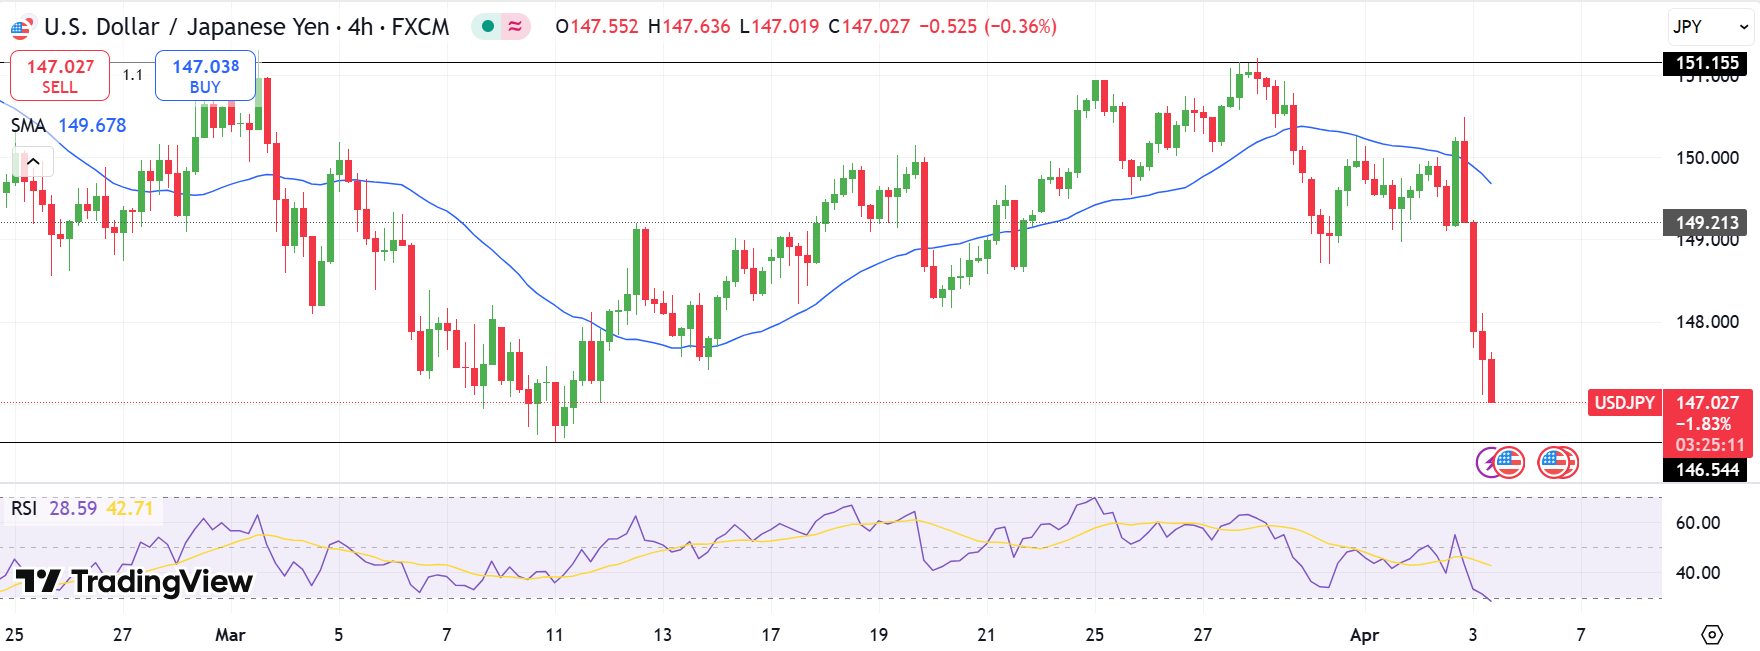
The USD/JPY 4-hour chart shows a gloomy picture. The price is slipping towards the key support level at 146.55. The pair lies well below the 30-period SMA, posing a risk of a deeper downside. However, the RSI value reaches 30.0, which indicates an oversold zone. Hence, corrective upside can be expected.
-Are you looking for the best MT5 Brokers? Check our detailed guide-
On the upside, the 30-period SMA is one tough nut to crack for the buyers. Meanwhile, a strong resistance level emerges at 151.15. The path of least resistance lies on the downside.
Looking to trade forex now? Invest at eToro!
75% of retail investor accounts lose money when trading CFDs with this provider. You should consider whether you can afford to take the high risk of losing your money.
Silver (XAG/USD) is trading at $33.28, having touched a session low of $33.07. Despite gold’s upward momentum, silver’s response has been more restrained, weighed down by its industrial use case.
With growth forecasts under pressure, traders remain cautious on silver exposure. The metal continues to trade below the key pivot of $33.49, limiting upside prospects in the near term.
Markets are now pricing in a 70% chance of a Federal Reserve rate cut in June, according to CME FedWatch. The 10-year Treasury yield dropped to 4.15%, driven by fears that tariff-driven weakness could prompt the Fed to act.
A weaker U.S. dollar—pressured by falling yields—has further supported gold, making it more attractive to non-dollar holders.
The ADP employment report surprised to the upside with 155,000 jobs added, exceeding the 105,000 forecast. However, markets shrugged it off, focusing instead on upcoming data. Weekly jobless claims, ISM Services PMI, and especially Friday’s Nonfarm Payrolls report are now in focus as traders weigh how deeply tariffs could impact the broader economy.
Gold remains bullish above $3,116 amid rising Fed cut bets and trade risks. Silver faces pressure below $33.49, with momentum tilted bearish unless key resistance levels are reclaimed.
EUR/USD gathers bullish momentum in the European session on Thursday and trades at its highest level since early October above 1.1000. Although the pair’s near-term technical outlook points to overbought conditions, buyers could retain control amid the broad-based US Dollar (USD) weakness.
The table below shows the percentage change of Euro (EUR) against listed major currencies today. Euro was the strongest against the US Dollar.
| USD | EUR | GBP | JPY | CAD | AUD | NZD | CHF | |
|---|---|---|---|---|---|---|---|---|
| USD | -1.39% | -0.89% | -1.64% | -0.70% | -0.56% | -0.80% | -1.72% | |
| EUR | 1.39% | 0.26% | -0.27% | 0.73% | 0.87% | 0.61% | -0.31% | |
| GBP | 0.89% | -0.26% | -0.50% | 0.47% | 0.63% | 0.36% | -0.60% | |
| JPY | 1.64% | 0.27% | 0.50% | 0.96% | 1.14% | 0.74% | -0.07% | |
| CAD | 0.70% | -0.73% | -0.47% | -0.96% | 0.24% | -0.11% | -1.05% | |
| AUD | 0.56% | -0.87% | -0.63% | -1.14% | -0.24% | -0.26% | -1.19% | |
| NZD | 0.80% | -0.61% | -0.36% | -0.74% | 0.11% | 0.26% | -0.95% | |
| CHF | 1.72% | 0.31% | 0.60% | 0.07% | 1.05% | 1.19% | 0.95% |
The heat map shows percentage changes of major currencies against each other. The base currency is picked from the left column, while the quote currency is picked from the top row. For example, if you pick the Euro from the left column and move along the horizontal line to the US Dollar, the percentage change displayed in the box will represent EUR (base)/USD (quote).
US President Donald Trump announced on “Liberation Day” that they will impose a 10% baseline tariff, effective April 5, on all imports to the US. The Trump administration will also impose higher reciprocal tariffs, which will go into effect on April 9, on about 60 countries they describe as “worst offenders.” The European Union will be within that list, facing 20%, tariffs.
In response, European Commission President Ursula von der Leyen said early Thursday that the US’ tariffs will be a major blow to the world economy. “We are preparing a further package of measures to protect our interests,” she added.
Investors grow increasingly concerned over the potential negative impact of the US’ new trade regime on the economic outlook. In turn, the USD suffers large losses against its major rivals. At the time of press, the USD Index was down about 1.4% on the day at 102.25.
In the second half of the day, the US economic calendar will feature weekly Initial Jobless Claims and March ISM Services Purchasing Managers Index (PMI) data. Investors are likely to ignore these releases and remain focused on trade war-related headlines.
The Relative Strength Index (RSI) indicator on the 4-hour chart rises toward 80, reflecting overbought conditions for EUR/USD. On the upside, 1.1040 (static level) aligns as next resistance level before 1.1100 (static level, round level).
In case EUR/USD drops below 1.1000 (static level, former resistance) and starts using this level as resistance, it could extend its correction toward 1.0950 (static level) and 1.0900 (static level, round level).
Tariffs are customs duties levied on certain merchandise imports or a category of products. Tariffs are designed to help local producers and manufacturers be more competitive in the market by providing a price advantage over similar goods that can be imported. Tariffs are widely used as tools of protectionism, along with trade barriers and import quotas.
Although tariffs and taxes both generate government revenue to fund public goods and services, they have several distinctions. Tariffs are prepaid at the port of entry, while taxes are paid at the time of purchase. Taxes are imposed on individual taxpayers and businesses, while tariffs are paid by importers.
There are two schools of thought among economists regarding the usage of tariffs. While some argue that tariffs are necessary to protect domestic industries and address trade imbalances, others see them as a harmful tool that could potentially drive prices higher over the long term and lead to a damaging trade war by encouraging tit-for-tat tariffs.
During the run-up to the presidential election in November 2024, Donald Trump made it clear that he intends to use tariffs to support the US economy and American producers. In 2024, Mexico, China and Canada accounted for 42% of total US imports. In this period, Mexico stood out as the top exporter with $466.6 billion, according to the US Census Bureau. Hence, Trump wants to focus on these three nations when imposing tariffs. He also plans to use the revenue generated through tariffs to lower personal income taxes.
Support for the past two days at $3.93 is near the prior interim swing low from mid-March. Moreover, a 61.8% Fibonacci retracement also was completed. However, given today’s lower daily high and the fact that the 20-Day MA has turned down, the next lower potential support level around the 50-Day MA, looks likely to be tested. It is now at $3.88. The 50-Day line is joined by the 78.6% retracement level at $3.84. That price level has added significance as it is this week’s low so far. It begins a pattern of higher weekly lows following the bullish reversal that triggered earlier this week on the weekly chart (not shown).
This means that the weekly chart just began a new potential upswing this week. Therefore, the bias should be towards the upside. However, that doesn’t mean that the current pullback can’t go lower first. But as long as natural gas remains above this week’s low, it retains the weekly bull trend price structure. If there is a sustained reclaim of the 20-Day MA and today’s high prior to a deeper decline, then the near-term outlook would switch to bullish.
The first advance off the recent higher swing low of $3.73 retraced a little less than 50% of the recent downswing. Therefore, the 50% retracement at $4.32 would mark an upside target, along with the interim swing high at $4.37. Further up is the 61.8% Fibonacci retracement level at $4.45. A daily close above today’s high and the 20-Day MA would indicate strength that could then lead to a bullish breakout above the recent swing high at $4.25. It is also possible that natural gas consolidates for a little while and takes a rest by moving relatively sideways.
For a look at all of today’s economic events, check out our economic calendar.
EUR/USD price surged in latest intraday trading, confirming its exit from a descending correctional price channel in the short term, while also shaking off negative pressure from the 50-candle SMA, regaining its footing amid the dominance of the main upward trend, while readying to tackle the pivotal resistance of $1.0945.
To get our more detailed analysis and 100% accurate signals provided by Best Trading Signal, subscribe to Economies.com VIP Club through the link below!
Gold price rose in latest intraday trading, boosted by a technical pattern that’s complementary to the main upward trend, the Flag pattern, while trading alongside the secondary short-term trend line, with positive signals from the Stochastic, coupled with ongoing positive support due to trading above the 50-candle SMA.
To get our more detailed analysis and 100% accurate signals provided by Best Trading Signal, subscribe to Economies.com VIP Club through the link below!