The main category of Forex News.
You can use the search box below to find what you need.
[wd_asp id=1]
The main category of Forex News.
You can use the search box below to find what you need.
[wd_asp id=1]
Dear reader, beware of the “sell the rumours and buy the facts” reaction, which could support the US dollar if the US stock market recovers, as investors believe we are reaching the limits of negative US tariff headlines. However, the tariff headlines have not helped the US dollar. Despite these potential reactions, it’s clear that the US dollar will face difficulties in 2025, as Trump’s tariffs and other policy announcements have proven ineffective for the US economy.
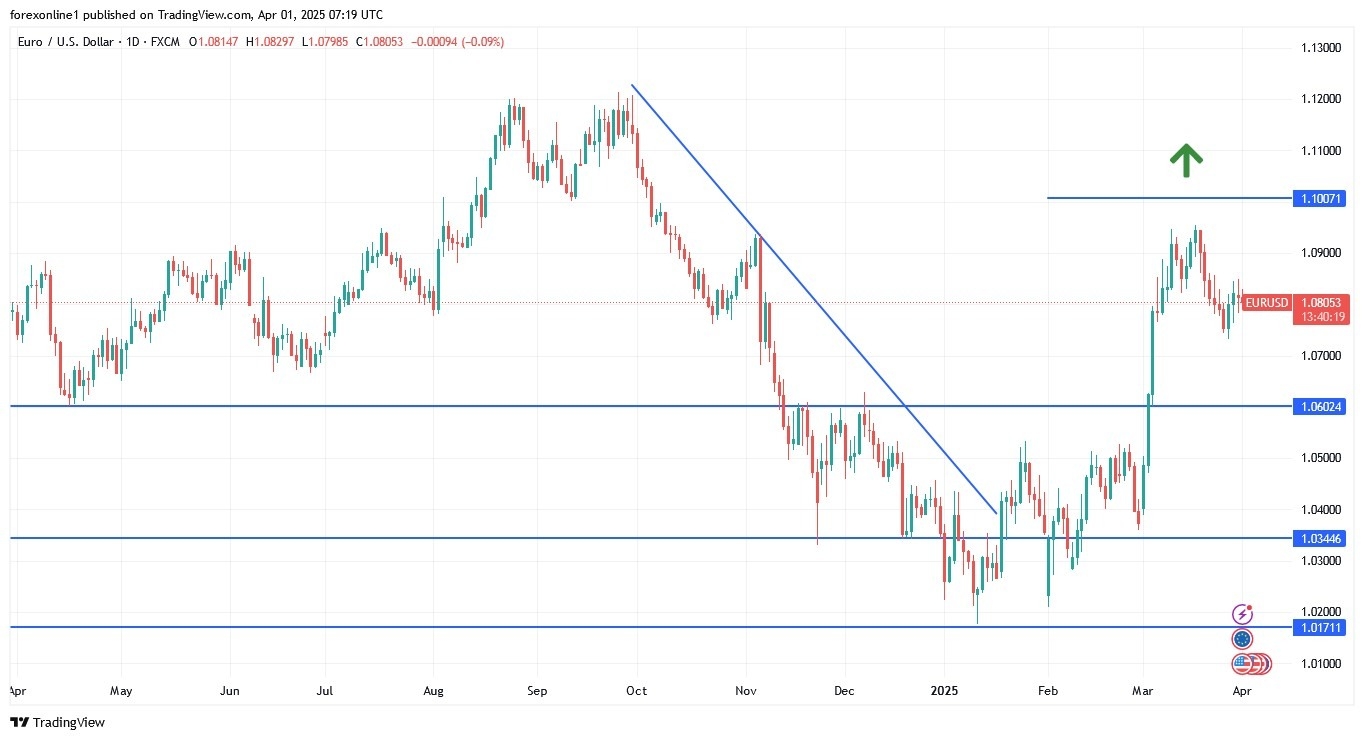
If this trend continues, a tough tariff announcement could test the EUR/USD pair and break the 1.09 level in the coming days. Sometimes, simplification is the best approach in times of uncertainty.

The EUR/USD will remain bearish until the reaction to the US jobs data releases and the reaction to Trump’s tariffs is over.
This important week, important US economic data may overshadow the tariff headlines. It’s an eventful week in the US, as we get clear indications of how resilient the economy is in light of Elon Musk’s DOGE cuts, policy volatility, and tariffs. Surveys are pointing to a sharp deterioration in sentiment, and we’ll be interested to see if this will impact other data.
If the answer is yes, the possibility of the US dollar declining and the EUR/USD pair rising to 1.09 and above becomes a real possibility. In fact, some analysts believe that the data will be more significant for the US dollar than the tariff news.
After retreating from its recent highs, the EUR/USD pair found renewed demand last week, confirming strong buying interest during periods of weakness. Simply put, the EUR/USD exchange rate is in an upward trend, and we expect the recent resilience to continue as a result. For this simple reason, the 1.09 level will be present over the next five days. The EUR/USD pair is trading above its nine-day exponential moving average (EMA) at 1.0815, while momentum has rebounded, according to the Relative Strength Index (RSI), with the index pointing to a new high of 59. It is also above its 21-day EMA (1.0770), where last week’s heavy selling found strong support.
However, the situation could turn upside next Wednesday when Trump announces his “Liberation Day” tariffs, which are expected to see significant increases on EU imports. Commenting on this, some major investment bank analysts believe the decision could hinder global growth, hurt stock markets, and boost the dollar.
Ready to trade our daily Forex analysis? We’ve made a list of the best forex trading platforms for beginners worth trading with.
Platinum price was little changed despite a host of positive factors, especially positive signals from major indicators, with the price engaging in sideways trading near $990.00, while being impacted by the formation of $1000.00 as an important barrier.
The price will likely continue to trade sideways, with a potential of some negative waves towards $976.00 and $964, however, a breach of the aforementioned barrier would open the door for more gains towards $1017.
Expected trading range today is between the $975.00 support and the $1000 resistance.
Today’s price forecast: Sideways within an upward path
April 1, 2025 – Written by Frank Davies
STORY LINK GBP/EUR Forecast Today: Pound Euro Ticks Up as German CPI Declines
The Pound to Euro exchange rate firmed on Monday after Germany released its latest inflation reading.
At the time of writing, the GBP/EUR was trading at around €1.1972, up roughly 0.2% from Monday’s opening levels.
Despite weakening against the Pound (GBP), the Euro (EUR) managed to hold steady and even strengthen against several of its peers on Monday following the release of Germany’s latest CPI data.
The figures showed that the headline inflation rate for March declined in line with market expectations, dropping from 2.3% to 2.2%.
Germany’s harmonised inflation rate, which is the European Central Bank’s (ECB) preferred measure, also fell, coming in at 2.3% – below the market forecast of 2.4% and down from the previous reading of 2.6%.
While the data increased expectations of an ECB interest rate cut, the Euro benefited from the day’s downbeat trading conditions, which bolstered its status as a safe-haven currency and kept it afloat.
At the start of the week, the Pound experienced some volatility, gaining strength against riskier currencies while maintaining a relatively steady position against others, despite a lack of major economic news from the UK.

Sterling’s performance was largely driven by the negative trading environment on Monday.
The Pound’s increasing sensitivity to risk allowed it to advance against its riskier peers, while it remained largely stable against safe-haven currencies.
With limited economic data from the UK, GBP exchange rates were predominantly influenced by broader market sentiment during most of Monday’s European trading session.
Looking ahead to Tuesday, the primary factor influencing the Pound Euro exchange rate will likely be the release of the Eurozone’s inflation data and its latest unemployment figures.
If the Eurozone’s CPI reading cools as expected, it could further pressure the Euro, especially if the data reinforces expectations of an ECB interest rate cut.
Additionally, the Eurozone will release its latest unemployment rate, which could provide some modest support to EUR exchange rates if it remains unchanged as expected.
For the Pound, the only significant data release on Tuesday will be the UK’s final manufacturing PMI data for March.
Should the index confirm a decline in the manufacturing sector for this month, GBP exchange rates could weaken following the release.
International Money Transfer? Ask our resident FX expert a money transfer question or try John’s new, free, no-obligation personal service! ,where he helps every step of the way,
ensuring you get the best exchange rates on your currency requirements.
TAGS: Pound Euro Forecasts
Silver (XAG/USD) oscillates in a narrow trading band following the previous day’s good two-way price moves, though it holds above the $34.00 mark through the Asian session on Tuesday. Moreover, the white metal remains close to a multi-month high, around the $34.60 area touched last Friday.
Looking at the broader picture, the recent strong positive move witnessed since the beginning of 2025 has been along an upward-sloping channel. This points to a well-established short-term uptrend. Furthermore, oscillators on the daily chart are holding comfortably in positive territory and are still away from being in the overbought zone. This, in turn, suggests that the path of least resistance for the XAG/USD is to the upside.
Hence, a move beyond the year-to-date high around the $34.60 area, towards retesting a multi-year peak near the $34.85 region touched in October, looks like a distinct possibility. The latter now coincides with the top boundary of the aforementioned trend channel, which if cleared decisively will be seen as a fresh trigger for bulls and set the stage for a further near-term appreciating move for the XAG/USD.
On the flip side, any corrective pullback might continue to attract some dip-buyers and remain limited near the overnight swing low, around mid-$33.00s. A convincing break below, however, might prompt some technical selling and drag the XAG/USD to the $33.00 round figure, en route to the $32.65 region and the $32.00 mark. The latter represents the lower end of the ascending trend channel and should act as a strong base for the commodity.
Silver is a precious metal highly traded among investors. It has been historically used as a store of value and a medium of exchange. Although less popular than Gold, traders may turn to Silver to diversify their investment portfolio, for its intrinsic value or as a potential hedge during high-inflation periods. Investors can buy physical Silver, in coins or in bars, or trade it through vehicles such as Exchange Traded Funds, which track its price on international markets.
Silver prices can move due to a wide range of factors. Geopolitical instability or fears of a deep recession can make Silver price escalate due to its safe-haven status, although to a lesser extent than Gold’s. As a yieldless asset, Silver tends to rise with lower interest rates. Its moves also depend on how the US Dollar (USD) behaves as the asset is priced in dollars (XAG/USD). A strong Dollar tends to keep the price of Silver at bay, whereas a weaker Dollar is likely to propel prices up. Other factors such as investment demand, mining supply – Silver is much more abundant than Gold – and recycling rates can also affect prices.
Silver is widely used in industry, particularly in sectors such as electronics or solar energy, as it has one of the highest electric conductivity of all metals – more than Copper and Gold. A surge in demand can increase prices, while a decline tends to lower them. Dynamics in the US, Chinese and Indian economies can also contribute to price swings: for the US and particularly China, their big industrial sectors use Silver in various processes; in India, consumers’ demand for the precious metal for jewellery also plays a key role in setting prices.
Silver prices tend to follow Gold’s moves. When Gold prices rise, Silver typically follows suit, as their status as safe-haven assets is similar. The Gold/Silver ratio, which shows the number of ounces of Silver needed to equal the value of one ounce of Gold, may help to determine the relative valuation between both metals. Some investors may consider a high ratio as an indicator that Silver is undervalued, or Gold is overvalued. On the contrary, a low ratio might suggest that Gold is undervalued relative to Silver.
Now we have a lot of questions about tariffs and the recession in the United States if it shows up. And of course, the Bank of England remains very hawkish. So, this does help with the British pound strengthening. The question now is, can we finally break above the 1.30 level on a strong daily close? So far, we have not been able to do so. Therefore, I think we’re somewhat stuck in this range at the moment. Changing this will take a certain amount of momentum to reenter the markets.
If we break down below the 1.2875 level, it’s possible that we could drop from there and go looking at the 1.2750 level where the 50-day EMA currently resides. That being said, I think you still have a market that overall is very bullish, and therefore you’re looking at pullbacks as potential opportunities. While the US dollar is a bit of a mixed bag, the one thing that’s been the case for some time now is that while other currencies were falling against the US dollar, the pound was at least somewhat resilient at times and definitely much stronger than a lot of other currencies. So, if we do see the US dollar get slammed again, it would make sense that the British pound is one of the main victors in that battle.
Ready to trade the Forex GBP/USD analysis and predictions? Here are the best forex trading platforms UK to choose from.
US crude oil price kept rising in latest intraday trading, after considerable gains yesterday that pushed the price to February highs, while buoyed by the dominance of the upward correctional trend in the short term as the price trades alongside the trend line, with positive support due to trading above the 50-candle SMA.
However, we’re noticing a slowdown in the pace of gains in latest intraday trading due to profit-taking, while the price tries to vent off overbought saturation from the Stochastic, as negative signals emerge from it.
To get our more detailed analysis and 100% accurate signals provided by Best Trading Signal, subscribe to Economies.com VIP Club through the link below!
NZD/USD price edged higher in latest intraday trading, boosted by positive signals from the Stochastic after reaching oversold levels, amid negative pressure due to trading below the 50-candle SMA, with the dominance of the downward correctional trend as the price trades within a short-term price channel, while trying to recoup some recent losses.
To get our more detailed analysis and 100% accurate signals provided by Best Trading Signal, subscribe to Economies.com VIP Club through the link below!
Gold price closes in on the $3,150 psychological mark in Asian trading on Tuesday, extending its record rally. Gold buyers eagerly await the US announcement of “reciprocal tariffs” on Wednesday for a fresh directional impetus. In the meantime, tariff updates and top-tier US data will likely keep them entertained.
The traditional safe-haven Gold price sees a fresh leg higher early Tuesday after pulling back slightly from record highs in the late American session on Monday. Tensions over Wednesday’s US tariff announcement and its economic fallout reignited after President Donald Trump rejected plans for narrower tariffs late Monday, noting that his reciprocal tariffs plan will target all other countries.
US Treasury Secretary Scott Bessent singled out what he called the “Dirty 15” — the 15% of countries that trade heavily with the US and have high tariffs. Bessent added that Trump will announce these tariffs on April 2 at 19:00 GMT.
Renewed tensions surrounding the scope of the ‘reciprocal tariffs’ fuelled a fresh bout of US Dollar (USD) selling as the trade barriers are expected to dent the US economic prospects.
A potential US stagflation could prompt the Federal Reserve (Fed) to deliver aggressive interest rate cuts. This narrative weighs heavily on the USD and the US Treasury bond yields, while the Gold price challenges record highs.
The bright metal also capitalises on increased buying from central banks and rising exchange-traded funds (ETF) inflows amid the market unrest and panic. Gold price remains on course for its strongest quarter since 1986.
However, the Gold price could witness another pullback in the sessions ahead if traders adjust their long positions in anticipation of Trump’s ‘Liberation Day’ on April 2. Markets could also use the US economic data releases as an excuse to take profits off the table, bracing for Trump’s ‘reciprocal tariffs,’ which are expected to induce intense volatility.
The daily chart indicates that the 14-day Relative Strength Index (RSI) remains in the highly overbought region, currently at 78.50, suggesting that buyers may be exhausted.
Therefore, a brief pullback could ensue, dragging Gold price back toward the $3,100 round level.
The next relevant support is seen at the previous day’s low of $3,077, below which the $3,050 psychological barrier will be tested.
On the flip side, Gold buyers need to find acceptance above the $3,150 threshold to initiate a fresh advance toward the $3,200 level.
Gold has played a key role in human’s history as it has been widely used as a store of value and medium of exchange. Currently, apart from its shine and usage for jewelry, the precious metal is widely seen as a safe-haven asset, meaning that it is considered a good investment during turbulent times. Gold is also widely seen as a hedge against inflation and against depreciating currencies as it doesn’t rely on any specific issuer or government.
Central banks are the biggest Gold holders. In their aim to support their currencies in turbulent times, central banks tend to diversify their reserves and buy Gold to improve the perceived strength of the economy and the currency. High Gold reserves can be a source of trust for a country’s solvency. Central banks added 1,136 tonnes of Gold worth around $70 billion to their reserves in 2022, according to data from the World Gold Council. This is the highest yearly purchase since records began. Central banks from emerging economies such as China, India and Turkey are quickly increasing their Gold reserves.
Gold has an inverse correlation with the US Dollar and US Treasuries, which are both major reserve and safe-haven assets. When the Dollar depreciates, Gold tends to rise, enabling investors and central banks to diversify their assets in turbulent times. Gold is also inversely correlated with risk assets. A rally in the stock market tends to weaken Gold price, while sell-offs in riskier markets tend to favor the precious metal.
The price can move due to a wide range of factors. Geopolitical instability or fears of a deep recession can quickly make Gold price escalate due to its safe-haven status. As a yield-less asset, Gold tends to rise with lower interest rates, while higher cost of money usually weighs down on the yellow metal. Still, most moves depend on how the US Dollar (USD) behaves as the asset is priced in dollars (XAU/USD). A strong Dollar tends to keep the price of Gold controlled, whereas a weaker Dollar is likely to push Gold prices up.
USD/CAD price settled mildly higher in latest intraday trading after taking a breather from the sustained rally yesterday, while collecting profits and venting off overbought saturation in the Stochastic as negative signals start to emerge from it.
It comes as the price breached a downward secondary trend line in the short term, while boosted by ongoing support due to trading above the 50-candle SMA.
To get our more detailed analysis and 100% accurate signals provided by Best Trading Signal, subscribe to Economies.com VIP Club through the link below!
An initial target from the bull wedge is the beginning of the wedge at $4.26. That target was essentially satisfied today. Nonetheless, that doesn’t mean the advance is over, but maybe natural gas takes a rest first via a pullback or consolidation before attempting higher prices. Also, when adding the height in price to the breakout level, an alternative potential target of $4.40 is established. As with all targets they are estimates that may or may not be reached.
A decline below Monday’s low of $4.055 is a sign of further short-term weakening that could lead to a move lower to test prior resistance areas as support. Two initial price areas to watch for signs of support include prior support from the mid-March interim swing low at $3.96, and the 50-Day MA, now at $3.87. It is interesting to note that the breakout of the top line of the wedge occurred at a similar price area.
Following the reclaim of the 50-Day MA on February 13, the 50-Day line successfully tested as support in early-March and a higher swing low was established. Although the recent decline failed to find support at the 50-Day MA, the subsequent quick bullish recovery can be viewed as a successful test of support at the 50-Day line.
For a look at all of today’s economic events, check out our economic calendar.