The main category of Forex News.
You can use the search box below to find what you need.
[wd_asp id=1]
The main category of Forex News.
You can use the search box below to find what you need.
[wd_asp id=1]
Even as the Stochastic continues to send out negative signals, as the price holds its ground above $5.00, it underpins the upward trend, however the price might engage in some sideways trading to gather enough momentum and rush towards $5.150, then target the major resistance at $5.340.
However, a breach of $5.00 would send the price towards more correctional negative trades towards $4.9200, then $4.8100.
Expected trading range today is between $5.000 and
$5.1500.
Today’s price forecast: Bullish
Conversely, the US dollar finds support from the higher-than-expected rise in US durable goods orders, in addition to the return of risk aversion due to Trump’s tariffs on car imports. Concerns about exacerbating trade uncertainty keep riskier currencies in a weak position.

The GBP/USD pair is on an upward trajectory, but it’s important to note that investor risk aversion will benefit the US dollar.
US trade policy has been a major focus of the forex markets following US President Trump’s announcement of a 25% tariff on all auto imports into the United States. Financial markets remain tense, as the US is expected to announce reciprocal tariffs this week. Uncertainty surrounds the level of tariffs and retaliatory measures from other countries.
The US tariffs will have some impact on the British economy, but the European Union is expected to perform worse. UK bond yields also rose slightly, boosting the pound.
The US dollar will be vulnerable if US economic conditions deteriorate, but there has been no evidence of labour market pressure in the latest jobless claims data. Major geopolitical developments have contributed to reducing market interest in the UK Spring Budget statement, but there are still fundamental concerns surrounding growth forecasts, which could weaken the British pound.
The GBP/USD pair is currently trading at 1.2940, showing signs of decline after reaching its recent highs. The chart shows a clear upward trend since January, with price action forming a series of bottoms and highs, although the pair has recently faced resistance. The GBP/USD pair is currently hovering around the 38.2% Fibonacci retracement level at 1.28379, after retreating from its recent peak. Important support lies at the 50% (1.27828) and 61.8% (1.27276) retracement levels, which could form potential rebound areas if the current decline continues.
Overall, the underlying trend remains bullish, as evidenced by the price trading above both the rising trend line established since January and the major moving averages. However, recent price action suggests a possible consolidation or minor correction phase. Currently, the price is testing the short-term 100-period simple moving average, which has acted as dynamic support throughout the uptrend. The long-term 200-period simple moving average continues to slope upward, confirming the overall bullish bias in the market.
Meanwhile, the stochastic indicator shows that the GBP/USD pair is moving away from overbought conditions, with readings recently declining from above 80. This suggests that momentum may be slowing in the short term, which could support continued neutrality.
Ready to trade our GBP/USD Forex analysis? Here are the best regulated trading platforms UK to choose from.
Platinum price kept trying to regain the upward trend with positive signals from major indicators, thus holding its ground above the 55 SMA, which recently represented an additional support at $964.00, with the price snagging some gains by wavering near $990.00.
The price will likely form additional ascending waves and might try to pressure the $1000.00 barrier, with a breach sending the price towards the 61.8% Fibonacci retracement level near $1017.
Expected trading range today is between $975 and $1000.
Today’s price forecast: Bullish
According to Forex market trading, the US dollar’s performance against other major currencies was affected by the announcement of accelerating US Personal Consumption Expenditures (PCE) inflation in February. According to the economic calendar results, US inflation rose by 0.4% month-on-month in February, from 0.3% in January, exceeding expectations of 0.3%. The annual rate reached 2.8% from 2.7%, also exceeding expectations of 2.7%.
As is well known, PCE inflation is a measure of US inflation that the Federal Reserve considers when making US interest rate decisions and is closely watched by markets. According to licensed trading platforms, the US dollar fell from its highs following these figures, providing a clear explanation for the current US economic dynamics: stagflation conditions are uncomfortably close.
In general, upside surprises in inflation typically indicate a robust economy, leading to higher US bond yields and a stronger dollar. However, we are beginning to see the opposite reaction, with the dollar declining on the back of better-than-expected inflation data. This is because rising inflation is not accompanied by corresponding economic strength: stagflation describes an economy experiencing high inflation and declining growth.
We still recommend buying the USD/JPY pair at every downward level, but without risk.
Under these circumstances, the US Federal Reserve is unable to respond to economic weakness because inflation is moving in the wrong direction, ensuring the entrenchment of economic weakness. This increasingly proves the negative situation for the US dollar because of President Donald Trump’s aggressive tariff agenda.
As is well known, tariffs risk raising domestic prices and negatively impacting confidence. Recently, the Conference Board reported that its US consumer confidence index fell 7.2 points to 92.9, its lowest level in more than two years. The expectations index fell 9.6 points to 65.2, its lowest level in 12 years and well below the 80-point threshold that often signals an impending recession.
According to recent trading, the USD/JPY pair has declined to trade slightly below the 100-hour moving average. Friday’s decline pushed the USD/JPY pair closer to the 14-hour RSI overbought levels. Therefore, bears will seek to extend the current decline towards 149.30 or lower to the 148.20 support. Conversely, bulls will seek to capitalize on upward rebounds around 150.55 or higher at the 151.60 resistance.
In the long term, based on the daily chart, the USD/JPY pair is trading within an ascending channel. However, the 14-day RSI still has room to move before reaching overbought conditions. Therefore, bulls will seek to capitalize on the current wave of gains towards the resistance level of 152.40 or higher to the resistance level of 154.00. Conversely, and over the same period, bears will seek to capitalize on selling operations to take profits around 146.80 or lower at the support level of 144.00, respectively.
Want to trade our USD/JPY forex analysis and predictions? Here’s a list of forex brokers in Japan to check out.
Silver price (XAG/USD) wobbles around $34.00 in Monday’s European session. The white metal trades flat as investors have sidelined to have a clear view on global economic outlook, with United States (US) President Donald Trump to unveil reciprocal tariffs on Wednesday.
Donald Trump is set to announce reciprocal levies on so-called “Liberation Day” after which tariffs be equivalent charged by other nations on the US for same products. The impact of reciprocal tariffs is expected to be significant on the global economic growth. The appeal of precious metals, such as Silver, increases amid heightening global economic tensions.
Investors expect Trump tariffs will also weaken the US economic growth, given that the impact of higher tariffs will be borne by US importers. This will also result in a resurgence in inflationary pressures.
Fears of US economic risks and accelerating price pressures in the near term have forced federal Reserve (Fed) officials to maintain a restrictive monetary policy guidance. On Friday, San Francisco Fed Bank President Mary Daly expressed that her confidence is easing in her expectations that there will be two interest rate cuts this year. Her confidence on two interest rate cuts this year shaken after the release of the US core Personal Consumption Expenditure Price Index (PCE) data for February, which accelerated at a faster-than-expected pace of 2.8% compared to estimates of 2.7% and the former release of 2.6%.
Historically, firm expectations for the Fed’s higher-for-longer interest rate stance weigh on non-yielding assets, such as Silver.
Silver price advances toward the flat border of the Ascending Triangle chart pattern formation on the daily timeframe near the October 22 high of $34.87. The upward-sloping border of the above-mentioned chart pattern is placed from the August 8 low of $26.45. Technically, the Ascending Triangle pattern indicates indecisiveness among market participants.
The 20-day Exponential Moving Average (EMA) near $33.30 continues to provide support to the Silver price.
The 14-day Relative Strength Index (RSI) rebounds above 60.00, suggesting a resurgence in bullish momentum.
Looking down, the March 6 high of $32.77 will act as key support for the Silver price. While, the October 22 high of $34.87 will be the major barrier.
Silver is a precious metal highly traded among investors. It has been historically used as a store of value and a medium of exchange. Although less popular than Gold, traders may turn to Silver to diversify their investment portfolio, for its intrinsic value or as a potential hedge during high-inflation periods. Investors can buy physical Silver, in coins or in bars, or trade it through vehicles such as Exchange Traded Funds, which track its price on international markets.
Silver prices can move due to a wide range of factors. Geopolitical instability or fears of a deep recession can make Silver price escalate due to its safe-haven status, although to a lesser extent than Gold’s. As a yieldless asset, Silver tends to rise with lower interest rates. Its moves also depend on how the US Dollar (USD) behaves as the asset is priced in dollars (XAG/USD). A strong Dollar tends to keep the price of Silver at bay, whereas a weaker Dollar is likely to propel prices up. Other factors such as investment demand, mining supply – Silver is much more abundant than Gold – and recycling rates can also affect prices.
Silver is widely used in industry, particularly in sectors such as electronics or solar energy, as it has one of the highest electric conductivity of all metals – more than Copper and Gold. A surge in demand can increase prices, while a decline tends to lower them. Dynamics in the US, Chinese and Indian economies can also contribute to price swings: for the US and particularly China, their big industrial sectors use Silver in various processes; in India, consumers’ demand for the precious metal for jewellery also plays a key role in setting prices.
Silver prices tend to follow Gold’s moves. When Gold prices rise, Silver typically follows suit, as their status as safe-haven assets is similar. The Gold/Silver ratio, which shows the number of ounces of Silver needed to equal the value of one ounce of Gold, may help to determine the relative valuation between both metals. Some investors may consider a high ratio as an indicator that Silver is undervalued, or Gold is overvalued. On the contrary, a low ratio might suggest that Gold is undervalued relative to Silver.
Bank of America expects further losses for the dollar in the second quarter; He stated, “If history is any guide, the US Dollar Index (DXY) could return to 100 in the second quarter, indicating renewed strength for the euro, the Japanese yen, and other G10 currencies.”
In general, the US dollar will be vulnerable if US economic conditions deteriorate, but there has been no evidence of labour market pressure in the latest jobless claims data. According to economists, even if the US dollar sees a short-term recovery, the deteriorating fiscal outlook, slowing consumer spending, and increasing political uncertainty – particularly regarding the DOGE index – will overshadow the US currency as the year progresses.
We still recommend selling the euro against the US dollar from every upside level, but without risk.
In recent trading and across stock trading platforms, US stock market indices closed sharply lower, affected by rising inflation concerns and increasing uncertainty regarding trade policy. According to trading, the S&P 500 index fell 2%, the Dow Jones Industrial Average fell 715 points, and the Nasdaq 100 fell 2.7%. Tech giants led the decline, with Alphabet, Amazon, and Meta shares falling more than 4% each, while Microsoft shares fell 3%.
In general, inflation concerns have escalated after the final reading of the University of Michigan’s US Consumer Confidence Index for March showed the highest long-term inflation expectations since 1993. At the same time, the core Personal Consumption Expenditures (PCE) price index, the Federal Reserve’s preferred US inflation measure, rose by 2.8% in February, exceeding expectations, while consumer spending grew by 0.4%. Investors are currently preparing for further trade disruptions as Trump’s 25% car tariff takes effect this week, raising fears of retaliatory action by major trading partners.
According to trading data, the S&P 500 and Nasdaq fell by more than 1% and 2%, respectively, marking their fifth weekly decline in six weeks, while the Dow Jones Industrial Average fell by 0.8%.
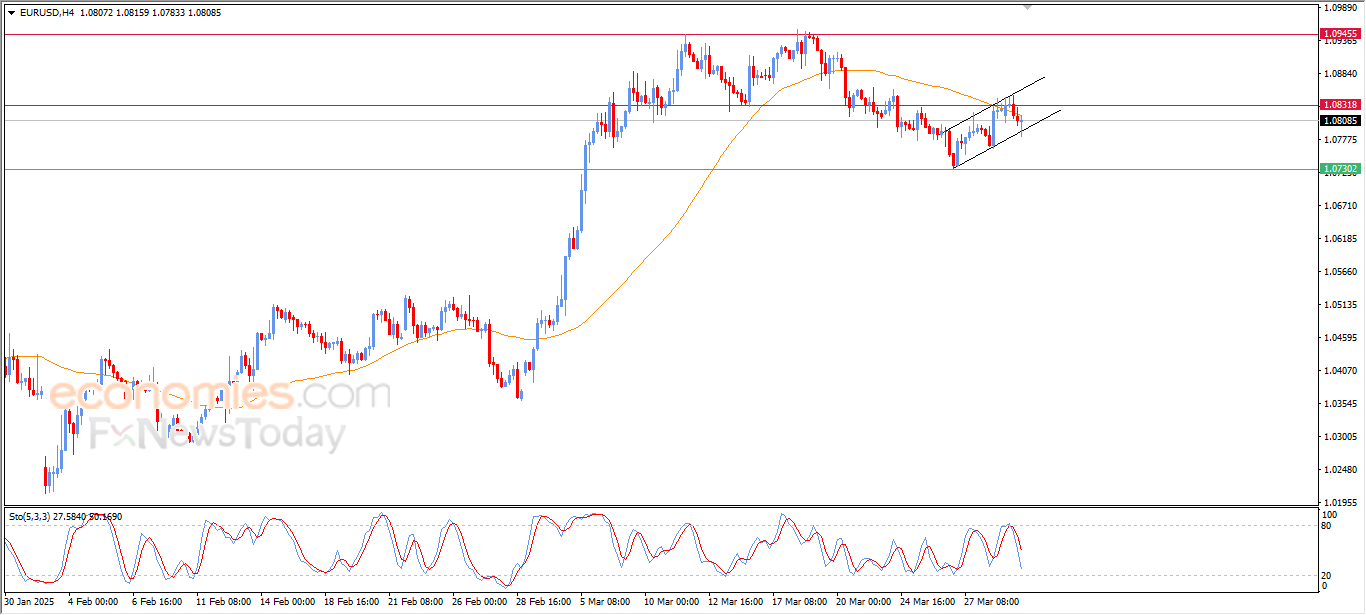
According to trading on the daily chart, downward pressure on the EUR/USD pair will increase if bears manage to stabilize below the 1.0800 support level. Technically, the next most important support levels will be 1.0720 and 1.0600, respectively. From the latter level, technical indicators will move towards strong oversold levels. Conversely, based on the performance on the daily chart, no real and strong trend reversal will occur unless the EUR/USD price moves above the psychological resistance of 1.1000.
The EUR/USD pair will be affected in the coming days by the US administration’s reaction to the imposition of tariffs that could harm the European economy, in addition to signals from global central bank officials regarding tightening or not.
Ready to trade our daily Forex analysis? We’ve made a list of the best forex demo accounts worth trading with.
Natural gas has broken decisively above a months-long descending trendline, with prices pushing through both the 50 EMA ($3.974) and 200 EMA ($3.937). The breakout is supported by a bullish ABCD harmonic pattern completing near $3.755, marking a strong inflection point.
Price is now trading comfortably above $4.00, with momentum accelerating toward the next key resistance at $4.228, followed by $4.416. This move confirms the end of the recent consolidation phase and suggests a shift in sentiment.
A sustained hold above $4.00 strengthens the bullish case, particularly with both EMAs now trending upward. Should prices dip, immediate support rests at $3.938, then $3.755—the breakout level and harmonic support.
With volume increasing on the breakout and structure aligning, bulls appear to have regained control. Natural gas breaks out above trendline and key EMAs. Bullish above $4.00, targeting $4.228 and $4.416. Pullbacks may attract buyers near $3.938.
The GBP/JPY is one of the more volatile currency pairs and usually provides ample movement and potential opportunities.
In the past few weeks, Yen weakness and resurgent GBP have led the pair higher since bottoming out on February 7 at around the 187.00 handle.
This came about despite increased hopes of further Bank of Japan (BoJ) rate hikes later this year. Bank of Japan (BoJ) Governor Kazuo Ueda said on Wednesday that the central bank will keep raising interest rates if the economy and prices grow as expected. Additionally, strong wage increases for the third year in a row are fueling hopes for more rate hikes by the BoJ.
Meanwhile developments across the pond in the UK suggest further rate cuts may be in offing after the Office for National Statistics reported on Wednesday that the UK’s main inflation rate (CPI) rose 2.8% in February compared to a year ago, down from 3.0% in January. This was lower than the 2.9% economists had predicted. Core inflation, which removes changes in food and energy prices, increased by 3.5% in February, less than the 3.7% seen in January and below the expected 3.6%.
All in all its supposed to read a weaker GBP as rate cuts are expected and JPY strength as rate hikes are planned. However this is not how price action has developed over the past few weeks.
Price action and chart patterns are hinting at a major bullish rally for GBP/JPY so let us see what the charts look like.
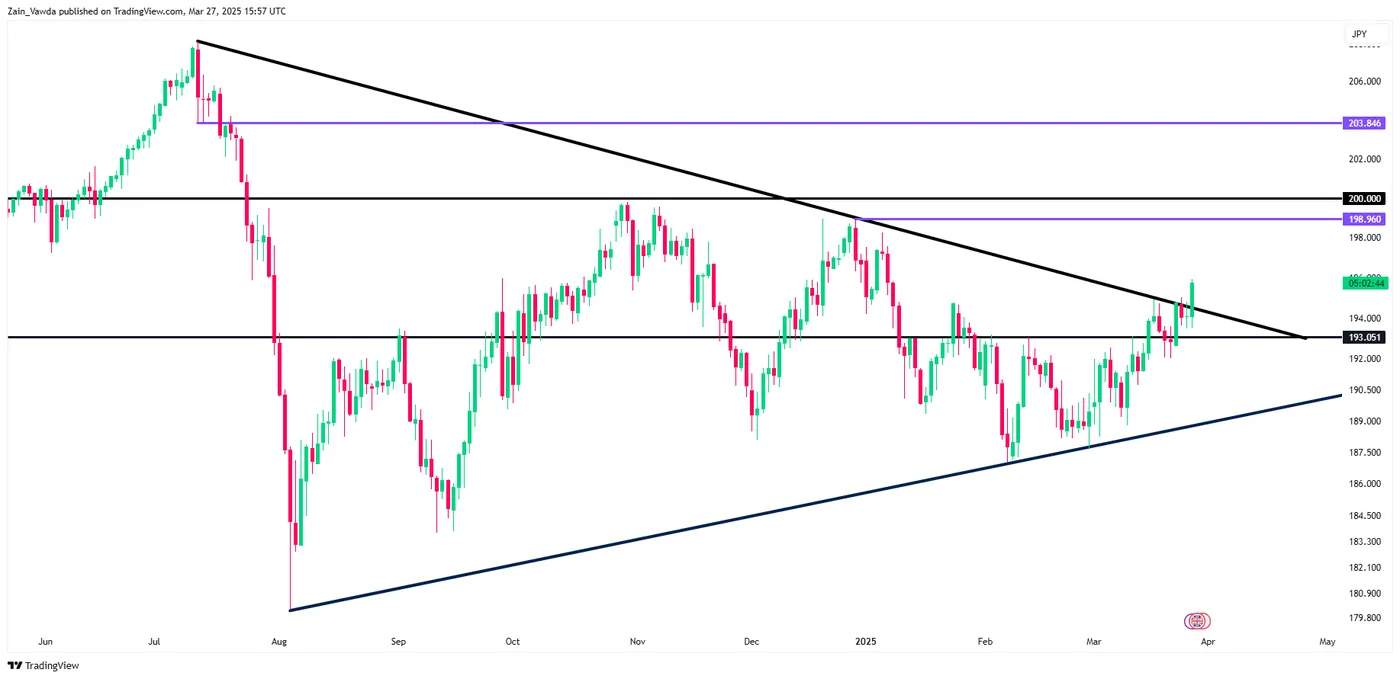
GBP/JPY Daily Chart, March 27, 2025
Source TradingView
From a technical standpoint, GBP/JPY on a daily timeframe has staircased its way higher since February 7.
The pair has been trading in a massive symmetrical triangle pattern with a breakout today looking likely.
Trading triangle patterns requires patience, however there is definitely a setup brewing.
A daily candle close above the triangle pattern will be the signal for triangle pattern setup based on the rules. However given the fickle nature of markets in recent times, there is a possibility of a short-term pullback and for that we need to take a look at the H4 chart for potential areas of interest to pay attention to.
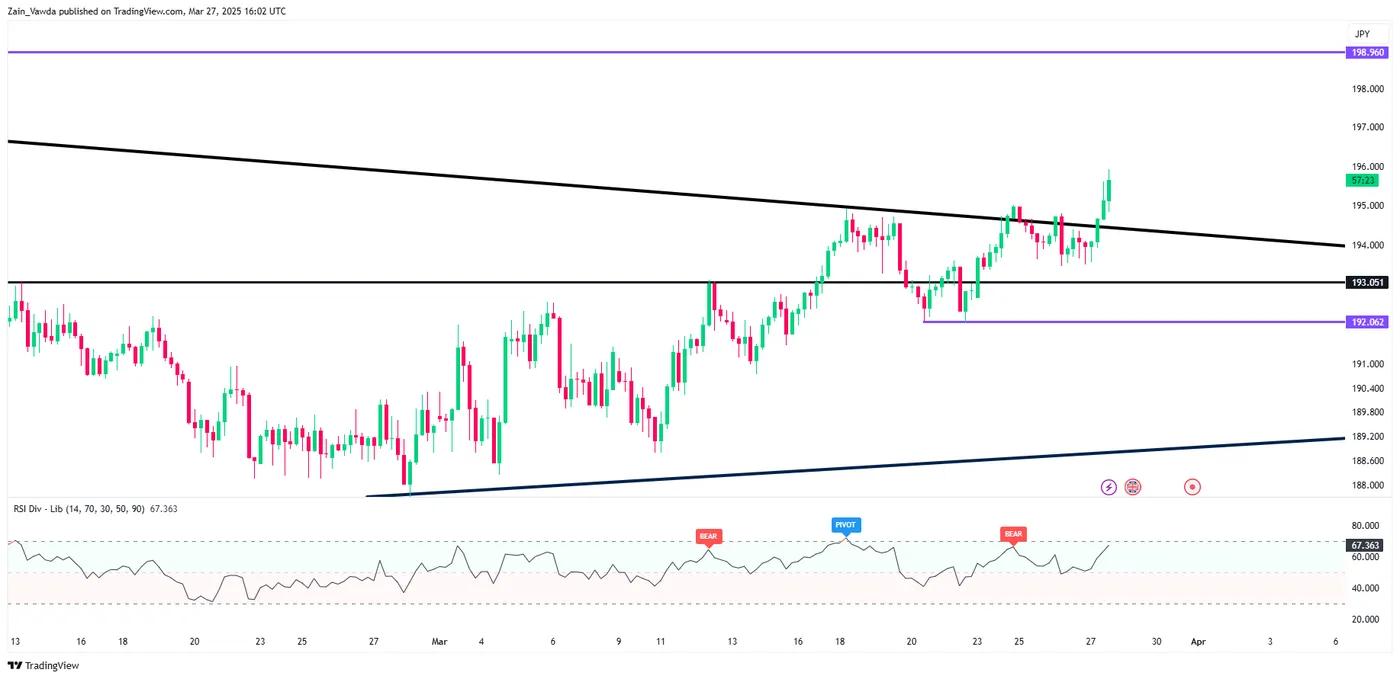
GBP/USD Four Hour Chart, March 27, 2025
Source TradingView
Dropping down to a four-hour chart and we have just printed fresh highs which could lead to a potential pullback.
However, there is also the possibility that the pair rises further before any pullback comes to fruition.
The period 14 RSI is also just short of being in overbought territory.
OAU-PRS-236-MarketPulse-variant1-Square
A pullback to the March 26 low around the 193.50 handle may provide bulls with an even better entry following the triangle breakout. If this level fails to hold, a deeper pullback toward the swing low at 192 may be in the offing.
Either way if the triangle pattern does play out, the potential move could take GBP/JPY to highs of around 222.00, last reached before the global financial crisis in December 2007.
A mega move if there ever was one.
Support
Resistance
Even as the Stochastic continues to send out negative signals, as the price holds its ground above $5.00, it underpins the upward trend, however the price might engage in some sideways trading to gather enough momentum and rush towards $5.150, then target the major resistance at $5.340.
However, a breach of $5.00 would send the price towards more correctional negative trades towards $4.9200, then $4.8100.
Expected trading range today is between $5.000 and
$5.1500.
Today’s price forecast: Bullish
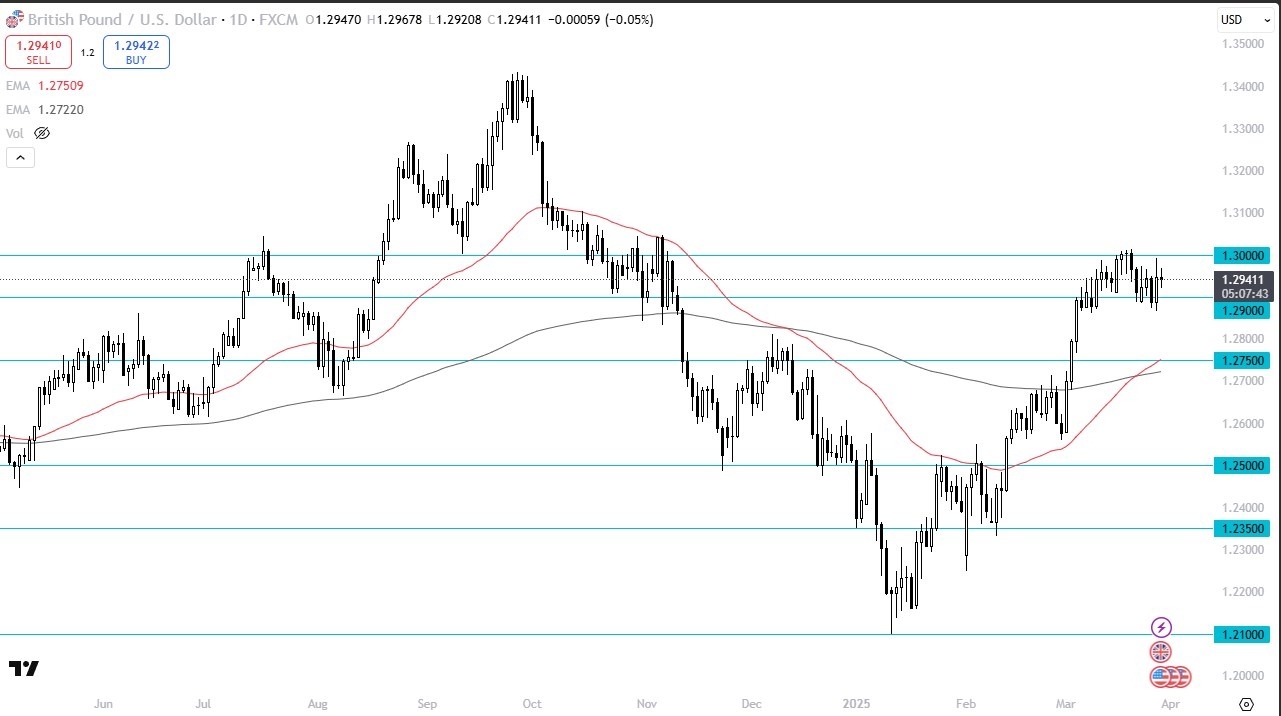
Now we find ourselves digesting a massive move higher as we have been going sideways for a couple of weeks. The 1.30 level above is a barrier while the 1.29 level underneath is support. We recently had the so-called Golden Cross and therefore longer term traders will assume this is a bullish market.
If we can break above the 1.3050 level, then I think it’s very likely that the British pound has much further to go, perhaps as high as 1.34. On a breakdown below the 1.2875 level, then we could see the market drop down to the 1.2750 level, possibly even the 200-day EMA. In general, I think this is a market that continues to be very noisy, but the British pound is a stronger performer in general terms than the US dollar against other currencies.
So, I think it probably has more of a lean to the upside in the short term. We’ll just have to wait and see whether or not that continues here. In that situation, the market will likely to be one that outperform other currencies against the US dollar. The market will continue to pay close attention to risk appetite for currencies outside of the US, and there is a high likelihood that buyers will eventually show up again.
Ready to trade our daily GBP/USD Forex forecast? Here’s some of the best forex broker UK reviews to check out.