The main category of Forex News.
You can use the search box below to find what you need.
[wd_asp id=1]
The main category of Forex News.
You can use the search box below to find what you need.
[wd_asp id=1]
Platinum price managed to surpass the barrier of $983.00 yesterday and reactivate the upward momentum, as the 55 SMA forms an additional support near $966.00, while the Stochastic sends out positive signals by exiting oversold levels.
The price will likely head towards $1000.00, thus heading additional targets such as $1017 and $1026 respectively.
Expected trading range today is between $975 and $1000.
Today’s price forecast: Bullish
Silver price (XAG) posts a fresh five-month high near $34.60 in North American trading hours on Friday. The white metal strengthens as investors turn cautious ahead of April 2, when United States (US) President Donald Trump is scheduled to unveil reciprocal tariffs.
Market participants expect that Trump’s tariffs will result in an economic slowdown and boost inflationary pressures in the near term. Such a scenario increases the appeal of safe-haven assets, such as Silver.
However, the US Dollar (USD) slumps as Trump’s tariffs will also weigh on the US economic outlook. Investors expect the impact the tariffs will have on US imports, which would be forced to pass them on to consumers. The US Dollar Index (DXY), which tracks the Greenback’s value against six major currencies, slides to near 104.00.
Meanwhile, hotter-than-expected US core PCE Inflation – which excludes volatile food and energy items – fails to provide support to the US Dollar. The underlying inflation data rose at a faster pace of 2.8% year-on-year compared to estimates and the prior release of 2.7%. Month-on-month core PCE inflation grew by 0.4%, faster than expectations and the former reading of 0.3%.
Accelerating inflationary pressures force the Federal Reserve (Fed) to maintain a restrictive monetary policy stance for a longer period. Higher interest rates by the Fed bode poorly for non-yielding assets, such as Silver.
Silver price advances toward the flat border of the Ascending Triangle chart pattern formation on the daily timeframe near the October 22 high of $34.87. The upward-sloping border of the above-mentioned chart pattern is placed from the August 8 low of $26.45. Technically, the Ascending Triangle pattern indicates indecisiveness among market participants.
The 20-day Exponential Moving Average (EMA) near $33.30 continues to provide support to the Silver price.
The 14-day Relative Strength Index (RSI) rebounds above 60.00, suggesting a resurgence in bullish momentum.
Looking down, the March 6 high of $32.77 will act as key support for the Silver price. While, the October 22 high of $34.87 will be the major barrier.
Silver is a precious metal highly traded among investors. It has been historically used as a store of value and a medium of exchange. Although less popular than Gold, traders may turn to Silver to diversify their investment portfolio, for its intrinsic value or as a potential hedge during high-inflation periods. Investors can buy physical Silver, in coins or in bars, or trade it through vehicles such as Exchange Traded Funds, which track its price on international markets.
Silver prices can move due to a wide range of factors. Geopolitical instability or fears of a deep recession can make Silver price escalate due to its safe-haven status, although to a lesser extent than Gold’s. As a yieldless asset, Silver tends to rise with lower interest rates. Its moves also depend on how the US Dollar (USD) behaves as the asset is priced in dollars (XAG/USD). A strong Dollar tends to keep the price of Silver at bay, whereas a weaker Dollar is likely to propel prices up. Other factors such as investment demand, mining supply – Silver is much more abundant than Gold – and recycling rates can also affect prices.
Silver is widely used in industry, particularly in sectors such as electronics or solar energy, as it has one of the highest electric conductivity of all metals – more than Copper and Gold. A surge in demand can increase prices, while a decline tends to lower them. Dynamics in the US, Chinese and Indian economies can also contribute to price swings: for the US and particularly China, their big industrial sectors use Silver in various processes; in India, consumers’ demand for the precious metal for jewellery also plays a key role in setting prices.
Silver prices tend to follow Gold’s moves. When Gold prices rise, Silver typically follows suit, as their status as safe-haven assets is similar. The Gold/Silver ratio, which shows the number of ounces of Silver needed to equal the value of one ounce of Gold, may help to determine the relative valuation between both metals. Some investors may consider a high ratio as an indicator that Silver is undervalued, or Gold is overvalued. On the contrary, a low ratio might suggest that Gold is undervalued relative to Silver.
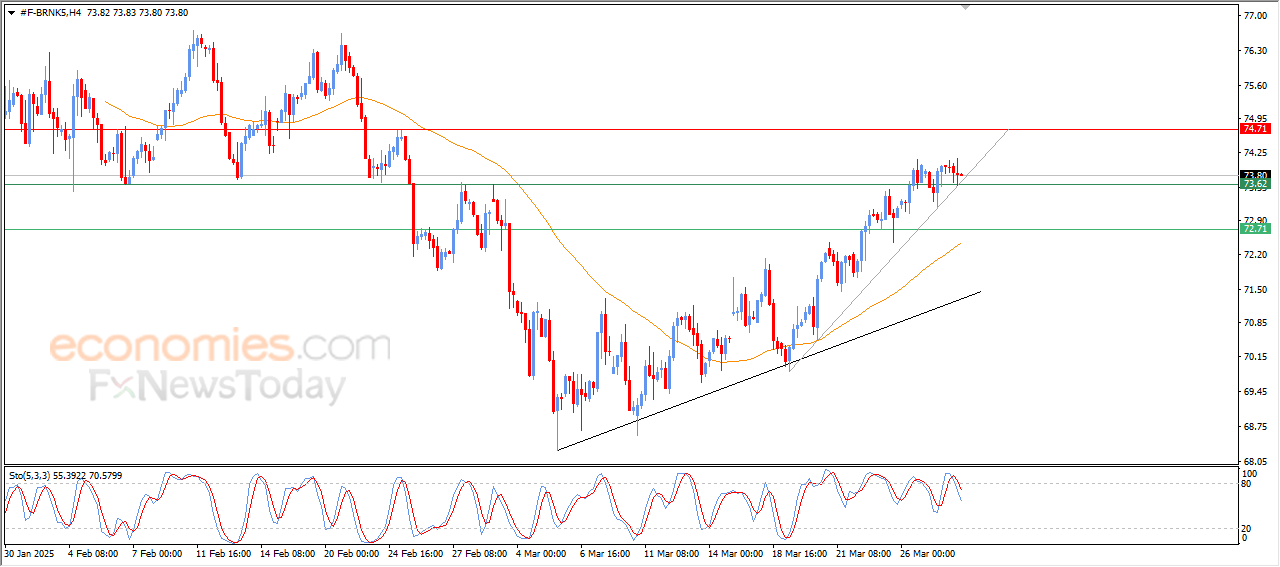
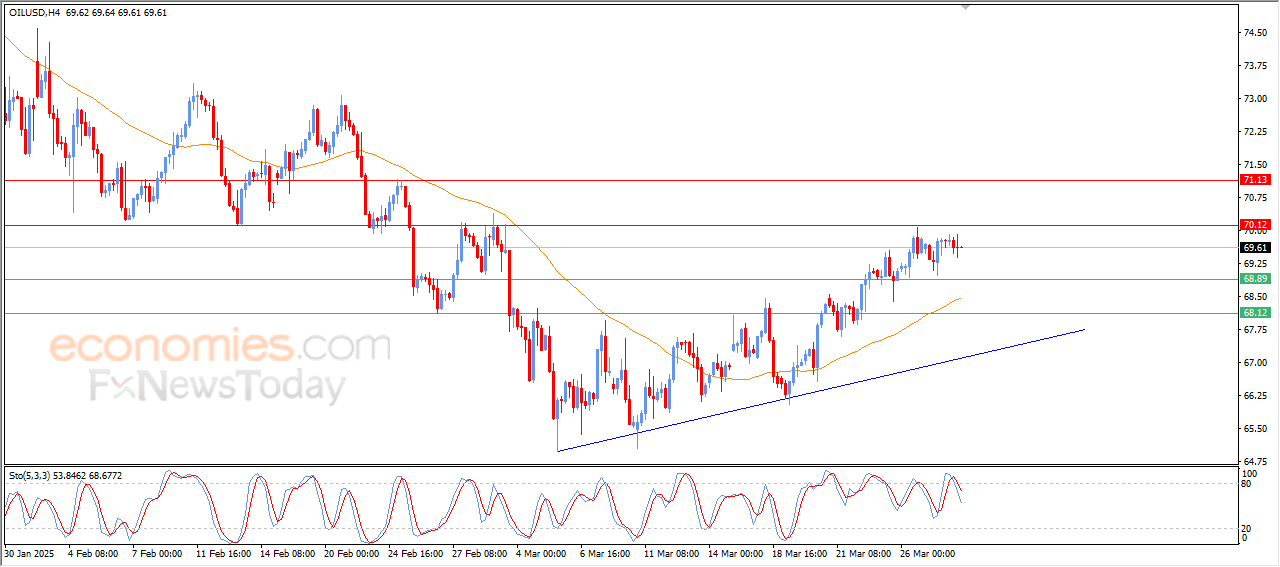
Brent crude oil price edged lower in the intraday levels, amid the dominance of the upward correctional trend in the short term as the price trades alongside primary and secondary trend line, while trying to vent off overbought saturation in the Stochastic, with negative signals emerging from it, while gathering positive momentum to rise anew.
To get our more detailed analysis and 100% accurate signals provided by Best Trading Signal, subscribe to Economies.com VIP Club through the link below!

To the upside, have the 165 yen level, which offers a bit of a ceiling. But if we were to break above there, then I think you do see the Japanese yen get absolutely hammered, probably against multiple other currencies, not just this one. A breakdown below the 160 yen level means that the yen is starting to strengthen against probably most currencies. And we could drop down to the 155 yen level. This is an area that has been very important for some time and should continue to be.
The size of the candlestick is pretty impressive, but I do recognize that there is a lot of noise above that you will have to deal with. So therefore, I do think that waiting for short-term pullbacks could be a nice buying opportunity and probably the way to go with this market. I have no interest in shorting it, at least not until we break down below the 160 yen level, which is something that would be somewhat difficult to do in this short-term environment. This is a market that will continue to be very choppy to say the least.
Begin trading our daily forecasts and analysis. Here is a list of Forex brokers in Japan to work with.
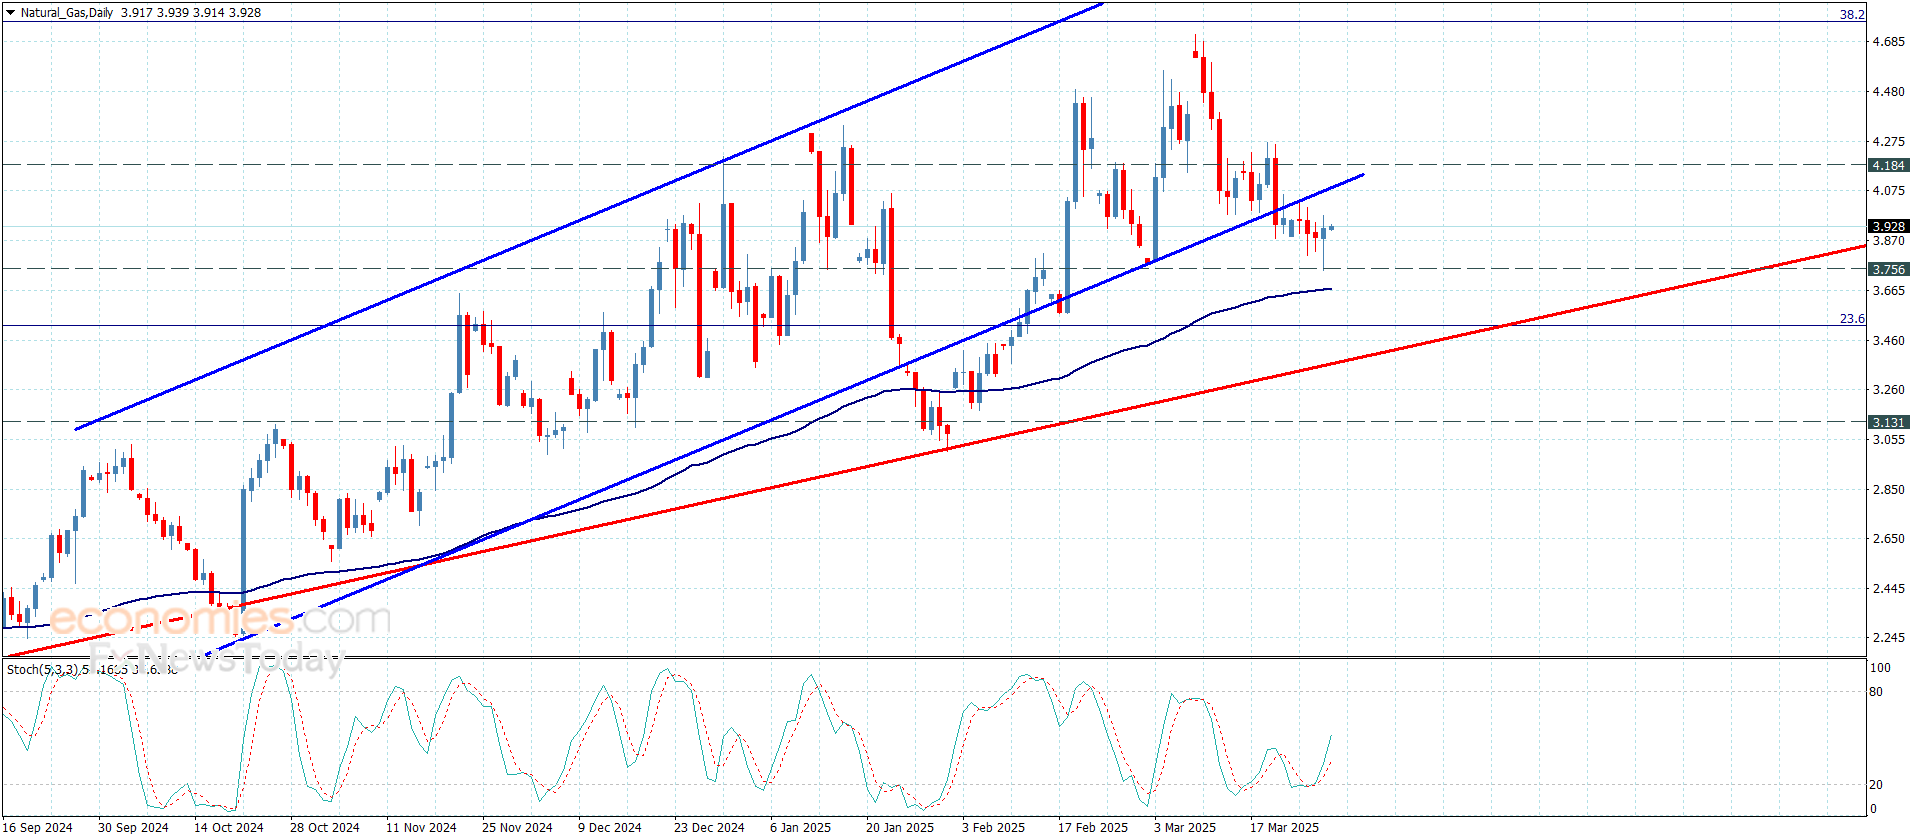
Natural gas price held above the support of $3.750 and started forming upward waves that sent the price to $3.940, with positive signals from major indicators, paving the way towards $4.085 initially, with a breach sending the price to $4.180 and $4.260.
Expected trading range today is between $3.850 and $4.085.
Today’s price forecast: Bullish as the support holds
March 28, 2025 – Written by David Woodsmith
STORY LINK Pound to Euro Today: GBP/EUR Rate “Subdued” amid Trump Tariff Threats
The Pound was rangebound on Thursday following US President Donald Trump’s latest tariff announcement.
At the time of writing, the Pound Euro (GBP/EUR) exchange rate was trading at around €1.1992, virtually unchanged from Wednesday’s opening levels.
On Thursday, the Euro (EUR) wavered against most of its major counterparts.
While it strengthened against some currencies, it weakened against others, even though the economic calendar was relatively quiet.
Despite the lack of significant data releases, the Euro managed to gain ground against several of its peers following US President Donald Trump’s latest tariff announcement.
On Wednesday, Trump declared a 25% tariff on all non-American cars, which led to a weakening of the US Dollar (USD) on Thursday, allowing the Euro to benefit from its inverse relationship with USD.
However, concerns about potential additional tariffs on the Eurozone likely limited the Euro’s upward momentum and caused it to decline against several other currencies.

On Thursday, the Pound (GBP) traded within a narrow range against most of its major counterparts, following the Spring Statement on Wednesday.
The budget included several spending cuts and a substantial downgrade of the UK’s growth forecast by the Office for Budget Responsibility (OBR), which revised the projection from 2% to 1% for 2025.
Despite the Pound recovering most of its losses on Thursday, GBP exchange rates were unable to gain ground due to concerns over Trump’s tariff announcement on cars, which sparked fears about the future economic health of the UK.
Looking ahead to Friday, the primary driver of movement for the Pound Euro exchange rate will likely be several key economic releases from both the UK and the Eurozone.
For the Pound, the UK is set to release its February retail sales data, where the index is forecast to drop from a previous reading of 1.7% to -0.3%.
If the data meets these expectations, it could put downward pressure on GBP exchange rates, potentially closing the week on a weaker note.
On the Euro side, Germany, the largest economy in the Eurozone, will publish its latest GfK consumer confidence index and jobs data.
Additionally, the Eurozone is expected to release its latest economic sentiment reading.
Any negative surprises from these reports could introduce fresh headwinds for the Euro, impacting its performance against the Pound and other major currencies.
International Money Transfer? Ask our resident FX expert a money transfer question or try John’s new, free, no-obligation personal service! ,where he helps every step of the way,
ensuring you get the best exchange rates on your currency requirements.
TAGS: Pound Euro Forecasts
Copper price wrapped up its upward surge temporarily after touching $5.3300, while collecting profits and settling near the previous psychological barrier of $5.000.
As the Stochastic settles below 50, the price will likely extend losses and target $4.9500, however, a renewal of the upward rush would require closing above $4.1800, sending the price to the next target at $5.4100.
Expected trading range today is between $4.9500 and $5.1300.
Today’s price forecast: Bearish
GBP/USD gathered bullish momentum and closed in positive territory on Thursday. The pair stays in a consolidation phase near 1.2950 in the European session on Friday as markets await the next key data release from the US.
The table below shows the percentage change of British Pound (GBP) against listed major currencies this week. British Pound was the strongest against the Japanese Yen.
| USD | EUR | GBP | JPY | CAD | AUD | NZD | CHF | |
|---|---|---|---|---|---|---|---|---|
| USD | 0.45% | -0.22% | 0.86% | -0.19% | -0.29% | 0.33% | -0.03% | |
| EUR | -0.45% | -0.77% | -0.10% | -0.59% | -0.76% | -0.07% | -0.43% | |
| GBP | 0.22% | 0.77% | 1.05% | -0.45% | -0.02% | 0.71% | 0.24% | |
| JPY | -0.86% | 0.10% | -1.05% | -1.03% | -1.16% | -0.50% | -0.89% | |
| CAD | 0.19% | 0.59% | 0.45% | 1.03% | -0.05% | 0.52% | 0.16% | |
| AUD | 0.29% | 0.76% | 0.02% | 1.16% | 0.05% | 0.71% | 0.34% | |
| NZD | -0.33% | 0.07% | -0.71% | 0.50% | -0.52% | -0.71% | -0.29% | |
| CHF | 0.03% | 0.43% | -0.24% | 0.89% | -0.16% | -0.34% | 0.29% |
The heat map shows percentage changes of major currencies against each other. The base currency is picked from the left column, while the quote currency is picked from the top row. For example, if you pick the British Pound from the left column and move along the horizontal line to the US Dollar, the percentage change displayed in the box will represent GBP (base)/USD (quote).
The broad-based US Dollar (USD) weakness helped GBP/USD gain traction on Thursday as the auto tariffs announcement by US President Donald Trump revived concerns over an economic slowdown.
Early Friday, the UK’s Office for National Statistics reported that Retail Sales rose by 1% on a monthly basis in February. This reading followed the 1.4% increase (revised from 1.7%) recorded in January and came in better than the market expectation for a decrease of 0.3%.
Although the upbeat UK data helped Pound Sterling find demand with the immediate reaction, the risk-averse market atmosphere seems to be making it difficult for the pair to stretch higher. As of writing, US stock index futures were losing between 0.2% and 0.4% on the day.
The US Bureau of Economic Analysis will publish the Personal Consumption Expenditures (PCE) Price Index data, the Federal Reserve’s preferred gauge of inflation, for February. On a monthly basis, the core PCE Price Index is forecast to rise by 0.3%. A stronger-than-expected increase could support the USD with the immediate reaction and cause GBP/USD to stretch lower heading into the weekend. On the flip side, a soft reading of 0.1%, or lower, could help the pair stretch higher. Unless the risk mood improves, however, the pair’s upside is likely to remain capped.
GBP/USD manages to hold above the 100-period Simple Moving Average (SMA) on the 4-hour chart and the Relative Strength Index (RSI) indicator stays slightly above 50, reflecting a lack of bearish momentum.
On the downside, 1.2930 (20-day SMA) aligns as immediate support before 1.2900 (lower limit of the ascending regression channel) and 1.2800 (200-day SMA). Looking north, resistances could be spotted at 1.3000 (static level, round level) and 1.3040 (mid-point of the ascending channel).
The Pound Sterling (GBP) is the oldest currency in the world (886 AD) and the official currency of the United Kingdom. It is the fourth most traded unit for foreign exchange (FX) in the world, accounting for 12% of all transactions, averaging $630 billion a day, according to 2022 data.
Its key trading pairs are GBP/USD, also known as ‘Cable’, which accounts for 11% of FX, GBP/JPY, or the ‘Dragon’ as it is known by traders (3%), and EUR/GBP (2%). The Pound Sterling is issued by the Bank of England (BoE).
The single most important factor influencing the value of the Pound Sterling is monetary policy decided by the Bank of England. The BoE bases its decisions on whether it has achieved its primary goal of “price stability” – a steady inflation rate of around 2%. Its primary tool for achieving this is the adjustment of interest rates.
When inflation is too high, the BoE will try to rein it in by raising interest rates, making it more expensive for people and businesses to access credit. This is generally positive for GBP, as higher interest rates make the UK a more attractive place for global investors to park their money.
When inflation falls too low it is a sign economic growth is slowing. In this scenario, the BoE will consider lowering interest rates to cheapen credit so businesses will borrow more to invest in growth-generating projects.
Data releases gauge the health of the economy and can impact the value of the Pound Sterling. Indicators such as GDP, Manufacturing and Services PMIs, and employment can all influence the direction of the GBP.
A strong economy is good for Sterling. Not only does it attract more foreign investment but it may encourage the BoE to put up interest rates, which will directly strengthen GBP. Otherwise, if economic data is weak, the Pound Sterling is likely to fall.
Another significant data release for the Pound Sterling is the Trade Balance. This indicator measures the difference between what a country earns from its exports and what it spends on imports over a given period.
If a country produces highly sought-after exports, its currency will benefit purely from the extra demand created from foreign buyers seeking to purchase these goods. Therefore, a positive net Trade Balance strengthens a currency and vice versa for a negative balance.
Copper price wrapped up its upward surge temporarily after touching $5.3300, while collecting profits and settling near the previous psychological barrier of $5.000.
As the Stochastic settles below 50, the price will likely extend losses and target $4.9500, however, a renewal of the upward rush would require closing above $4.1800, sending the price to the next target at $5.4100.
Expected trading range today is between $4.9500 and $5.1300.
Today’s price forecast: Bearish
The USD/JPY pair edged lower in latest intraday trading, after the pivotal resistance of 150.95 held on, especially as the price finished a negative harmonic pattern there, the Gartley pattern, with negative signals emerging from the Stochastic after reaching overbought levels.
It comes as the price trades within an upward correctional price channel that guided recent short-term trading.