The main category of Forex News.
You can use the search box below to find what you need.
[wd_asp id=1]
The main category of Forex News.
You can use the search box below to find what you need.
[wd_asp id=1]
The precious metals may take much longer to challenge record prices set at the top of the year.
The US-Iran conflict is set to become a protracted war as leaders dig in their heels on any agreement. This week, the US rejectes an Iranian proposal to reopen the Strait of Hormuz in exchange for nuclear talk delays.
The fallout of a much longer war than expected is bound to exacerbate what the International Energy Agency has already called the largest energy supply shock on record.
This week’s US Federal Reserve rate decision also has the precious metals markets spooked that interest rates will remain in a holding pattern. Palladium was the only metal to post gains for the past week.
Let’s take a look at what’s got the precious metals moving over the past week.
Gold price news
The gold price faced headwinds from multiple directions between April 23 and Thursday (April 30).
The war in the Middle East and this week’s Fed decision were the primary factors. After trying to consolidate around the US$4,700 level, gold has retreated into the US$4,600 to US$4,650 per ounce range.
The yellow metal lost more than 1.95 percent compared to the same time last week, and remains down about 17 percent from the US$5,589.38 all-time high that it reached on January 28.
Tuesday (April 28) brought the sharpest correction for the week.
With US-Iran peace talks effectively going nowhere, the continued closure of the Strait of Hormuz has many investors accepting that central banks will likely keep interest rates higher for longer.
After ending the trading session on Monday at US$4,681.86, by early morning the next day the price of gold had fallen to a four week low of US$4,555.49. While it picked up more than US$40 by closing, gold failed to retake US$4,600.
Wednesday’s (April 29) Fed interest rate announcement brought home the realization that global energy prices are on their way up and higher interest rates will likely remain in place.
The price of gold hit its lowest point of the week, at US$4,510.62 in the morning trade.
“Jerome Powell’s comments did nothing to revive hopes of an interest rate cut this year, and there remains an 80% probability that rates will end the year within their current range, according to the CME Group (NASDAQ:CME) FedWatch Tool,” Simon-Peter Massabni, head of business development at XS.com, stated in a market commentary shared with the Investing News Network (INN). “This helped US Treasury yields strengthen their upward trend, with the yield on 10-year bonds rising to 4.43 percent, close to the highest level since July of last year, enhancing the appeal of fixed-income, yield-generating assets and posing a further threat to gold and hindering its recovery.”
Massabni also pointed to net outflows of more than US$1.1 billion from the SPDR Gold Shares ETF (ARCA:GLD), the largest gold exchange-traded fund, and meager inflows of only about US$51 million into the iShares Gold Trust ETF (ARCA:IAU) this week as factors working against gold.
By Thursday, gold had rebounded slightly to overtake the US$4,600 level, rising as high as US$4,645 in the early morning. As of 11:00 a.m. PDT on Thursday, the price of gold was trading at US$4,616.99.
Gold price chart, April 23 to April 30, 2026.
Chart via the Investing News Network.
What direction could gold take in the coming weeks? Here are the gold price’s potential near-term catalysts:
For more insight into what’s moving the gold market, check out INN’s recent interviews:
In other gold market news, in its April Commodity Market Outlook, the World Bank says that given the current geopolitical and economic environment, it sees gold prices averaging US$4,700 for 2026.
In gold-mining news, Ecuador is becoming an emerging gold mining jurisdiction in Latin America. This month, the Ecuadorian government inked a US$1.7 billion mining contract with China’s CMOC Group (OTCPL:CMCLF) to develop the Los Cangrejos gold deposit. The largest primary gold deposit in the country, once in production Los Cangrejos will be Ecuador’s third large-scale mining operation.
Silver price news
The silver price has lost more than 2.8 percent over the course of the last week, and is down nearly 40 percent from its all-time high of US$121.62 per ounce, which it set on January 29. As the white metal battles the same downward pressures as gold, silver has traded in the US$72 to US$78 range for the last seven days.
Along with the other precious metals, silver slid near the end of last week and hung in wait-and-see mode for much of Monday before slipping once again on Tuesday in anticipation that the Fed would hold rates steady.
After a close of US$77.72 on Thursday, silver had lost nearly 3 percent by the end of Friday’s session at US$75.42. Monday saw the silver price remain rangebound around the US$75 level.
However, the next day the price of silver had fallen to an intraday low of US$72.04 before a close of US$73.11. Silver tracked gold downward on Wednesday following the Fed rate announcement to as low US$70.89.
Thursday’s early morning session saw the silver price regaining ground to nearly the US$74 level; however, that didn’t last long, and by 11:00 a.m. PDT the price of silver was trading at US$73.67.

Silver price chart, April 23 to April 30, 2026.
Chart via the Investing News Network.
While silver often follows gold’s lead, it is highly sensitive to industrial data that does not typically affect gold. The metal also experiences tighter supply fundamentals, so mine supply data can also have an impact.
Here’s a look at the silver market’s potential near-term catalysts:
For more on what’s developing in the silver market, check out INN’s article on AI data center and Bitcoin-mining company Hyperscale Data (ARCA:GPUS) finalizing a supply partnership with Scottsdale Mint to expand its corporate treasury strategy beyond digital assets and into precious metals; it includes the buildout of a silver reserve program.
Interested in silver-mining stocks? Check out INN’s list: ASX Silver Stocks: 5 Biggest Companies in 2026.
In other silver market news, the World Bank expects silver to average around US$70 for 2026.
Platinum price news
The platinum price fell more than 2.1 percent over the period, and remains well off its January 2026 all-time high near US$2,924 per ounce. In line with the precious metals complex, platinum experienced a volatile downtrend.
Platinum finished last week at US$2,017.40, and has not closed above the US$2,000 level since.
The negative pressure continued on Monday as stalled US-Iran peace talks and the continued blockage of the Strait of Hormuz hyped concerns that central banks will keep interest rates higher for longer. The price of platinum dropped as low as US$1,984.60 in the early morning before a close of US$1,991.80.
Along with the broad selloff in the precious metals market, the platinum price plunged further on Tuesday morning to reach US$1,917.40, its lowest level in four weeks.
The bloodbath for platinum continued on Wednesday, with the metal falling below the US$1,900 level in the morning; it couldn’t manage to retake that level at closing, ending at US$1,884.90.
However, on Thursday platinum took a turn as traders bought the dip on tight supply and healthy industrial demand. By 11:00 a.m. PDT, the price of platinum was trading at US$1,986.90.
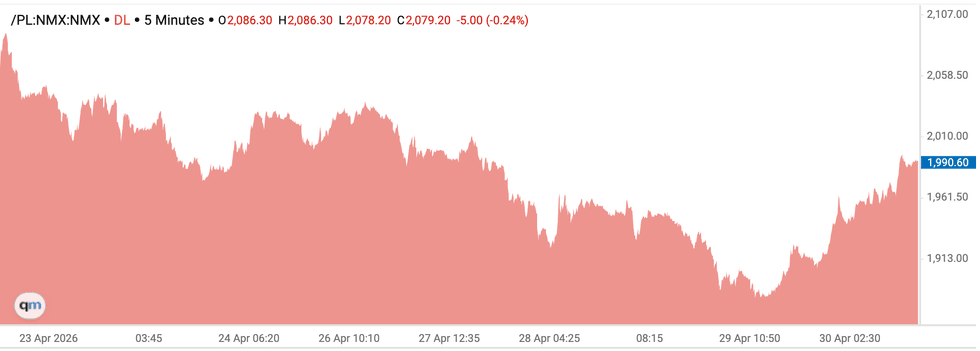
Platinum price chart, April 23 to April 30, 2026.
Chart via the Investing News Network.
As for potential near-term catalysts for platinum, a few key industry reports are on the horizon:
Palladium price news
The price of palladium faced a sharp decline late last week before mounting a V-shaped recovery on Thursday, achieving a gain of 4 percent over the course of the past week.
Palladium has performed rather well up against its precious metal peers this year. However, its price remains well below the 2022 palladium peak of around US$3,440 per ounce.
The price of palladium was trading as high as US$1,585.50 on April 23, but by the following day its value had sunk to a close of US$1,473.50 on a deep selloff in precious metals.
On Monday, palladium remained below the critical US$1,500 level for a close of US$1,478.50. Over the following two days, the metal remained rangebound between US$1,450 and US$1,490.
On Thursday, palladium bounced back above the US$1,500 level, rising as high as US$1,549 in the late morning as investors reassessed palladium supply/demand dynamics for 2026.
As of 11:00 a.m. PDT that day, the metal was trading at US$1,536.50.
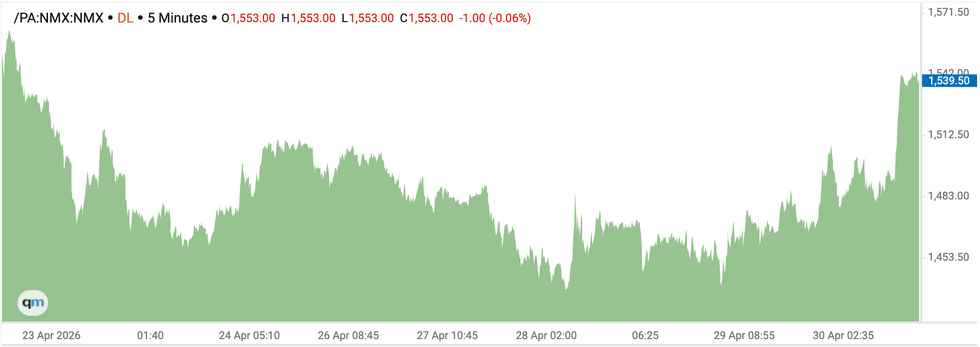
Palladium price chart, April 23 to April 30, 2026.
Chart via the Investing News Network.
Russia-based Nornickel, which controls approximately 40 percent of global palladium supply, reported that its Q1 palladium production fell by 18 percent year-on-year. The company said it expects its output to drop from 2.725 million ounces produced in 2025 to a projected range of 2.415 million to 2.465 million ounces for 2026.
Don’t forget to follow us @INN_Resource for real-time updates!
Securities Disclosure: I, Melissa Pistilli, hold no direct investment interest in any company mentioned in this article.
Editorial Disclosure: The Investing News Network does not guarantee the accuracy or thoroughness of the information reported in the interviews it conducts. The opinions expressed in these interviews do not reflect the opinions of the Investing News Network and do not constitute investment advice. All readers are encouraged to perform their own due diligence.
From Your Site Articles
Related Articles Around the Web
The USD/JPY pair builds on the previous day’s late rebound from the vicinity of mid-155.00s, or over a two-month trough, and gains some positive traction during the Asian session on Friday. Spot prices touched a daily high near the 157.55 region, though the lack of follow-through buying warrants some caution for bullish traders.
The Japanese Yen (JPY) weakens across as softer consumer inflation figures from Tokyo – Japan’s capital city – give the Bank of Japan (BoJ) reasons to pause amid economic concerns due to Middle East tensions. Apart from this, a modest US Dollar (USD) uptick turns out to be another factor offering support to the USD/JPY pair. Meanwhile, Japan’s top foreign exchange diplomat, Atsushi Mimura, reiterated that officials are in close contact with the US on currency. This keeps intervention risks in play and limits JPY losses, capping the currency pair.
From a technical perspective, Thursday’s steep intraday decline from the 160.75 area, or the highest level since July 2024, stalled near the 61.8% Fibonacci retracement level of the February-April upswing. Moreover, the USD/JPY pair, so far, has held above the 200-day Exponential Moving Average (EMA), which, in turn, keeps bearish traders on the back foot. However, a softening Relative Strength Index (RSI) near 40, alongside a negative Moving Average Convergence Divergence (MACD) reading below zero, suggests downside pressure persists.
Hence, recovery attempts are likely to face supply on further rise towards initial resistance at the 38.2% retracement near 157.48. That said, a sustained strength beyond would expose the 23.6% retracement at 158.73 and then the 160.75 cycle high.
On the downside, immediate support emerges at the 50.0% retracement near 156.47, followed by the 61.8% retracement at 155.47 and the 200-day EMA at 155.21. A clear loss of this area would open the way toward deeper Fibonacci support at 154.03 and the 152.20 swing low.
(The technical analysis of this story was written with the help of an AI tool.)
The table below shows the percentage change of Japanese Yen (JPY) against listed major currencies today. Japanese Yen was the strongest against the New Zealand Dollar.
| USD | EUR | GBP | JPY | CAD | AUD | NZD | CHF | |
|---|---|---|---|---|---|---|---|---|
| USD | 0.03% | 0.05% | 0.39% | 0.03% | 0.13% | 0.24% | 0.07% | |
| EUR | -0.03% | 0.00% | 0.37% | -0.02% | 0.11% | 0.20% | 0.04% | |
| GBP | -0.05% | -0.01% | 0.34% | 0.00% | 0.08% | 0.18% | 0.05% | |
| JPY | -0.39% | -0.37% | -0.34% | -0.36% | -0.27% | -0.18% | -0.31% | |
| CAD | -0.03% | 0.02% | 0.00% | 0.36% | 0.09% | 0.21% | 0.05% | |
| AUD | -0.13% | -0.11% | -0.08% | 0.27% | -0.09% | 0.11% | -0.02% | |
| NZD | -0.24% | -0.20% | -0.18% | 0.18% | -0.21% | -0.11% | -0.15% | |
| CHF | -0.07% | -0.04% | -0.05% | 0.31% | -0.05% | 0.02% | 0.15% |
The heat map shows percentage changes of major currencies against each other. The base currency is picked from the left column, while the quote currency is picked from the top row. For example, if you pick the Japanese Yen from the left column and move along the horizontal line to the US Dollar, the percentage change displayed in the box will represent JPY (base)/USD (quote).
BitcoinWorld
EUR/GBP Price Forecast: Bearish Hesitation Above 0.8655 Signals Persistent Downside Risk
The EUR/GBP price forecast reveals a market stuck in hesitation above the 0.8655 support level. Despite this pause, bears retain firm control over the pair. This technical standoff raises critical questions for traders monitoring the Euro and Pound Sterling. Understanding the forces behind this stalemate is essential for navigating the current landscape.
The EUR/GBP price forecast hinges on the 0.8655 mark. This level has acted as a floor since early December. However, repeated tests show weakness. The pair struggles to hold gains above this point. Each bounce lacks momentum. This pattern signals seller dominance.
Bears push the price down quickly after any minor rally. The 0.8655 level now faces increasing pressure. A break below this support would confirm the bearish outlook. Such a move could target the next floor near 0.8600. The current hesitation does not indicate strength. It reflects a market waiting for a catalyst.
For the EUR/GBP bearish outlook to change, bulls must reclaim 0.8700. This level now acts as strong resistance. The 20-day moving average sits near 0.8685. It adds another barrier to upside moves. The 50-day moving average at 0.8725 reinforces the bearish structure.
Traders watch these levels closely. A failure to break above 0.8700 keeps the pressure on. The EUR/GBP price forecast suggests more downside if resistance holds. Volume analysis supports this view. Selling volume increases on dips. Buying volume remains weak on rallies.
The Relative Strength Index (RSI) stays below 50. This reading confirms bearish momentum. The Moving Average Convergence Divergence (MACD) sits below its signal line. Both indicators align with the EUR/GBP bearish outlook. They show no signs of a reversal yet.
The stochastic oscillator recently entered oversold territory. This condition could trigger a short-term bounce. However, such bounces typically fail in strong downtrends. The EUR/GBP price forecast warns against chasing these moves. Wait for confirmation before entering long positions.
Fundamental factors support the EUR/GBP bearish outlook. The Bank of England (BoE) maintains a hawkish stance. It keeps interest rates higher for longer. This policy supports the Pound. In contrast, the European Central Bank (ECB) signals potential rate cuts. This divergence weighs on the Euro.
Economic data reinforces this gap. UK inflation remains sticky. UK services PMI stays above 50. Eurozone data shows slower growth. German industrial production contracts. These trends favor the Pound over the Euro.
The EUR/GBP price forecast reflects this fundamental reality. The market prices in a weaker Euro outlook. Any ECB dovish comment could accelerate the decline. Traders should monitor central bank speeches closely.
Risk sentiment also affects the EUR/GBP bearish outlook. The Euro often suffers during risk-off periods. Recent geopolitical tensions increase safe-haven demand for the Pound. This dynamic adds to the pair’s downside pressure.
Brexit-related headlines occasionally cause volatility. However, their impact has diminished. The market now focuses on monetary policy divergence. The EUR/GBP price forecast will likely follow this trend for weeks.
Develop a clear strategy based on the EUR/GBP price forecast. Short positions offer the best risk-reward ratio. Enter near resistance levels around 0.8680-0.8700. Place stops above 0.8725. Target the 0.8600 area for initial profits.
Consider these key points for your trading plan:
A break below 0.8655 triggers additional selling. This move could accelerate the decline. The EUR/GBP price forecast supports a bearish bias until key resistance breaks.
Risk management remains crucial. The EUR/GBP bearish outlook includes potential for sharp reversals. News events can trigger sudden moves. Keep position sizes small. Use trailing stops to protect profits.
Avoid adding to losing positions. The market may consolidate before breaking lower. Patience pays in this environment. Wait for clear signals before acting. The EUR/GBP price forecast does not guarantee immediate movement.
The EUR/GBP bearish outlook contrasts with other Euro pairs. EUR/USD shows more range-bound behavior. EUR/JPY benefits from Yen weakness. This comparison highlights the Pound’s relative strength.
Traders can use this information for pair selection. Focus on EUR/GBP for directional bearish trades. Other pairs may offer different opportunities. The EUR/GBP price forecast provides a clear bearish signal not seen elsewhere.
The 0.8655 level has historical significance. It acted as resistance in August 2022. It later became support in March 2023. The price respected this level multiple times. This history adds weight to its importance.
A break below 0.8655 would mark a major shift. It would open the door to levels not seen since 2022. The EUR/GBP price forecast considers this possibility. Traders should prepare for such a scenario.
Market analysts share a cautious view. Most expect the EUR/GBP bearish outlook to persist. They cite the interest rate differential as the main driver. The BoE-ECB policy gap will likely widen further.
Some experts note the potential for a short-term squeeze. Positioning data shows heavy short bets. A sudden reversal could trigger a sharp rally. However, this scenario remains unlikely without a catalyst. The EUR/GBP price forecast leans bearish for now.
Key events could shift the EUR/GBP price forecast. The BoE meeting in February may provide clarity. Any hints of rate cuts would weaken the Pound. The ECB meeting in March could confirm or delay cuts.
UK GDP data releases also matter. Strong growth supports the Pound. Weak data could change the outlook. Eurozone inflation figures will influence ECB decisions. Traders should mark these dates on their calendars.
The EUR/GBP price forecast highlights hesitation above 0.8655 with bears firmly in control. Technical indicators, fundamental factors, and market sentiment all point lower. A break below support could trigger significant downside. Traders should maintain a bearish bias while managing risks carefully. The pair’s direction depends on central bank policies and economic data. Stay informed and trade accordingly.
Q1: What does hesitation above 0.8655 mean for the EUR/GBP price forecast?
It means the pair struggles to move higher despite holding support. This indicates seller dominance and potential for a breakdown.
Q2: Why do bears remain in control of EUR/GBP?
Bears control the pair due to interest rate divergence. The BoE keeps rates high while the ECB signals cuts. This supports the Pound over the Euro.
Q3: What is the next key support level below 0.8655?
The next major support lies near 0.8600. A break below 0.8655 targets this level. Further downside could reach 0.8550.
Q4: How can I trade the EUR/GBP bearish outlook?
Sell near resistance at 0.8680-0.8700. Place stops above 0.8725. Target 0.8600 initially. Use proper risk management.
Q5: What could reverse the EUR/GBP price forecast?
A hawkish ECB surprise or a dovish BoE shift could reverse the outlook. Strong Eurozone data or weak UK data might also change the trend.
This post EUR/GBP Price Forecast: Bearish Hesitation Above 0.8655 Signals Persistent Downside Risk first appeared on BitcoinWorld.
– Written by
David Woodsmith
STORY LINK Pound Sterling to Dollar Forecast: GBP Below 1.35 After Fed Holds Rates
The Pound to Dollar exchange rate (GBP/USD) has edged lower to around 1.3485 after the Federal Reserve held interest rates steady, with markets reacting to a cautious tone and ongoing uncertainty surrounding the Iran situation.
Sterling struggled to hold recent highs near 1.36 as the dollar found modest support following a split policy signal from the Fed, while investors remain wary over whether GBP/USD can sustain upside momentum amid lingering geopolitical and economic risks.
The Pound to Dollar (GBP/USD) exchange rate found support close to 1.3460 on Tuesday and moved back to the 1.3500 area with caution ahead of key central bank meetings and an on-going focus on energy prices.
Scotiabank commented; “We remain neutral absent a break of the local range roughly bound between 1.3450 and the mid/ upper-1.35s.
Nevertheless, the bank added; “The recent widening of UK-US spreads is extending and threatening fresh highs, offering fundamental support to the GBP. The longer-term trend from January 2025 remains bullish.”
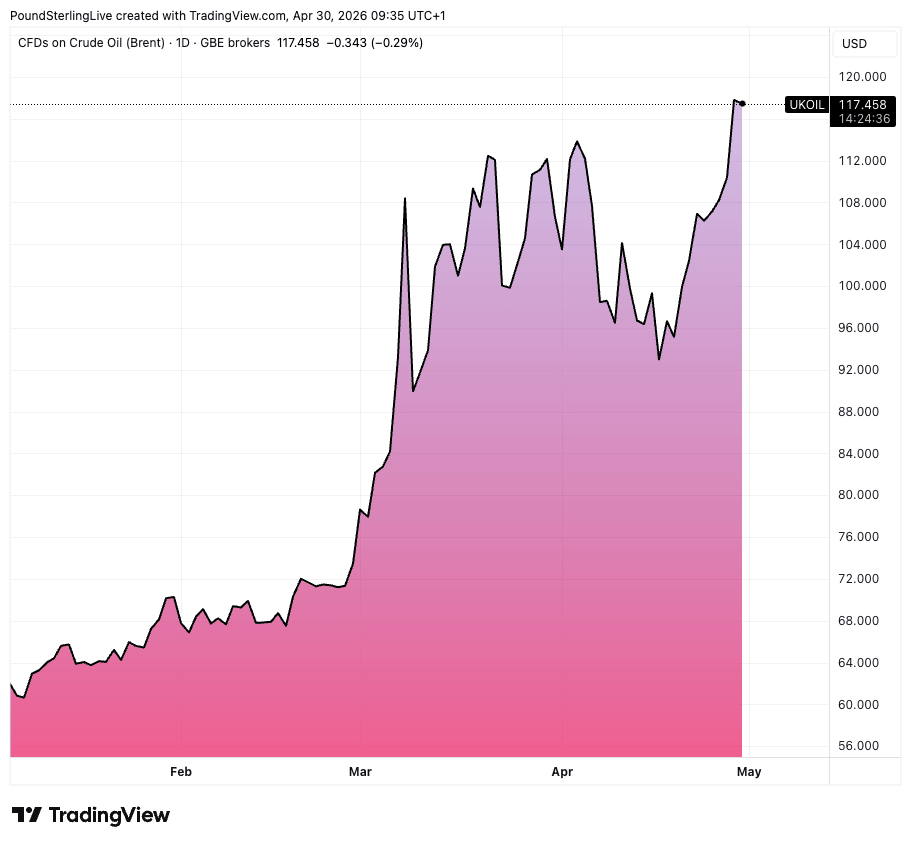
There has been further upward pressure on oil prices with Brent hitting 3-week highs near $107 p/b. There has been no headway in re-opening the Strait of Hormuz which will have a growing impact in squeezing global supply as inventories continue to decline.
Get better rates and lower fees on your next international money transfer.
Compare TorFX with top UK banks in seconds and see how much you could save.
Higher energy prices will tend to hamper GBP/USD.
The Federal Reserve will announce the latest policy decision on Wednesday. There are very strong expectations that interest rates will be held at 3.75%.
There will be no updated economic forecasts at this meeting with the focus on the statement and Chair Powell’s comments.
ING commented; “The latest signs from the Middle East are not encouraging. While Powell’s signals may be taken with some caution, given that this should be his last press conference, the risks are that he errs on the hawkish side.”
This is Powell’s last scheduled meeting as Chair with nominee Warsh due to take charge at the next meeting, assuming that he is confirmed in time.
Powell, however, still has a position as Governor. Commonwealth Bank of Australia currency strategist Carol Kong commented; “The question is what Powell is going to do, because he still holds the governor seat until 2028.”
She added; “Powell has previously said that he will stay on if he thinks that Fed independence is under threat, so I think his decision will depend on his perception of Fed independence.”

International Money Transfer? Ask our resident FX expert a money transfer question or try John’s new, free, no-obligation personal service! ,where he helps every step of the way,
ensuring you get the best exchange rates on your currency requirements.
TAGS: Pound Dollar Forecasts
Ethereum (ETHUSD) declined in recent intraday trading, preparing to break below the key support level at $2,250, which previously acted as our price target. This comes amid the dominance of a short-term bearish corrective wave, with continued downside pressure as the price remains below EMA50, beside the emergence of bearish signals from the relative strength indicators.
Accordingly, our expectations point to a decline in Ethereum during the upcoming intraday trading, especially if it breaks below the mentioned $2,250 support level, targeting the next support at $2,175.
The USD/JPY pair builds on the previous day’s breakout momentum beyond the 160.00 psychological mark, hitting a fresh high since July 2024 on Thursday. Economic concerns stemming from Middle East tensions counter the Bank of Japan’s (BoJ) hawkish pause and continue to undermine the Japanese Yen (JPY). Adding to this, sustained US Dollar (USD) strength provided an additional boost to the currency pair. The momentum, however, runs out of steam during the early part of the European session amid speculations that Japanese authorities will step in to stem further JPY weakness.
The BoJ decided to keep its benchmark interest rate unchanged at 0.75% on Tuesday. However, the 6-3 vote split, with three BoJ board members calling for a rate hike, along with upward revision of inflation forecasts, left the door open for a June or July rate hike. The initial market reaction, however, turned out to be short-lived amid worries that Japan’s economy will come under strains in the foreseeable future due to the continued disruption of supplies through the Strait of Hormuz. In fact, shipping traffic through the strategic waterway has seen a sharp decline recently due to Iran’s restrictions on movements and the US naval blockade of Iranian ports. Furthermore, US President Donald Trump said on Wednesday that the blockade will continue till Iran agrees to a deal.
Meanwhile, Japan’s Finance Minister Satsuki Katayama said that they are moving closer to taking decisive action in the foreign exchange markets. Adding to this, Japan’s top currency diplomat, Atsushi Mimura, said that they are coordinating with the US, based on their FX agreement in September last year, prompting some intraday short-covering around the JPY. The US Dollar (USD), on the other hand, retreats from its highest level since April 13. This turns out to be another that contributed to the USD/JPY pair’s sharp intraday downfall of over 100-pips from the 160.70-160.75 region. Any meaningful USD depreciation, however, seems elusive in the wake of stalled US-Iran peace talks and the US Federal Reserve’s (Fed) hawkish tilt on Wednesday.
US President Donald Trump rejected Iran’s proposal to end the two-month conflict and reiterated that there will be no peace deal unless the Islamic Republic agrees to give up its nuclear program. Trump added that the US naval blockade of Iranian ports will continue. This remains supportive of elevated Crude Oil prices, reviving inflationary concerns. Adding to this, the Fed’s decision to hold its key policy rate unchanged at 3.50%-3.75% saw the highest number of dissents since 1992, with three policymakers voting against the accommodative tone in the policy statement. Traders were quick to react and sharply reduced their bets on any further easing by the Fed in 2026, instead they are now pricing in over a 10% chance of a rate increase, which, in turn, favors the USD bulls.
The aforementioned fundamental backdrop makes it prudent to wait for strong follow-through selling before confirming that the USD/JPY pair has topped out in the near term and positioning for any further depreciating move. Traders now look to the US economic docket, featuring the release of the Advance Q1 GDP report and the Personal Consumption Expenditures (PCE) Price Index. The crucial data will play a key role in influencing the near-term USD price dynamics and provide a fresh impetus to the USD/JPY pair later during the North American session.
The sharp intraday pullback drags spot prices to the 159.50-159.40 confluence – comprising the 38.2% Fibonacci retracement level of the recent move up from the monthly swing low and the 200-hour Simple Moving Average (SMA). Meanwhile, the Relative Strength Index (RSI) reading around 34 hints at weak demand after the latest unwind. Moreover, the Moving Average Convergence Divergence (MACD) has turned negative, reinforcing soft downside pressure.
A clean break below the 159.50-159.40 confluence would expose the 50.0% retracement at 159.15, followed by deeper Fibonacci supports at 158.79 and 158.27, before a more solid floor appears near the 157.60 region. On the topside, initial resistance is aligned at the 38.2% retracement at 159.52, with further barriers at the 23.6% retracement near 159.97 and the recent swing high around 160.70, where selling interest could re-emerge.
(The technical analysis of this story was written with the help of an AI tool.)
Ethereum (ETHUSD) declined in recent intraday trading, preparing to break below the key support level at $2,250, which previously acted as our price target. This comes amid the dominance of a short-term bearish corrective wave, with continued downside pressure as the price remains below EMA50, beside the emergence of bearish signals from the relative strength indicators.
Accordingly, our expectations point to a decline in Ethereum during the upcoming intraday trading, especially if it breaks below the mentioned $2,250 support level, targeting the next support at $2,175.
Copper price ended the last corrective decline by reaching the target at $5.8100, forming an obstacle against the negative trading, to notice its sideways fluctuation near $5.8500.
The contradiction of the main indicators might reduce the chances of forming bullish waves, specifically by forming extra barrier at $5.9700 level, while providing negative momentum by stochastic might push the price to break $5.8100 level, which forces it to suffer extra losses that might extend towards $5.7000 and $5.5900.
The expected trading range for today is between $5.7000 and $5.9100
Trend forecast: Bearish
Welcome, my fellow traders! I have prepared a price forecast for the USCrude, XAUUSD, and EURUSD using a combination of the margin zones method and technical analysis. Based on the market analysis, I suggest entry signals for intraday traders.
The euro price continues to test the key support of the short-term uptrend.
The article covers the following subjects:
Yesterday, oil extended its short-term uptrend, piercing the Gold Zone of 100.97–100.43. Today, the price has reached the Target Zone 2 of 106.90–105.82. If the asset breaks above this zone, the next buy target will be the Gold Zone 2 of 111.75–111.21.
If bears defend the Target Zone 2, a downward correction may begin. In this case, the oil price may test the support A of 101.93–101.39. Once this zone is tested, long trades can be considered.
Buy near support A of 101.93–101.39. TakeProfit: 104.39, 107.32. StopLoss: 99.99.
Yesterday, the gold price continued to fall and broke below the April 28 low. Today, the metal is undergoing a correction. During this correction, the price may test the resistance A of 4,666–4,651. Once it is tested, consider short trades, with the first target at 4,588 and the second one around 4,510.
If the price breaks above the resistance A today, the correction will continue toward the resistance B at 4,743–4,722.
Sell near resistance A at 4,666–4,651. TakeProfit: 4,588, 4,510. StopLoss: 4,700.
The euro price keeps testing the key support of the short-term uptrend at 1.1687–1.1670. So far, bulls are holding this zone. Therefore, consider holding long trades open today, targeting 1.1760. The second buy target will be the April high of 1.1849.
If the EURUSD pair settles below the support B of 1.1687–1.1670, the short-term trend will turn bearish. In this case, one may consider selling the euro on the next trading day, targeting the lower Target Zone of 1.1525–1.1492.
Hold long trades opened at support B at 1.1687–1.1670. TakeProfit: 1.1760, 1.1849. StopLoss: 1.1629.
Would you like to learn more about technical analysis methods and principles? Explore our comprehensive guide.
P.S. Did you like my article? Share it in social networks: it will be the best “thank you” 🙂
Useful links:
The content of this article reflects the author’s opinion and does not necessarily reflect the official position of LiteFinance broker. The material published on this page is provided for informational purposes only and should not be considered as the provision of investment advice for the purposes of Directive 2014/65/EU.
According to copyright law, this article is considered intellectual property, which includes a prohibition on copying and distributing it without consent.
Image © Adobe Stock
The euro-dollar exchange rate will find little support from the European Central Bank (ECB) owing to a deterioration in geopolitical sentiment and oil markets.
The ECB is expected to strike a ‘hawkish’ tone later today and hint at rate rises, which would usually benefit euro-dollar. However, ahead of the event brent crude oil prices are trading at four-year highs at $126 a barrel.
It’s reported Thursday that U.S. President Donald Trump will soon receive a briefing on new military options for action in Iran as negotiations are apparently going nowhere.
The rise in oil prices signals markets are positioning for fresh escalation and the realisation that there’s no imminent reopening of the Strait of Hormuz, the key shipping lane through which about a fifth of the world’s oil and natural gas flows.
“With the latest deterioration in market sentiment about the Middle East conflict, we don’t think the ECB will be hawkish enough to lift EUR/USD on its own,” says Francesco Pesole, FX Strategist at ING Bank. “Unless oil starts turning lower today, risks remain towards a move to 1.160.”
The U.S. President has made it clear he wants Iran to completely abandon ambitions to build a nuclear weapon, which Tehran’s leadership – now dominated by the military – refuses to do.
“The oil market has moved from ignoring headlines and hoping for resolution to fixating squarely on the physical scarcity and long-term threat to supply with the possible escalation of conflict now looming,” says Neil Wilson, UK Investor Strategist at Saxo Bank.
The Eurozone is a net importer of oil and gas, meaning its economy is particularly exposed to higher import prices. The U.S. is a net exporter of oil, and is now the primary supplier to the Eurozone.
For euro-dollar, that dynamic is a headwind.
“The higher oil climbs, the more it weighs on European assets and the EUR/USD outlook,” says Fawad Razaqzada, Market Analyst at City Index.


