The main category of Forex News.
You can use the search box below to find what you need.
[wd_asp id=1]
The main category of Forex News.
You can use the search box below to find what you need.
[wd_asp id=1]
Silver price (XAG/USD) jumps sharply to near $32.50 in Tuesday’s European session. The white metal strengthens as the US Dollar (USD) faces a sharp sell-off, with investors turning cautious over the United States (US) economic outlook due to President Donald Trump’s tariff agenda. The US Dollar Index (DXY), which tracks the Greenback’s value against six major currencies, slumps to near 103.35, the lowest level seen in four months. The lower US Dollar makes precious metals, such as Silver, more attractive to investors.
Market participants worry that tariff policies by President Trump would result in an economic slowdown in the US. On Friday, Trump said, “There is a period of transition because what we are doing is very big.” Historically, periods of transition result in economic turbulence in the short term. Signs of heightened economic tensions improve the safe-haven demand for precious metals, such as Silver.
Meanwhile, investors await the US Consumer Price Index (CPI) data for February, which will be released on Wednesday. Investors will pay close attention to the US inflation data as it will influence market speculation for the Federal Reserve’s (Fed) monetary policy outlook. The US CPI data is estimated to have grown at a slower pace. Signs of a slowdown in inflationary pressures would boost market expectations that the Fed will cut interest rates in a May policy meeting. The likelihood for the Fed to cut interest rates in May has increased to 51% from 37% a day ago, according to the CME FedWatch tool. The scenario of lower interest rates bodes well for non-yielding assets, such as Silver.
Silver price strives to revisit the key resistance of $33.40 plotted from the February 14 high. The 20-day Exponential Moving Average (EMA) near $32.07, continues to support the Silver price.
The 14-day Relative Strength Index (RSI) oscillates inside the 40.00-60.00 range, suggesting a sideways trend.
Looking down, the upward-sloping trendline from the August 8 low of $26.45 will act as key support for the Silver price around $30.00. While, the October 22 high of $34.87 will be the key barrier.
Silver is a precious metal highly traded among investors. It has been historically used as a store of value and a medium of exchange. Although less popular than Gold, traders may turn to Silver to diversify their investment portfolio, for its intrinsic value or as a potential hedge during high-inflation periods. Investors can buy physical Silver, in coins or in bars, or trade it through vehicles such as Exchange Traded Funds, which track its price on international markets.
Silver prices can move due to a wide range of factors. Geopolitical instability or fears of a deep recession can make Silver price escalate due to its safe-haven status, although to a lesser extent than Gold’s. As a yieldless asset, Silver tends to rise with lower interest rates. Its moves also depend on how the US Dollar (USD) behaves as the asset is priced in dollars (XAG/USD). A strong Dollar tends to keep the price of Silver at bay, whereas a weaker Dollar is likely to propel prices up. Other factors such as investment demand, mining supply – Silver is much more abundant than Gold – and recycling rates can also affect prices.
Silver is widely used in industry, particularly in sectors such as electronics or solar energy, as it has one of the highest electric conductivity of all metals – more than Copper and Gold. A surge in demand can increase prices, while a decline tends to lower them. Dynamics in the US, Chinese and Indian economies can also contribute to price swings: for the US and particularly China, their big industrial sectors use Silver in various processes; in India, consumers’ demand for the precious metal for jewellery also plays a key role in setting prices.
Silver prices tend to follow Gold’s moves. When Gold prices rise, Silver typically follows suit, as their status as safe-haven assets is similar. The Gold/Silver ratio, which shows the number of ounces of Silver needed to equal the value of one ounce of Gold, may help to determine the relative valuation between both metals. Some investors may consider a high ratio as an indicator that Silver is undervalued, or Gold is overvalued. On the contrary, a low ratio might suggest that Gold is undervalued relative to Silver.
The GBP/USD price analysis shows solid bullish momentum as the pound holds near recent peaks due to dollar weakness. The sterling has maintained a bullish rally since the start of March as the dollar collapsed due to US economic worries. At the same time, market participants expect the Bank of England to keep rates unchanged next week.
–Are you interested to learn more about forex options trading? Check our detailed guide-
The dollar has remained fragile amid worries about a likely US recession due to Trump’s tariffs. The US president caused market turmoil last week by implementing new tariffs and suspending some. Traders are worried that his aggressive approach will spark trade wars that will cause an economic slowdown in the US. Decreased trade between the US and its partners means local companies suffer. If this happens, other parts of the economy will decline like the labor sector and consumer spending.
At the same time, recent US data has revealed slower demand, raising expectations for Fed rate cuts this year. On Friday, data showed slower job growth and higher unemployment in February. As a result, traders expect at least three Fed rate cuts this year. The upcoming inflation report will keep shaping this outlook.
On the other hand, market participants expect the Bank of England to keep rates unchanged next week amid the recent economic recovery.
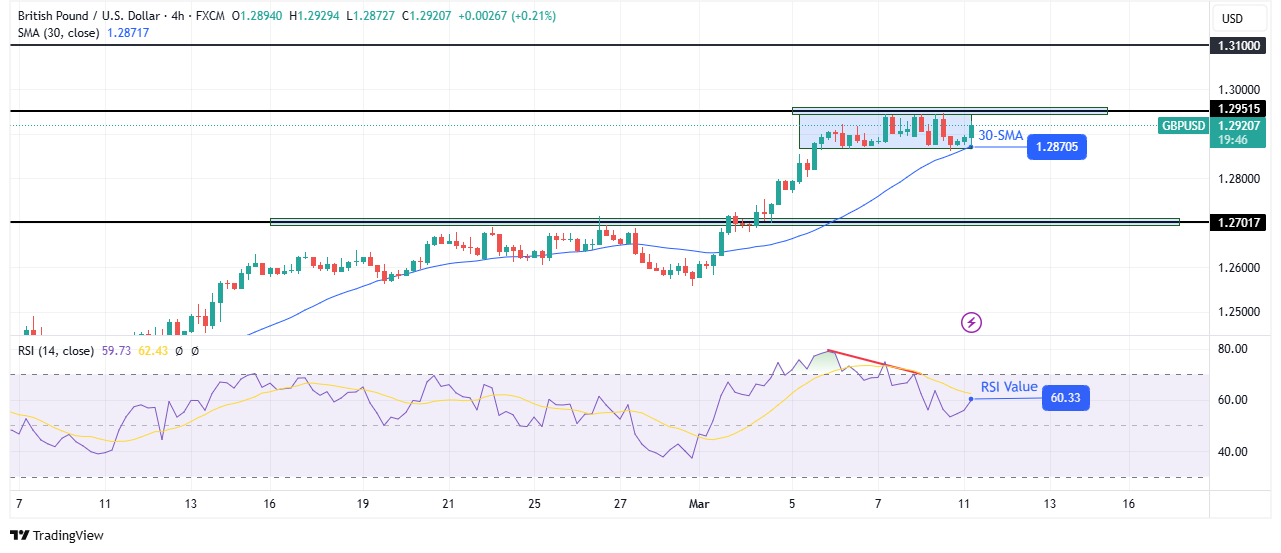
On the technical side, the GBP/USD price has met a solid hurdle at the 1.2951 level. However, the price still trades above the 30-SMA, with the RSI above 50, indicating a bullish bias. The price rose steeply after breaking above the pivotal 1.2701 resistance level.
–Are you interested to learn more about Thailand forex brokers? Check our detailed guide-
However, the rally has slowed down, and bullish momentum is fading. Price action is confined to a tight range. At the same time, the RSI has made a bearish divergence, suggesting a likely reversal. If bears are ready to take control, the price will break below the 30-SMA and fall to retest the 1.2701 support.
On the other hand, if bullish momentum remains strong, the price will soon break above the 1.2951 resistance. Such a move would clear the path to the 1.3100 key psychological level and a new high in the bullish trend.
Looking to trade forex now? Invest at eToro!
67% of retail investor accounts lose money when trading CFDs with this provider. You should consider whether you can afford to take the high risk of losing your money.
Verizon Communications’ stock price (VZ) extended its gains in the intraday levels, and confirmed the breach of the pivotal resistance of $45.36, amid the dominance of the main upward trend in the medium term, while trading alongside the secondary short-term trend line, as the stock is buoyed by trading above the 50-day SMA, coupled with positive signals from the RSI after reaching oversold levels.
Therefore we expect more gains for the stock, targeting the resistance of $50.00, provided it settles firmly above $45.36.
Trend forecast for today: Bullish
Important DisclaimersThe content provided on the website includes general news and publications, our personal analysis and opinions, and contents provided by third parties, which are intended for educational and research purposes only. It does not constitute, and should not be read as, any recommendation or advice to take any action whatsoever, including to make any investment or buy any product. When making any financial decision, you should perform your own due diligence checks, apply your own discretion and consult your competent advisors. The content of the website is not personally directed to you, and we does not take into account your financial situation or needs.The information contained in this website is not necessarily provided in real-time nor is it necessarily accurate. Prices provided herein may be provided by market makers and not by exchanges.Any trading or other financial decision you make shall be at your full responsibility, and you must not rely on any information provided through the website. FX Empire does not provide any warranty regarding any of the information contained in the website, and shall bear no responsibility for any trading losses you might incur as a result of using any information contained in the website.The website may include advertisements and other promotional contents, and FX Empire may receive compensation from third parties in connection with the content. FX Empire does not endorse any third party or recommends using any third party’s services, and does not assume responsibility for your use of any such third party’s website or services.FX Empire and its employees, officers, subsidiaries and associates, are not liable nor shall they be held liable for any loss or damage resulting from your use of the website or reliance on the information provided on this website.Risk DisclaimersThis website includes information about cryptocurrencies, contracts for difference (CFDs) and other financial instruments, and about brokers, exchanges and other entities trading in such instruments. Both cryptocurrencies and CFDs are complex instruments and come with a high risk of losing money. You should carefully consider whether you understand how these instruments work and whether you can afford to take the high risk of losing your money.FX Empire encourages you to perform your own research before making any investment decision, and to avoid investing in any financial instrument which you do not fully understand how it works and what are the risks involved.
Natural gas price formed temporary correctional bearish wave by crawling towards 4.450$, affected by stochastic stability below 80 level, while that won’t affect the previously suggested bullish scenario due to the main stability within the bullish channel.
Also, 4.180 level forming additional support line confirms keeping the bullish attempts, to keep waiting to gather the positive momentum soon to assist to resume achieving gains, to expect moving towards 4.630$ and 4.670$ levels.
The expected trading range for today is between 4.350$ and 4.630$
Trend forecast: Bullish
EUR/USD gains traction and trades at its highest level since early November near 1.0900 in the European morning on Tuesday. The pair’s overbought conditions and the risk-averse market atmosphere could cause buyers to refrain from betting on another steady leg higher in the near term.
The table below shows the percentage change of Euro (EUR) against listed major currencies last 7 days. Euro was the strongest against the US Dollar.
| USD | EUR | GBP | JPY | CAD | AUD | NZD | CHF | |
|---|---|---|---|---|---|---|---|---|
| USD | -3.86% | -1.78% | -1.54% | -0.65% | -1.10% | -1.58% | -1.85% | |
| EUR | 3.86% | 2.15% | 2.42% | 3.34% | 2.87% | 2.37% | 2.07% | |
| GBP | 1.78% | -2.15% | 0.27% | 1.15% | 0.69% | 0.22% | -0.08% | |
| JPY | 1.54% | -2.42% | -0.27% | 0.90% | 0.44% | -0.05% | -0.32% | |
| CAD | 0.65% | -3.34% | -1.15% | -0.90% | -0.46% | -0.93% | -1.22% | |
| AUD | 1.10% | -2.87% | -0.69% | -0.44% | 0.46% | -0.48% | -0.78% | |
| NZD | 1.58% | -2.37% | -0.22% | 0.05% | 0.93% | 0.48% | -0.28% | |
| CHF | 1.85% | -2.07% | 0.08% | 0.32% | 1.22% | 0.78% | 0.28% |
The heat map shows percentage changes of major currencies against each other. The base currency is picked from the left column, while the quote currency is picked from the top row. For example, if you pick the Euro from the left column and move along the horizontal line to the US Dollar, the percentage change displayed in the box will represent EUR (base)/USD (quote).
Major equity indexes in the US started the week under immense bearish pressure amid growing fears over the US economy tipping into recession.
When asked whether his policies could weigh on the economic activity in an interview over the weekend, US President Donald Trump acknowledged that there will be a “period of transition.” On Monday, the Nasdaq Composite fell 3.8%, the S&P 500 lost 2.7% and the Dow Jones Industrial Average declined more than 2%. Reflecting the intense flight to safety, the CBOE Volatility Index (VIX), also known as Wall Street’s fear gauge, rose about 20% on the day.
The US economic calendar will feature NFIB Business Optimism Index for February and JOLTS Job Openings data for January. A significant decline in the business sentiment data could weigh on the US Dollar (USD) with the immediate reaction. On Wednesday, the US Bureau of Labor Statistics will publish the Consumer Price Index (CPI) data for February, which could trigger the next big action in EUR/USD.
The Relative Strength Index (RSI) indicator on the 4-hour chart rose above 70, suggesting that EUR/USD turned technically overbought, once again, after a short-lasting correction. In case the pair holds above 1.0900 (static level, round level) and confirms this level as support, 1.0940 (static level) could be seen as next resistance before 1.1000 (psychological level, static level).
On the downside, 1.0840 (20-period Simple Moving Average (SMA)) aligns as interim support before 1.0800 (static level, round level) and 1.0730 (200-day SMA).
The Euro is the currency for the 19 European Union countries that belong to the Eurozone. It is the second most heavily traded currency in the world behind the US Dollar. In 2022, it accounted for 31% of all foreign exchange transactions, with an average daily turnover of over $2.2 trillion a day. EUR/USD is the most heavily traded currency pair in the world, accounting for an estimated 30% off all transactions, followed by EUR/JPY (4%), EUR/GBP (3%) and EUR/AUD (2%).
The European Central Bank (ECB) in Frankfurt, Germany, is the reserve bank for the Eurozone. The ECB sets interest rates and manages monetary policy. The ECB’s primary mandate is to maintain price stability, which means either controlling inflation or stimulating growth. Its primary tool is the raising or lowering of interest rates. Relatively high interest rates – or the expectation of higher rates – will usually benefit the Euro and vice versa. The ECB Governing Council makes monetary policy decisions at meetings held eight times a year. Decisions are made by heads of the Eurozone national banks and six permanent members, including the President of the ECB, Christine Lagarde.
Eurozone inflation data, measured by the Harmonized Index of Consumer Prices (HICP), is an important econometric for the Euro. If inflation rises more than expected, especially if above the ECB’s 2% target, it obliges the ECB to raise interest rates to bring it back under control. Relatively high interest rates compared to its counterparts will usually benefit the Euro, as it makes the region more attractive as a place for global investors to park their money.
Data releases gauge the health of the economy and can impact on the Euro. Indicators such as GDP, Manufacturing and Services PMIs, employment, and consumer sentiment surveys can all influence the direction of the single currency. A strong economy is good for the Euro. Not only does it attract more foreign investment but it may encourage the ECB to put up interest rates, which will directly strengthen the Euro. Otherwise, if economic data is weak, the Euro is likely to fall. Economic data for the four largest economies in the euro area (Germany, France, Italy and Spain) are especially significant, as they account for 75% of the Eurozone’s economy.
Another significant data release for the Euro is the Trade Balance. This indicator measures the difference between what a country earns from its exports and what it spends on imports over a given period. If a country produces highly sought after exports then its currency will gain in value purely from the extra demand created from foreign buyers seeking to purchase these goods. Therefore, a positive net Trade Balance strengthens a currency and vice versa for a negative balance.
No news for copper price that continues to provide sideways trades within the bullish channel due to the continuous contradiction between the major indicators, to notice its consolidation near 4.6100$ now.
We will keep our bullish overview that depends on the stability of the additional support line at 4.5400$ to manage to form bullish waves and target 4.6800$ level, followed by reaching 4.8100$ barrier, while breaking the additional support and holding below it will force the price to activate the correctional decline to target the bullish channel’s support line at 4.4150$.
The expected trading range for today is between 4.5500$ and 4.6800$
Trend forecast: Bullish
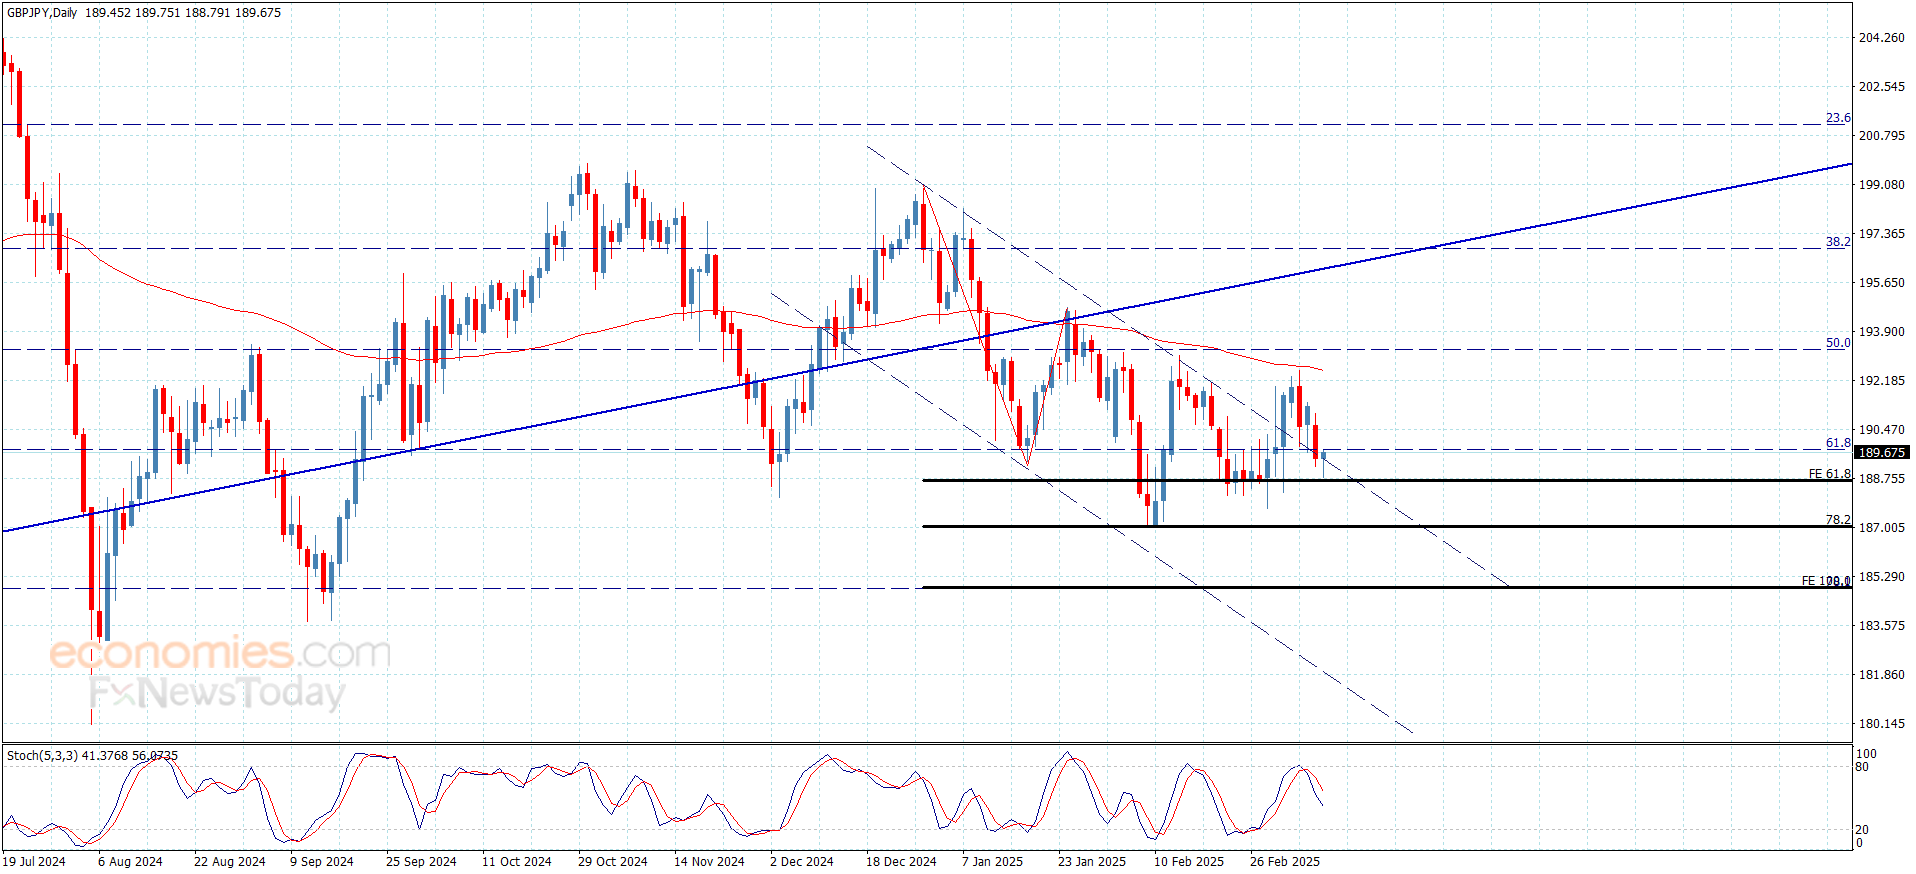
Despite facing strong negative pressures yesterday, the GBPJPY pair stability above the additional support line at 188.50 forms major factor to reinforce the domination of the previously suggested bullish bias, to notice rallying towards 189.70 now.
We assure the importance of providing positive close above 189.70 level to open the way to form strong bullish waves and target 190.65 followed by reaching 192.00 levels, while declining below 188.50 and providing negative close below it will push the price to back to the negative track to suffer big losses that might start at 187.10.
The expected trading range for today is between 188.50 and 190.65
Trend forecast: Bullish
Silver (XAG/USD) reverses an Asian session dip to the $31.85-$31.80 region, or a four-day low, and climbs to a fresh daily high in the last hour. The white metal currently trades around the $32.15-$32.20 area, up nearly 0.20% for the day, and for now, seems to have snapped a three-day losing streak.
However, mixed technical indicators on the daily chart warrant some caution for bullish traders and positioning for a further appreciating move. Hence, any subsequent move up could face stiff resistance and remain capped near the $32.65-$32.70 region. The said hurdle might now act as a key pivotal point, which if cleared decisively could allow the XAG/USD to reclaim the $33.00 mark and climb further towards the February monthly swing high around the $33.40 area.
Some follow-through buying should pave the way for additional gains towards the next relevant hurdle near the $33.60-$33.70 area. The XAG/USD might then surpass the $34.00 round figure and extend the momentum further towards the $34.50-$34.55 resistance zone before aiming to challenge the multi-year high, closer to the $35.00 psychological mark touched in October 2024.
On the flip side, the Asian session low, around the $31.85-$31.80 region, could offer some support, below which the XAG/USD could slide to the $31.25-$31.20 area. The downward trajectory might eventually drag the XAG/USD to the 100-day Exponential Moving Average (EMA) pivotal support, currently pegged near the $31.10-$31.00 region. This is followed by the late February low, around the $30.80 area, which if broken might shift the bias in favor of bearish traders.
The subsequent downfall has the potential to drag the XAG/USD towards the $30.00 psychological mark en route to the $29.55-$29.50 support and sub-$29.00 levels, or the year-to-date low touched in January.
Silver is a precious metal highly traded among investors. It has been historically used as a store of value and a medium of exchange. Although less popular than Gold, traders may turn to Silver to diversify their investment portfolio, for its intrinsic value or as a potential hedge during high-inflation periods. Investors can buy physical Silver, in coins or in bars, or trade it through vehicles such as Exchange Traded Funds, which track its price on international markets.
Silver prices can move due to a wide range of factors. Geopolitical instability or fears of a deep recession can make Silver price escalate due to its safe-haven status, although to a lesser extent than Gold’s. As a yieldless asset, Silver tends to rise with lower interest rates. Its moves also depend on how the US Dollar (USD) behaves as the asset is priced in dollars (XAG/USD). A strong Dollar tends to keep the price of Silver at bay, whereas a weaker Dollar is likely to propel prices up. Other factors such as investment demand, mining supply – Silver is much more abundant than Gold – and recycling rates can also affect prices.
Silver is widely used in industry, particularly in sectors such as electronics or solar energy, as it has one of the highest electric conductivity of all metals – more than Copper and Gold. A surge in demand can increase prices, while a decline tends to lower them. Dynamics in the US, Chinese and Indian economies can also contribute to price swings: for the US and particularly China, their big industrial sectors use Silver in various processes; in India, consumers’ demand for the precious metal for jewellery also plays a key role in setting prices.
Silver prices tend to follow Gold’s moves. When Gold prices rise, Silver typically follows suit, as their status as safe-haven assets is similar. The Gold/Silver ratio, which shows the number of ounces of Silver needed to equal the value of one ounce of Gold, may help to determine the relative valuation between both metals. Some investors may consider a high ratio as an indicator that Silver is undervalued, or Gold is overvalued. On the contrary, a low ratio might suggest that Gold is undervalued relative to Silver.
Despite facing strong negative pressures yesterday, the GBPJPY pair stability above the additional support line at 188.50 forms major factor to reinforce the domination of the previously suggested bullish bias, to notice rallying towards 189.70 now.
We assure the importance of providing positive close above 189.70 level to open the way to form strong bullish waves and target 190.65 followed by reaching 192.00 levels, while declining below 188.50 and providing negative close below it will push the price to back to the negative track to suffer big losses that might start at 187.10.
The expected trading range for today is between 188.50 and 190.65
Trend forecast: Bullish