The main category of Forex News.
You can use the search box below to find what you need.
[wd_asp id=1]
The main category of Forex News.
You can use the search box below to find what you need.
[wd_asp id=1]
EUR/USD gathered bullish momentum and climbed above 1.0500 on Thursday, as the US Dollar (USD) came under heavy selling pressure. The pair holds steady at around 1.0500 in the European morning on Friday as investors await preliminary February Purchasing Managers’ Index (PMI) data.
The table below shows the percentage change of Euro (EUR) against listed major currencies this week. Euro was the strongest against the Canadian Dollar.
| USD | EUR | GBP | JPY | CAD | AUD | NZD | CHF | |
|---|---|---|---|---|---|---|---|---|
| USD | -0.05% | -0.68% | -1.07% | 0.06% | -0.61% | -0.72% | -0.14% | |
| EUR | 0.05% | -0.48% | -1.03% | 0.21% | -0.47% | -0.57% | 0.01% | |
| GBP | 0.68% | 0.48% | -0.46% | 0.70% | 0.06% | -0.09% | 0.49% | |
| JPY | 1.07% | 1.03% | 0.46% | 1.13% | 0.48% | 0.55% | 0.89% | |
| CAD | -0.06% | -0.21% | -0.70% | -1.13% | -0.65% | -0.79% | -0.21% | |
| AUD | 0.61% | 0.47% | -0.06% | -0.48% | 0.65% | -0.09% | 0.49% | |
| NZD | 0.72% | 0.57% | 0.09% | -0.55% | 0.79% | 0.09% | 0.58% | |
| CHF | 0.14% | -0.01% | -0.49% | -0.89% | 0.21% | -0.49% | -0.58% |
The heat map shows percentage changes of major currencies against each other. The base currency is picked from the left column, while the quote currency is picked from the top row. For example, if you pick the Euro from the left column and move along the horizontal line to the US Dollar, the percentage change displayed in the box will represent EUR (base)/USD (quote).
The USD Index, which tracks the USD’s valuation against a basket of six major currencies, declined sharply on Thursday. The US Department of Labor reported that the weekly Initial Jobless Claims rose to 219,000 from 214,000. Moreover, the benchmark 10-year US Treasury bond yield dropped below 4.5%, further weighing on the USD.
HCOB Composite PMI in Germany and the Eurozone are both forecast to come in above 50 in February’s flash estimate and show an ongoing expansion in the private sector’s business activity. In case one of these PMIs drop into the contraction territory below 50, the Euro could have a hard time finding demand.
In the second half of the day, S&P Global will publish the Manufacturing and Services PMI reports for the US. If the Services PMI comes in above the market expectation of 53, the USD could gather strength with the immediate reaction.
It’s worth mentioning that Germany is preparing for a general election to the Bundestag, the lower house of its parliament, on February 23. Investors could opt to book their profits toward the end of the European session and trigger a leg lower in EUR/USD.
The Relative Strength Index (RSI) indicator on the 4-hour chart holds above 60, suggesting that the bullish bias remains intact. On the upside, 1.0500-1.0510 (round level, Fibonacci 78.6% retracement of the latest downtrend) aligns as the first resistance area before 1.0550 (static level) and 1.0600 (beginning point of the downtrend).
In case EUR/USD fails to stabilize above 1.0500-1.0510, buyers could hesitate. In this scenario, supports could be seen at 1.0440 (Fibonacci 61.8% retracement), 1.0390-1.0400 (100-period Simple Moving Average (SMA), 50-day SMA, Fibonacci 50% retracement of the latest downtrend) and 1.0375 (200-period SMA).
The Euro is the currency for the 19 European Union countries that belong to the Eurozone. It is the second most heavily traded currency in the world behind the US Dollar. In 2022, it accounted for 31% of all foreign exchange transactions, with an average daily turnover of over $2.2 trillion a day. EUR/USD is the most heavily traded currency pair in the world, accounting for an estimated 30% off all transactions, followed by EUR/JPY (4%), EUR/GBP (3%) and EUR/AUD (2%).
The European Central Bank (ECB) in Frankfurt, Germany, is the reserve bank for the Eurozone. The ECB sets interest rates and manages monetary policy. The ECB’s primary mandate is to maintain price stability, which means either controlling inflation or stimulating growth. Its primary tool is the raising or lowering of interest rates. Relatively high interest rates – or the expectation of higher rates – will usually benefit the Euro and vice versa. The ECB Governing Council makes monetary policy decisions at meetings held eight times a year. Decisions are made by heads of the Eurozone national banks and six permanent members, including the President of the ECB, Christine Lagarde.
Eurozone inflation data, measured by the Harmonized Index of Consumer Prices (HICP), is an important econometric for the Euro. If inflation rises more than expected, especially if above the ECB’s 2% target, it obliges the ECB to raise interest rates to bring it back under control. Relatively high interest rates compared to its counterparts will usually benefit the Euro, as it makes the region more attractive as a place for global investors to park their money.
Data releases gauge the health of the economy and can impact on the Euro. Indicators such as GDP, Manufacturing and Services PMIs, employment, and consumer sentiment surveys can all influence the direction of the single currency. A strong economy is good for the Euro. Not only does it attract more foreign investment but it may encourage the ECB to put up interest rates, which will directly strengthen the Euro. Otherwise, if economic data is weak, the Euro is likely to fall. Economic data for the four largest economies in the euro area (Germany, France, Italy and Spain) are especially significant, as they account for 75% of the Eurozone’s economy.
Another significant data release for the Euro is the Trade Balance. This indicator measures the difference between what a country earns from its exports and what it spends on imports over a given period. If a country produces highly sought after exports then its currency will gain in value purely from the extra demand created from foreign buyers seeking to purchase these goods. Therefore, a positive net Trade Balance strengthens a currency and vice versa for a negative balance.
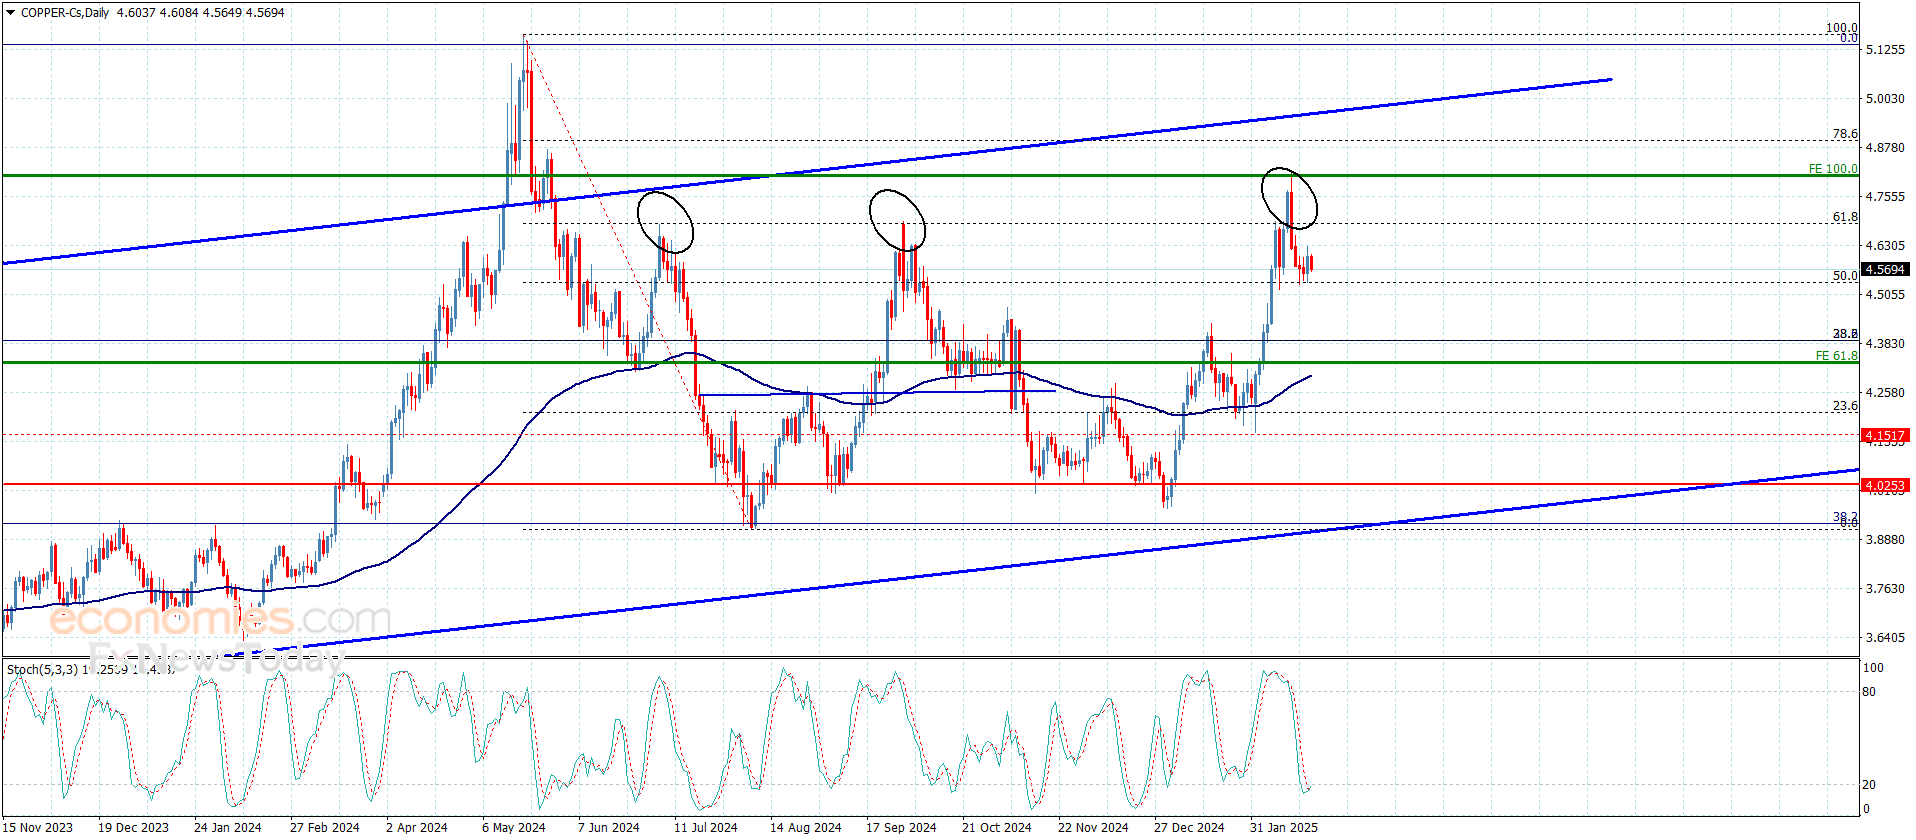
Copper price attempted to face the negative pressures by fluctuating above the initial support 4.5300$, while the continuous contradiction between the major indicators pushes the price to provide new sideways trades to keep its stability below 4.6800$ barrier.
We expect to continue providing sideways trades, noting that stochastic continuous negative momentum might assist to decline below the current support and suffer additional losses by reaching 4.4600$.
The expected trading range for today is between 4.4600$ and 4.6200$
Trend forecast: Bearish
Despite platinum price attempt to face the negative pressures, the frequent consolidation below 983.00$ will increase the chances of activating the correctional bearish track on the near-term basis, to expect suffering more losses by crawling towards 950.00$
On the other hand, succeeding to jump above 983.00$ and providing positive close will allow the price to form some bullish waves, to achieve more gains by rallying towards 1000.00$ followed by reaching 61.8% Fibonacci correction level at 1017.00$.
The expected trading range for today is between 950.00$ and 983.00$
Trend forecast: Bearish
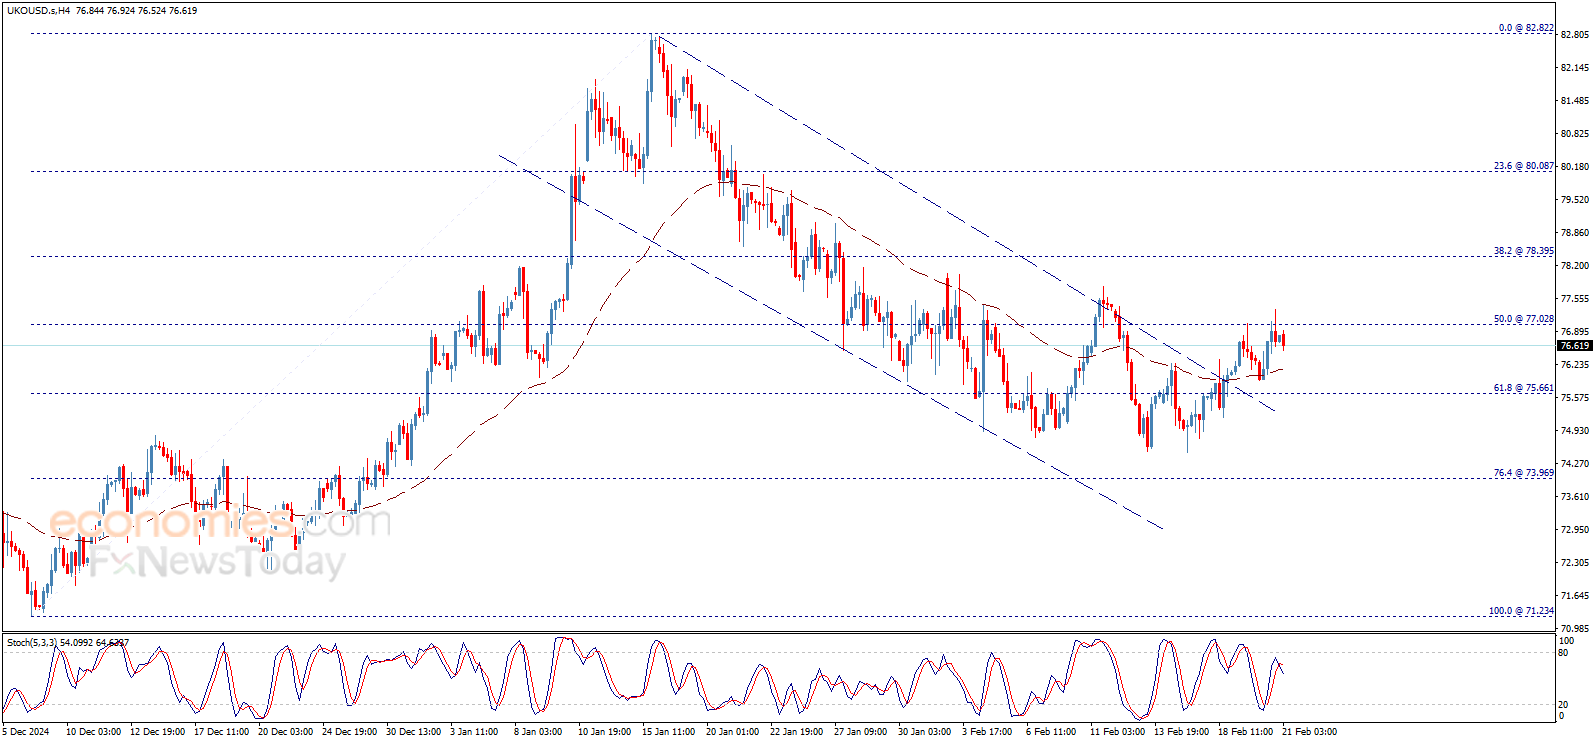
Crude oil price continued to rise yesterday to reach 72.65$ areas, noting that holding above 72.30$ supports the chances of continuing the rise in the upcoming sessions, by when we take a deeper look at the chart, we find that the recent trades are confined within rising wedge pattern that its support line meets 72.30$, which means that breaking this level will push the price to return to the bearish track again.
For more: please follow us on Telegram channel.
Despite platinum price attempt to face the negative pressures, the frequent consolidation below 983.00$ will increase the chances of activating the correctional bearish track on the near-term basis, to expect suffering more losses by crawling towards 950.00$
On the other hand, succeeding to jump above 983.00$ and providing positive close will allow the price to form some bullish waves, to achieve more gains by rallying towards 1000.00$ followed by reaching 61.8% Fibonacci correction level at 1017.00$.
The expected trading range for today is between 950.00$ and 983.00$
Trend forecast: Bearish
Gold price is on a corrective move lower from near record highs of $2,955 set on Thursday. Despite the pullback, Gold price remains on track to book the eighth consecutive weekly gain.
The latest leg down in Gold price could be attributed to profit-taking as traders reposition ahead of the first critical economic data release from the United States (US) this week – the S&P Global Preliminary business PMIs.
The data could help markets refocus on the US Federal Reserve’s (Fed) outlook on interest rate cuts after the Minutes of the January policy meeting failed to alter their expectations of two rate reductions this year.
The Minutes backed the Fed cautious stance on Wednesday as it showed that “many participants noted that the committee could hold the policy rate at a restrictive level if the economy remained strong and inflation remained elevated” in the face of Trump’s trade policies.
Persistent expectations that the Fed will likely deliver two rate cuts in 2025 continue to underpin the sentiment around the non-yielding Gold price.
That said, any adverse reaction to the strong PMI data on Gold price could be short-lived if fresh developments surrounding US President Donald Trump’s tariff plans hit the wires and strengthen the safe-haven demand for the traditional store of value – Gold.
The recent tariff talks by Trump and geopolitical tensions around Russia-Ukraine peace deal have supported the record rally in Gold price.
However, the bright metal could extend its correction from lifetime highs if traders cash in on their longs ahead of next week’s US Personal Consumption Expenditures (PCE) inflation data release.
All in all, any dip in Gold price will likely be seen as a good buying opportunity in the near term.
Gold price turns lower after failing to find acceptance above the $2,950 psychological mark on a daily candlestick closing basis.
But the 14-day Relative Strength Index (RSI) returns to the bullish zone, currently near 69.75, suggesting a ‘buy-the-dips’ trade in the Gold price.
A sustained break above the $2,950 barrier could resume the record rally. The next relevant resistances are seen at $2,970 and the $3,000 key figure.
Conversely, a fresh pullback could call for a test of the $2,900 round level, below which the February 14 low of $2,877 will be threatened.
A firm break of that level will initiate a fresh downside toward the $2,850 psychological barrier.
The S&P Global Manufacturing Purchasing Managers Index (PMI), released on a monthly basis, is a leading indicator gauging business activity in the US manufacturing sector. The data is derived from surveys of senior executives at private-sector companies from the manufacturing sector. Survey responses reflect the change, if any, in the current month compared to the previous month and can anticipate changing trends in official data series such as Gross Domestic Product (GDP), industrial production, employment and inflation. A reading above 50 indicates that the manufacturing economy is generally expanding, a bullish sign for the US Dollar (USD). Meanwhile, a reading below 50 signals that activity in the manufacturing sector is generally declining, which is seen as bearish for USD.
Next release: Fri Feb 21, 2025 14:45 (Prel)
Frequency: Monthly
Consensus: 51.5
Previous: 51.2
Source: S&P Global
Oracle Corporation’s stock price (ORCL) rose in the intraday levels, amid the dominance of the main upward trend in the medium term, with the stock trading alongside the secondary short-term trend line, with positive signals from the RSI despite reaching overbought levels, coupled with positive pressure due to trading above the 50-day SMA.
Therefore we expect more gains for the stock, provided it settles firmly above $170.70, targeting the pivotal resistance of $198.30.
Trend forecast for today: Bullish
Gold price returns to provide positive trades after the decline that it witnessed in the previous sessions, and according to the trading rules inside the channel, the price is on its way to build new bullish wave on the intraday basis, supported by the EMA50 that carries the price from below, besides the positive signal provided by stochastic now.
For more: please follow us on Telegram channel.
Oracle Corporation’s stock price (ORCL) rose in the intraday levels, amid the dominance of the main upward trend in the medium term, with the stock trading alongside the secondary short-term trend line, with positive signals from the RSI despite reaching overbought levels, coupled with positive pressure due to trading above the 50-day SMA.
Therefore we expect more gains for the stock, provided it settles firmly above $170.70, targeting the pivotal resistance of $198.30.
Trend forecast for today: Bullish
Today’s high has the potential to retain the downtrend price structure with a lower swing high. A drop below today’s low of $72.09 will establish a new lower swing high and retain the integrity of the downtrend that began from the $80.76 swing high. The downtrend remains in place unless there is a sustained rally above the February 11 interim swing high at $72.64.
However, if today’s high establishes a new lower swing high and it is subsequently broken to the upside, that could provide an early signal for a bullish change in trend. Nonetheless, a rally above today’s high prior to establishing a new lower swing high puts crude oil in a position to challenge the $72.64 swing high. Subsequently, if a $72.64 bull breakout triggers, the 200-Day MA at $74.49 becomes the next higher price target.
Alternatively, the bearish correction continues to lower price targets, starting with the 78.6% retracement at $70.03. There is also a range of prior consolidation that represents potential support below the current retracement low at $70.52. Reaching the 78.6% retracement level could signal the completion of the decline. Notice that crude oil has been trading near trend lows recently and it has been showing signs of consolidation. In other words, bearish momentum has diminished.
That could be the end of it but if not the $68.82 interim swing low marks a lower price target. A drop below Wednesday’s low of $72.07 shows weakness that could lead to lower prices if the breakdown is sustained. It may be easier to recognize on the weekly chart (not shown).
For a look at all of today’s economic events, check out our economic calendar.