The main category of Forex News.
You can use the search box below to find what you need.
[wd_asp id=1]
The main category of Forex News.
You can use the search box below to find what you need.
[wd_asp id=1]
Will we finally get some follow through from the US dollar, and how might it affect the EURUSD, GBPUSD, and USDJPY?
Get the latest in today’s Weekly Forex Forecast.
The DXY broke down last week after retesting the September trend line near 109.50 on February 3.
Some follow-through is a welcome sight, even if it wasn’t the move I expected.
Thursday’s session closed below a key trend line from the November 22 high, which is now resistance near 107.20.
Next week, I’ll be watching the 106.00 support area closely, given its significance on the quarterly time frame since January 2023.
This area could extend to 105.70, with the October 2023 trend line support just below at 105.00.
Despite last week’s breakdown, I expect market conditions to stay relatively tight, given the current level of uncertainty.
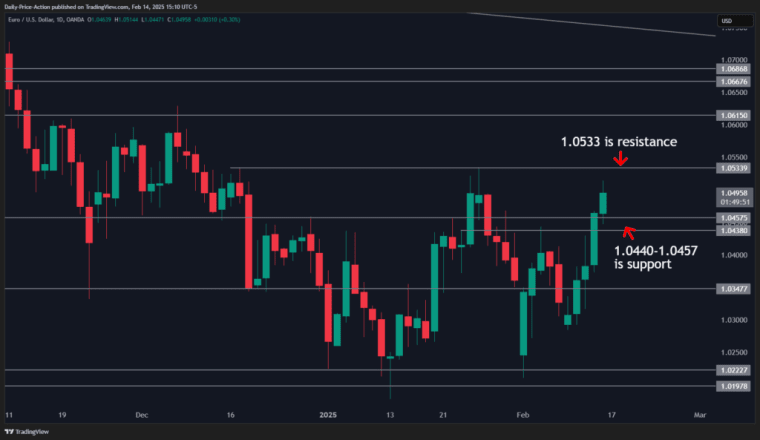
EURUSD staged a comeback last week after gapping down on Monday.
It started with a daily close above 1.0350 and gained momentum with Thursday’s break above 1.0457.
The pair faces resistance next week at 1.0533, with a break there opening the door to 1.0615.
One thing to note about the recent EURUSD downtrend is that we never saw a backtest of the 1.0660 region following the November breakdown.
There are several key levels in that area, along with a fair value gap at 1.0687 that could come into play later this month.
Key support next week is between 1.0440 and 1.0457.
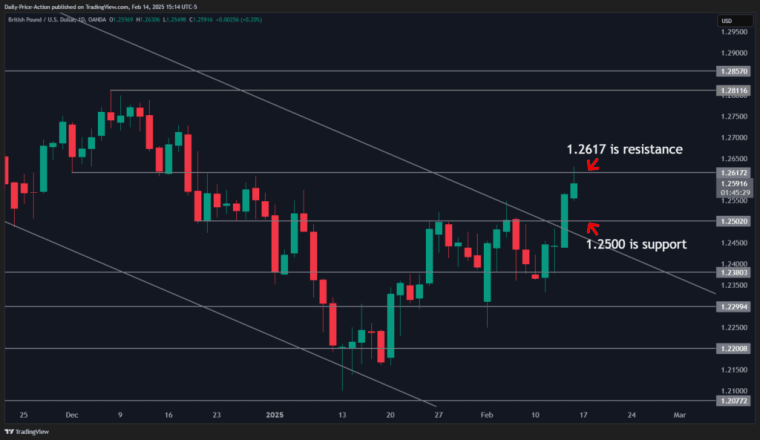
GBPUSD tested key resistance at 1.2617 on Friday, a pivot from the December 2 low.
This followed Thursday’s breakout above the 1.2500 resistance level.
While we could see some consolidation early next week, a sustained break above 1.2617 would expose the 1.2800 highs.
Like EURUSD, there’s an untested area on the GBPUSD chart at 1.2850.
That level marked a significant breakdown in November and could act as a magnet later this month.
Key support next week is 1.2500.
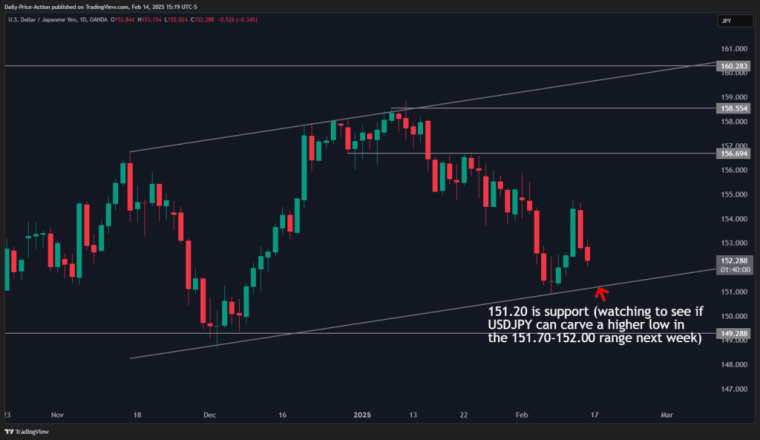
USDJPY had a volatile week, nearly round-tripping its rally from 151.36 to 154.80.
Despite the pullback between Thursday and Friday, the pair could find a local bottom early next week if it carves out a higher low.
An ascending channel has developed, with support at 151.20 next week.
Additionally, the Japanese yen looks subdued following last week’s breakout, so a USDJPY bottom may depend on whether the US dollar finds support next week.
This isn’t a trade I want to rush into, but I’ll be watching for a potential higher low around 152.00.
Super Mario Computer’s stock price (SMCI) rallied in the intraday levels, buoyed by trading above the 50-day SMA, amid the dominance of the upward correctional wave in the short term. However, despite the stock’s gains, it’s still moving alongside the main downward trend line in the medium-term, with negative signals from the RSI after reaching overbought levels.
Therefore we stand neutral until the stock moves on the pivotal resistance of $51.00, and in case of a breach, it’ll open the door for more gains, thus targeting the resistance of $74.00.
Trend forecast for today: Neutral
Recently, the US president surprised observers by saying he would impose tariffs on countries that impose sales taxes such as value-added tax, which includes Britain. He argued that the idea of VAT is ridiculous and confirms an agenda of punishing everyone, whether allies or enemies, to increase revenue for the United States. The random approach creates a great deal of uncertainty in the financial markets as it becomes difficult to predict where tariffs will fall and to what extent. This makes it difficult for other countries to respond.
Overall, it has become clear that forex markets are losing interest fast: the US dollar fell 1 percent last week and is heading for its fourth weekly decline in 2025. According to market experts, the law of diminishing returns appears to be at play as headlines about tariffs seem less provocative to the forex market. Overall, the pound is facing the threat of an expanded US tariff regime aimed at addressing stifling corporate rules that affect US companies. We reported that Howard Lutnick, the incoming US Commerce Secretary, will seek to impose tariffs on countries with onerous environmental, social and governance rules, which he says penalize US companies.
Now, Trump believes that VAT also punishes American companies. He told reporters at the White House, “We’re going to call it a tariff.”
Britain has imposed VAT since 1973 when it joined what would later become the European Union. For its part, the United States has pledged to deal with “each country individually. In almost all cases, they charge us much higher tariffs than we charge them but those days are over.” For its part, the American Taxpayer Foundation, a right-wing think tank, said last Thursday that VAT is “not a tariff” and is “commercially neutral.” “Historical evidence and recent studies show that tariffs are taxes that raise prices and reduce the quantities of goods and services available to American businesses and consumers, leading to lower incomes, reduced employment, and lower economic output.”

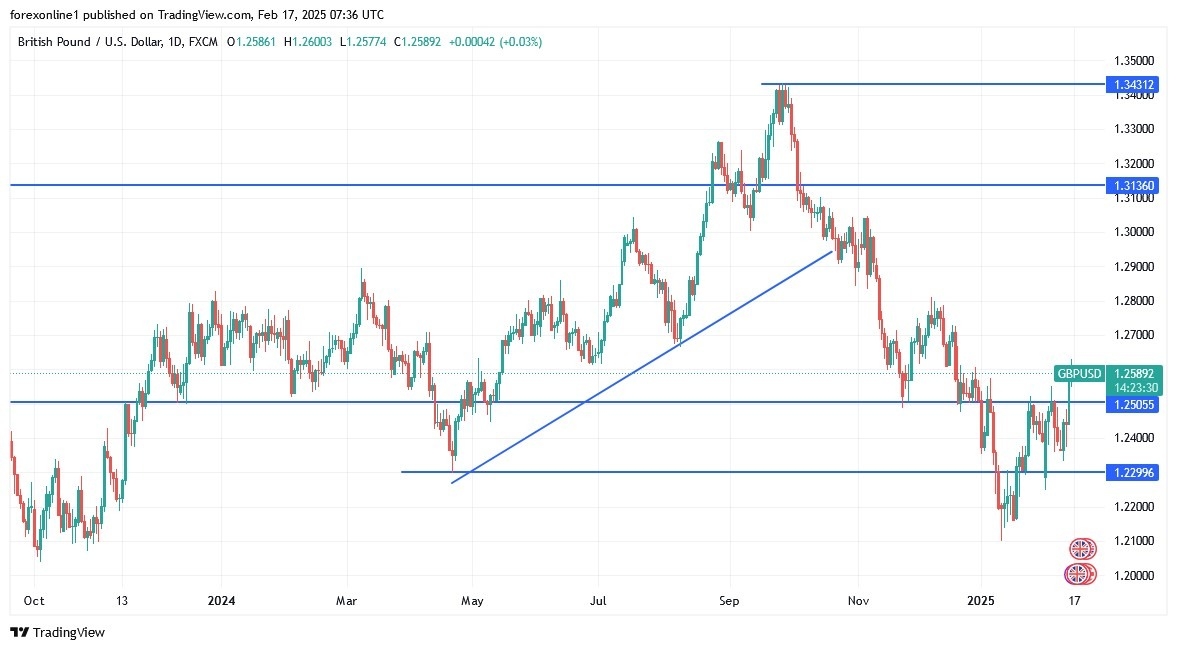
We still recommend selling the GBP/USD from any upward level but without risking the trading account from any sudden price reversals by activating take-profit and stop-loss orders.
Trump says his reciprocal tariffs are aimed at restoring balance to global trade dynamics in favour of the United States. Analysts point out that Britain already has a balanced trade in goods with the United States, which would technically make Britain a low-priority target for Trump. But targeting VAT, he says, is not about global trade but about exercising American economic power and increasing revenue. On this basis, Britain will not escape by virtue of its favourable trade balance.
Keep in mind that the GBP/USD pair may remain relatively around its recent gains until the financial markets and investors react to the US and UK economic releases led by the announcement of the minutes of the last US Federal Reserve meeting. The success of the bulls in moving towards the resistance levels of 1.2670 and 1.2800 strengthens the ascending channel forming on the daily chart above, which may eventually lead to a move towards the psychological resistance of 1.3000. Conversely, and in the same time frame, the bears broke the support level of 1.2380, threatening the current upward rebound and a return to the broader bearish path.
Ready to trade our daily GBP/USD Forex forecast? Here’s some of the best forex broker UK reviews to check out.
Gold price is back on the bids early Monday, reversing a part of Friday’s profit-taking decline. The further upside in Gold price depends on the upcoming US-Russia talks and developments around US President Donald Trump’s tariff plans amid a US holiday-led thin market conditions.
Having registered eight straight weeks of gains, Gold price kicks off a fresh week on a positive note, underpinned by the sustained weakness in the US Dollar (USD) and the US Treasury bond yields.
Markets remain expectant that the Russia-Ukraine conflict could end soon as US President Donald Trump is scheduled to hold a meeting with Russian President Vladimir Putin in Saudi Arabia on Tuesday.
Prospects of diminishing geopolitical risks weigh on the USD, supporting the renewed upswing in Gold price. The Greenback also suffers from the increase in revival of bets surrounding two interest rate cuts by the US Federal Reserve (Fed) this year, following Friday’s dismal Retail Sales data.
Data showed that Retail Sales declined 0.9% over the month in January, compared to the estimated drop of 0.1%. This marked the biggest month-on-month (MoM) decrease since early 2023, rekindling expectations for two rate Fed cuts in 2025.
Discouraging triggered a fresh sell-off in the US Treasury bond yields across the curve, in turn, smashing the US Dollar despite some weakness in Wall Street indices on Friday. Gold price, however, failed to capitalize on US data-led USD weakness as markets resorted to profit-taking on their Gold longs after the record run.
Traders also preferred to cash in on the Gold price record rally ahead of the upcoming US-Russia meeting and the Minutes of the Fed’s January meeting.
At the moment, Gold price also derives strength from tensions around a looming tariff war between the US and the European Union (EU). “The European Commission would explore tough import limits on certain foods made to different standards to protect its farmers, echoing US President Donald Trump’s reciprocal trade policy,” the Financial Times (FT) reported on Sunday.
It’s worth mentioning that Gold price could be subject to intense volatility in the day ahead as a US national holiday will likely exaggerate moves. Speeches will from Fed officials Christopher Waller, Patrick Harker and Michelle Bowman will be closely scrutinized before Wednesday’s Fed Minutes.
The daily chart shows that Gold price defended the rising trendline support, then at $2,885.
The 14-day Relative Strength Index (RSI) has eased from the overbought territory to trade in the bullish zone, currently near 69.
If the rebound gathers strength, Gold buyers will aim for the record high of $2,943. Ahead of that, the February 12 high of $2,909 could test bearish commitments.
The next relevant resistance is seen at the $2,970 round level.
Should sellers crack the February low of $2,864 decisively, a fresh downside could initiate toward the $2,850 psychological barrier.
Further south, the 21-day Simple Moving Average (SMA) at $2,822 could come into play.
Gold has played a key role in human’s history as it has been widely used as a store of value and medium of exchange. Currently, apart from its shine and usage for jewelry, the precious metal is widely seen as a safe-haven asset, meaning that it is considered a good investment during turbulent times. Gold is also widely seen as a hedge against inflation and against depreciating currencies as it doesn’t rely on any specific issuer or government.
Central banks are the biggest Gold holders. In their aim to support their currencies in turbulent times, central banks tend to diversify their reserves and buy Gold to improve the perceived strength of the economy and the currency. High Gold reserves can be a source of trust for a country’s solvency. Central banks added 1,136 tonnes of Gold worth around $70 billion to their reserves in 2022, according to data from the World Gold Council. This is the highest yearly purchase since records began. Central banks from emerging economies such as China, India and Turkey are quickly increasing their Gold reserves.
Gold has an inverse correlation with the US Dollar and US Treasuries, which are both major reserve and safe-haven assets. When the Dollar depreciates, Gold tends to rise, enabling investors and central banks to diversify their assets in turbulent times. Gold is also inversely correlated with risk assets. A rally in the stock market tends to weaken Gold price, while sell-offs in riskier markets tend to favor the precious metal.
The price can move due to a wide range of factors. Geopolitical instability or fears of a deep recession can quickly make Gold price escalate due to its safe-haven status. As a yield-less asset, Gold tends to rise with lower interest rates, while higher cost of money usually weighs down on the yellow metal. Still, most moves depend on how the US Dollar (USD) behaves as the asset is priced in dollars (XAU/USD). A strong Dollar tends to keep the price of Gold controlled, whereas a weaker Dollar is likely to push Gold prices up.
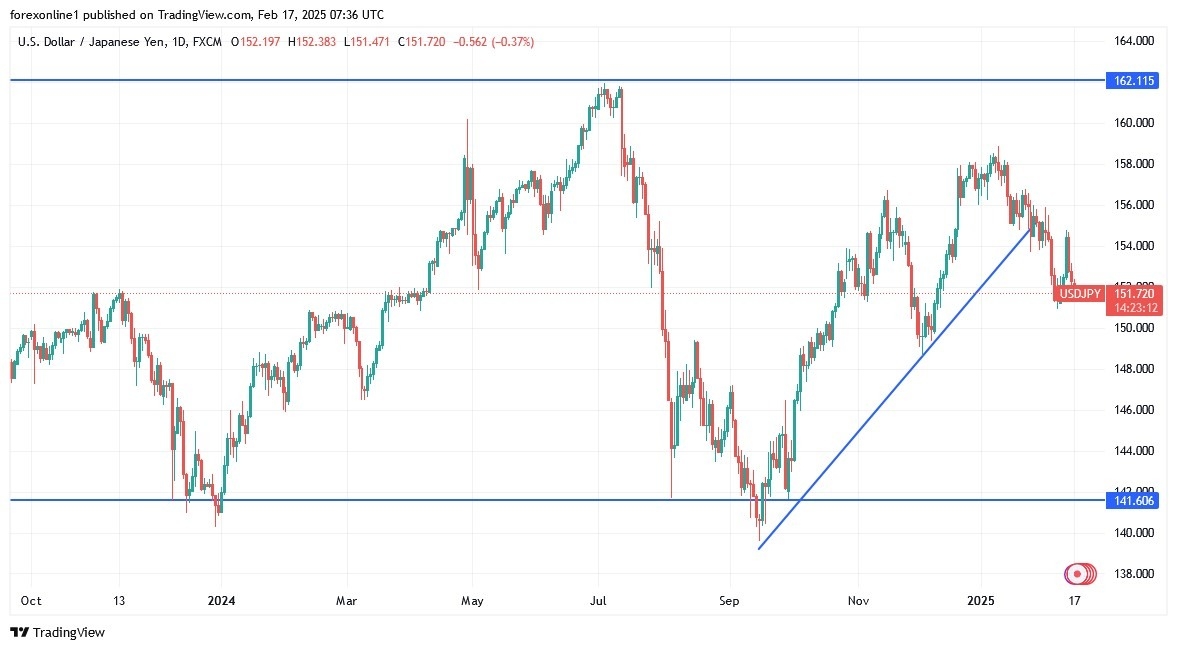
Overall, the positive numbers reinforced the hawkish expectations for the Bank of Japan’s monetary policy. While uncertainty remains about whether the Bank of Japan will raise interest rates again in March, a rate hike later in the year is widely expected. The Japanese Yen has also gained strength from the recent weakness of the US dollar, driven by weak US economic data and easing fears of a global trade war.
We still recommend buying the US Dollar against the Japanese Yen but without risking the trading account from any sudden price reversals by activating take-profit and stop-loss orders.
Since President Donald Trump took office, Wall Street stock markets have been guessing “whether or not he will do it” regarding tariffs, since he promised to impose comprehensive duties on both geopolitical allies and competitors alike. While the initial reaction in the stock market was cautious, the mood is changing as the administration’s policies become increasingly confused with delays and exemptions mixed with aggressive rhetoric.
For stock investors, they have ignored the concerns and bought stocks. While the risk of a global trade war remains dangerously real after Trump announced a 25% tariff on steel and aluminium imports that will take effect in March and reciprocal tariffs on many trading partners expected to be imposed in April, US stock indices continue to rise, with the S&P 500 ending last week just points away from its all-time high. The question now is whether the buyers driving these gains are adequately assessing what Trump will do – or are recklessly throwing caution to the wind.
According to the daily chart, the bears are trying to move the USD/JPY currency pair with stronger downward levels, and now the psychological support level of 150.00 is the most important for further control, and at the same time, technical indicators will move towards strong oversold levels, led by the direction of the Relative Strength Index and the Stochastic Oscillator. I still recommend buying the USD/JPY from any downward level. Conversely, on the same timeframe, the bulls will successfully break the downward trend if the pair rebounds above the resistance of 155.50 again. The reaction to the content of the minutes of the latest meeting of the US Federal Reserve and any new developments regarding US trade wars, as well as signals from central bank officials, will affect the performance of the dollar against the Japanese Yen.
Want to trade our USD/JPY forex analysis and predictions? Here’s a list of forex brokers in Japan to check out.
In its latest short term energy outlook (STEO), which was released on February 11, the U.S. Energy Information Administration (EIA) increased its Henry Hub spot price forecast for 2025 and 2026.
According to its February STEO, the EIA now sees the Henry Hub spot price averaging $3.79 per million British thermal units (MMBtu) in 2025 and $4.16 per MMBtu in 2026. The EIA’s previous STEO, which was released in January, saw the Henry Hub spot price averaging $3.14 per MMBtu in 2025 and $3.97 per MMBtu in 2026.
The EIA projected in its latest STEO that the Henry Hub spot price will come in at $3.70 per MMBtu in the first quarter of this year, $3.39 per MMBtu in the second quarter, $3.95 per MMBtu in the third quarter, $4.11 per MMBtu in the fourth quarter, $4.26 per MMBtu in the first quarter of next year, $3.81 per MMBtu in the second quarter, $4.21 per MMBtu in the third quarter, and $4.35 per MMBtu in the fourth quarter.
In its previous STEO, the EIA projected that the Henry Hub spot price would average $3.21 per MMBtu in the first quarter of 2025, $2.59 per MMBtu in the second quarter, $3.18 per MMBtu in the third quarter, $3.59 per MMBtu in the fourth quarter, $4.03 per MMBtu in the first quarter of 2026, $3.63 per MMBtu in the second quarter, $4.06 per MMBtu in the third quarter, and $4.17 per MMBtu in the fourth quarter.
The EIA noted in its February STEO that the Henry Hub spot price averaged $4.13 per MMBtu in January. It highlighted that this was up more than $1.00 from the December average of $3.01 per MMBtu.
“The above-average withdrawals from underground natural gas storage in January caused prices to rise,” the EIA said in its latest STEO.
“The Henry Hub spot price reached a high of $9.86 per MMBtu on January 17 ahead of a cold snap that was expected to affect much of the United States over the mid-month holiday weekend,” it added.
“The 37 percent uptick in the monthly average Henry Hub price in January from December, combined with our forecast of below-average storage inventories through the end of 2025, increased the annual average 2025 price in our forecast by around 65 cents compared with our January Short-Term Energy Outlook,” it continued.
In its February STEO, the EIA warned that weather is always a risk to its Henry Hub price forecast during the winter heating season.
“An additional risk over the forecast period includes timing of new liquefied natural gas production that developers expect to start up over the next two years,” the EIA added.
“We expect China’s imposition of tariffs on U.S. LNG to have a limited effect on U.S. LNG exports. With ample demand for LNG globally, we expect that any LNG not purchased by China would be imported elsewhere,” it continued.
A report sent to Rigzone by Standard Chartered Bank Commodities Research Head Paul Horsnell on February 11 showed that Standard Chartered expected the nearby future NYMEX basis Henry Hub U.S. natural gas price to average $3.20 per MMBtu in the first quarter of 2025, $3.50 per MMBtu across the second and third quarters, and $2.80 per MMBtu in the fourth quarter. The company saw the commodity averaging $3.30 per MMBtu overall in 2026, the report showed.
In a BMI report sent to Rigzone by the Fitch Group on February 10, BMI, a unit of Fitch Solutions, projected that the Henry Hub price will average $3.4 per MMBtu in 2025 and $3.8 per MMBtu in 2026. A Bloomberg consensus included in the report forecast that the Henry Hub price will average $3.4 per MMBtu this year and $3.7 per MMBtu in 2026.
A research note sent to Rigzone by the JPM Commodities Research team on February 7 showed that J.P. Morgan saw the U.S. natural gas henry hub price averaging $3.50 per MMBtu in 2025 and $3.94 per MMBtu in 2026.
To contact the author, email andreas.exarheas@rigzone.com
EUR/USD trades in a relatively tight channel below 1.0500 to begin the new week. Financial markets in the US will remain closed in observance of the Presidents’ Day holiday on Monday, limiting the volatility in the second half of the day.
The table below shows the percentage change of Euro (EUR) against listed major currencies last 7 days. Euro was the strongest against the Japanese Yen.
| USD | EUR | GBP | JPY | CAD | AUD | NZD | CHF | |
|---|---|---|---|---|---|---|---|---|
| USD | -1.41% | -1.53% | 0.32% | -0.71% | -1.36% | -1.24% | -0.99% | |
| EUR | 1.41% | -0.06% | 1.86% | 0.82% | 0.05% | 0.25% | 0.50% | |
| GBP | 1.53% | 0.06% | 1.76% | 0.84% | 0.10% | 0.32% | 0.54% | |
| JPY | -0.32% | -1.86% | -1.76% | -1.07% | -1.61% | -1.55% | -1.30% | |
| CAD | 0.71% | -0.82% | -0.84% | 1.07% | -0.62% | -0.56% | -0.33% | |
| AUD | 1.36% | -0.05% | -0.10% | 1.61% | 0.62% | 0.21% | 0.44% | |
| NZD | 1.24% | -0.25% | -0.32% | 1.55% | 0.56% | -0.21% | 0.23% | |
| CHF | 0.99% | -0.50% | -0.54% | 1.30% | 0.33% | -0.44% | -0.23% |
The heat map shows percentage changes of major currencies against each other. The base currency is picked from the left column, while the quote currency is picked from the top row. For example, if you pick the Euro from the left column and move along the horizontal line to the US Dollar, the percentage change displayed in the box will represent EUR (base)/USD (quote).
The persistent selling pressure surrounding the US Dollar (USD) helped EUR/USD post strong gains in the previous week. Easing fears over an aggressive trade policy by US President Donald Trump helped the market mood improve and weighed on the USD. Ahead of the weekend, the data from the US showed that Retail Sales in the US declined by 0.9% on a monthly basis in January, not allowing the USD to stage a rebound.
The economic calendar will not feature any high-tier data releases in the first half of the week. On Wednesday, the Federal Reserve (Fed) will publish the minutes of its January policy meeting.
In the meantime, market participants will pay close attention to developments surrounding the Trump administration’s trade policy with the EU.
European Trade Commissioner Maros Sefcovic will travel to Washington on Monday to meet with US counterparts to discuss US tariffs.
The Relative Strength Index (RSI) indicator on the 4-hour chart declines from the 80 mark it touched on Friday but holds above 60, suggesting that EUR/USD remains bullish after correcting from overbought levels.
On the downside, 1.0440 (Fibonacci 61.8% retracement of the latest downtrend) aligns as first support before 1.0400 (100-period Simple Moving Average (SMA), Fibonacci 50% retracement) and 1.0360 (200-period SMA).
Looking north, first resistance could be spotted at 1.0500-1.0510 (round level, Fibonacci 78.6% retracement) ahead of 1.0550 (static level) and 1.0600 (static level, beginning point of the downtrend).
The Euro is the currency for the 19 European Union countries that belong to the Eurozone. It is the second most heavily traded currency in the world behind the US Dollar. In 2022, it accounted for 31% of all foreign exchange transactions, with an average daily turnover of over $2.2 trillion a day. EUR/USD is the most heavily traded currency pair in the world, accounting for an estimated 30% off all transactions, followed by EUR/JPY (4%), EUR/GBP (3%) and EUR/AUD (2%).
The European Central Bank (ECB) in Frankfurt, Germany, is the reserve bank for the Eurozone. The ECB sets interest rates and manages monetary policy. The ECB’s primary mandate is to maintain price stability, which means either controlling inflation or stimulating growth. Its primary tool is the raising or lowering of interest rates. Relatively high interest rates – or the expectation of higher rates – will usually benefit the Euro and vice versa. The ECB Governing Council makes monetary policy decisions at meetings held eight times a year. Decisions are made by heads of the Eurozone national banks and six permanent members, including the President of the ECB, Christine Lagarde.
Eurozone inflation data, measured by the Harmonized Index of Consumer Prices (HICP), is an important econometric for the Euro. If inflation rises more than expected, especially if above the ECB’s 2% target, it obliges the ECB to raise interest rates to bring it back under control. Relatively high interest rates compared to its counterparts will usually benefit the Euro, as it makes the region more attractive as a place for global investors to park their money.
Data releases gauge the health of the economy and can impact on the Euro. Indicators such as GDP, Manufacturing and Services PMIs, employment, and consumer sentiment surveys can all influence the direction of the single currency. A strong economy is good for the Euro. Not only does it attract more foreign investment but it may encourage the ECB to put up interest rates, which will directly strengthen the Euro. Otherwise, if economic data is weak, the Euro is likely to fall. Economic data for the four largest economies in the euro area (Germany, France, Italy and Spain) are especially significant, as they account for 75% of the Eurozone’s economy.
Another significant data release for the Euro is the Trade Balance. This indicator measures the difference between what a country earns from its exports and what it spends on imports over a given period. If a country produces highly sought after exports then its currency will gain in value purely from the extra demand created from foreign buyers seeking to purchase these goods. Therefore, a positive net Trade Balance strengthens a currency and vice versa for a negative balance.
Natural gas price started to activate the bearish track after providing negative closings below 3.820$ resistance line to notice crawling towards the first negative target at 3.620$.
Now, stochastic exit from the overbought areas allows us to expect gathering the additional negative momentum to confirm its preparation to provide new bearish waves and target 3.520$ level, while regaining the bullish bias requires forming strong bullish rally and settle above the mentioned resistance.
The expected trading range for today is between 3.520$ and 3.690$
Trend forecast: Bearish
Copper price failed to resume the bullish attack after facing 4.8100$ barrier, to activate the correctional track by crawling towards 4.6200$ now.
The frequent stability below the mentioned barrier and stochastic attempt to provide the negative momentum support the domination of the correctional bias, to expect crawling towards 4.5600$ and 4.5200$ levels soon, while breaching the barrier will open the way to record new gains that might start at 4.8900$.
The expected trading range for today is between 4.5600$ and 4.7400$
Trend forecast: Bearish
Silver price (XAG/USD) recovers its recent losses registered in the previous session, trading near $32.40 per troy ounce during Monday’s Asian session. A daily chart analysis suggests a continued bullish trend, as the metal price moves upward within an ascending channel.
The XAG/USD pair continues to trade above the nine-day and 14-day Exponential Moving Averages (EMAs), indicating robust short-term momentum. Moreover, the 14-day Relative Strength Index (RSI) remains above the 50 level, reinforcing the overall bullish outlook.
Silver price may face initial resistance near the upper boundary of the ascending channel at the $33.10 level, followed by the four-month high of $33.40, which was reached on February 14.
On the downside, support is located at the nine-day EMA around $32.08, followed by the 14-day EMA at $31.85, and the lower boundary of the ascending channel at $31.60. A break below this critical support zone could undermine the bullish outlook, potentially exposing the XAG/USD pair to further declines toward its five-month low of $28.74, which was recorded on December 19.
Silver is a precious metal highly traded among investors. It has been historically used as a store of value and a medium of exchange. Although less popular than Gold, traders may turn to Silver to diversify their investment portfolio, for its intrinsic value or as a potential hedge during high-inflation periods. Investors can buy physical Silver, in coins or in bars, or trade it through vehicles such as Exchange Traded Funds, which track its price on international markets.
Silver prices can move due to a wide range of factors. Geopolitical instability or fears of a deep recession can make Silver price escalate due to its safe-haven status, although to a lesser extent than Gold’s. As a yieldless asset, Silver tends to rise with lower interest rates. Its moves also depend on how the US Dollar (USD) behaves as the asset is priced in dollars (XAG/USD). A strong Dollar tends to keep the price of Silver at bay, whereas a weaker Dollar is likely to propel prices up. Other factors such as investment demand, mining supply – Silver is much more abundant than Gold – and recycling rates can also affect prices.
Silver is widely used in industry, particularly in sectors such as electronics or solar energy, as it has one of the highest electric conductivity of all metals – more than Copper and Gold. A surge in demand can increase prices, while a decline tends to lower them. Dynamics in the US, Chinese and Indian economies can also contribute to price swings: for the US and particularly China, their big industrial sectors use Silver in various processes; in India, consumers’ demand for the precious metal for jewellery also plays a key role in setting prices.
Silver prices tend to follow Gold’s moves. When Gold prices rise, Silver typically follows suit, as their status as safe-haven assets is similar. The Gold/Silver ratio, which shows the number of ounces of Silver needed to equal the value of one ounce of Gold, may help to determine the relative valuation between both metals. Some investors may consider a high ratio as an indicator that Silver is undervalued, or Gold is overvalued. On the contrary, a low ratio might suggest that Gold is undervalued relative to Silver.