The main category of Forex News.
You can use the search box below to find what you need.
[wd_asp id=1]
The main category of Forex News.
You can use the search box below to find what you need.
[wd_asp id=1]
The Euro to Dollar (EUR/USD) exchange rate is holding around 1.1670 on Wednesday after a strong late-August advance carried the pair through several resistance levels that had frustrated Euro bulls earlier this month.
EUR/USD was quoted at 1.1669 early in the European session, having gained around 2.45% over the past month and reached a high of 1.1711 during the latest rally.
Currency analysts at ING remain reluctant to call a bottom in the broader Dollar decline.
“Most paths seem to lead to a weaker dollar, but Kevin Warsh’s speech on Friday could prove supportive,” ING’s Chris Turner said.
The bank believes positioning may still have further to adjust after the Dollar’s strong run earlier in the summer.
“There may still be room for further USD long-squeezing, and we remain reluctant to call the bottom in this dollar selloff just yet,” Turner added.
That view has gained some support from the wider market backdrop.
The Dollar index was hovering close to a three-month low on Wednesday after US Treasury measures aimed at limiting pressure on long-term bond yields added another source of uncertainty around the Greenback.
Reuters reported on Wednesday that EUR/USD was around 1.1661 as traders waited for US PCE inflation and Warsh’s Jackson Hole address, with Standard Chartered also warning that attempts to push US rates lower could create another Dollar headwind.

The one-month chart shows the scale of the change, with EUR/USD climbing from below 1.1400 in late July to above 1.1700 before consolidating around 1.1670.
ING also sees the futures market as relatively supportive for the Euro rather than dangerously crowded.
Asset managers and leveraged funds have been buying Euro contracts, although Turner stresses that the overall positions remain fairly modest.
“Speculators look quite underweight the euro,” he said, noting that the available positioning data also pre-dated last week’s sharp EUR/USD breakout.
That leaves scope for further buying if US rate expectations or confidence in the Dollar soften again.
The European data backdrop has meanwhile improved.
ING had expected Germany’s August Ifo survey to continue recovering, and Tuesday’s release was stronger than forecast, with the business climate index rising to 88.8 from 86.7 against expectations near 87.2.
German GDP growth was also revised up to 0.3% quarter-on-quarter for Q2, giving the Euro a somewhat firmer domestic foundation than it had earlier in the summer. Reuters reported that business confidence improved across all major sectors.
As we noted in our earlier ING EUR/USD forecast, the bank’s 1.18 year-end call originally rested heavily on softer US employment data reducing the case for further Fed tightening.
The latest move has brought spot much closer to that destination.
ING’s technical reference point is particularly timely because EUR/USD is sitting almost directly on top of it.
“We do not really see the need for EUR/USD to come back sharply under support at 1.1660/70 today,” Turner said, although he warned that last week’s breakout area could come back into play if risk assets suffer a broader setback.
That support zone now separates a fairly orderly consolidation from a more meaningful reversal of the recent Euro rally.
There is also an interesting contrast with our recent MUFG EUR/USD analysis, when the 1.1630 area was still acting as resistance and MUFG warned that the Euro looked rich relative to short-term fundamentals.
EUR/USD has since broken above that level and held there.
ING nevertheless sees Friday’s Jackson Hole speech as a genuine risk to the bullish picture.
“The speech could be a hawkish event risk for the dollar,” Turner said, with Warsh expected to reinforce the Fed’s inflation-fighting credentials after his July press conference unsettled the Treasury market.
Before then, traders face July PCE inflation, with the US Bureau of Economic Analysis due to publish the Fed’s preferred inflation measures later on Wednesday.
ING has not been tempted to raise its forecasts simply because spot has moved rapidly higher.
“At present, we are happy with our current forecasts for EUR/USD at 1.17 end September and 1.18 for end year – but will be reviewing those this week,” Turner said.
With EUR/USD already near 1.1670, the 1.17 September target is now effectively within reach.
The more interesting question is whether softer US policy expectations, improving European data and relatively light Euro positioning can carry the pair towards 1.18 without first producing a deeper correction.
Our euro to dollar forecast for th short-term is 1.1660/70 is the level that should tell us whether the latest breakout is being consolidated or beginning to unwind.
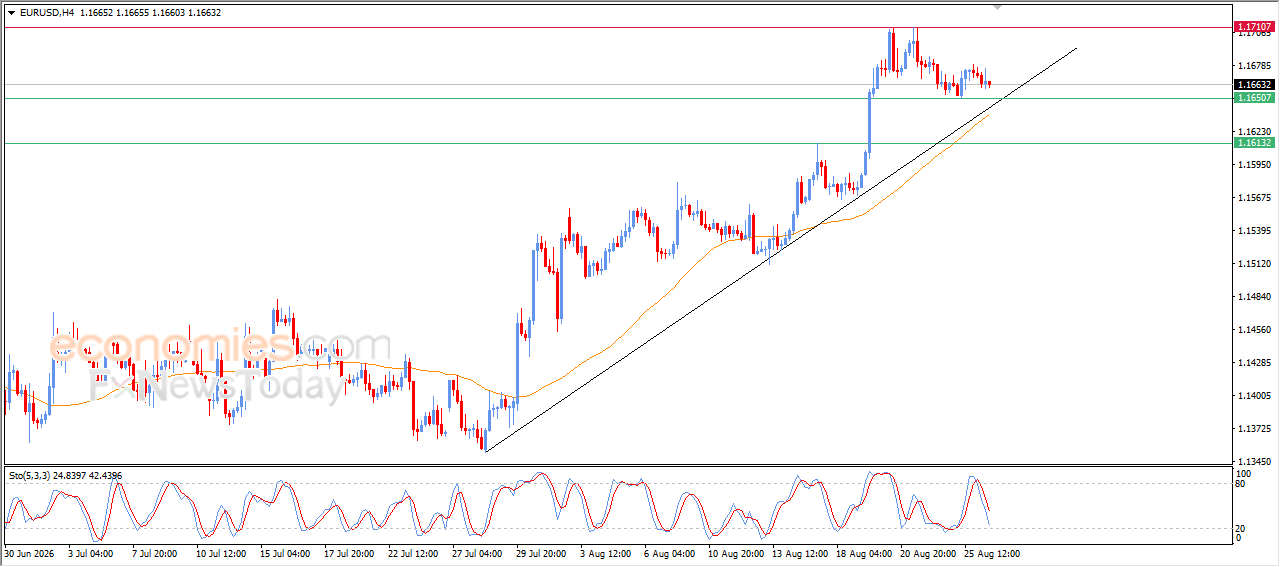
The EURUSD pair declined during its latest intraday trading, attempting to gain bullish momentum that might help it to recover and rise again, and it managed in offloading its overbought conditions on the relative strength indicators, increasing the chances of its near term recovery, especially with the continuation of the positive pressure due to its trading above EMA50, reinforcing the stability and dominance of the main bullish trend on the short-term basis, with its trading alongside supportive trend line for this path.
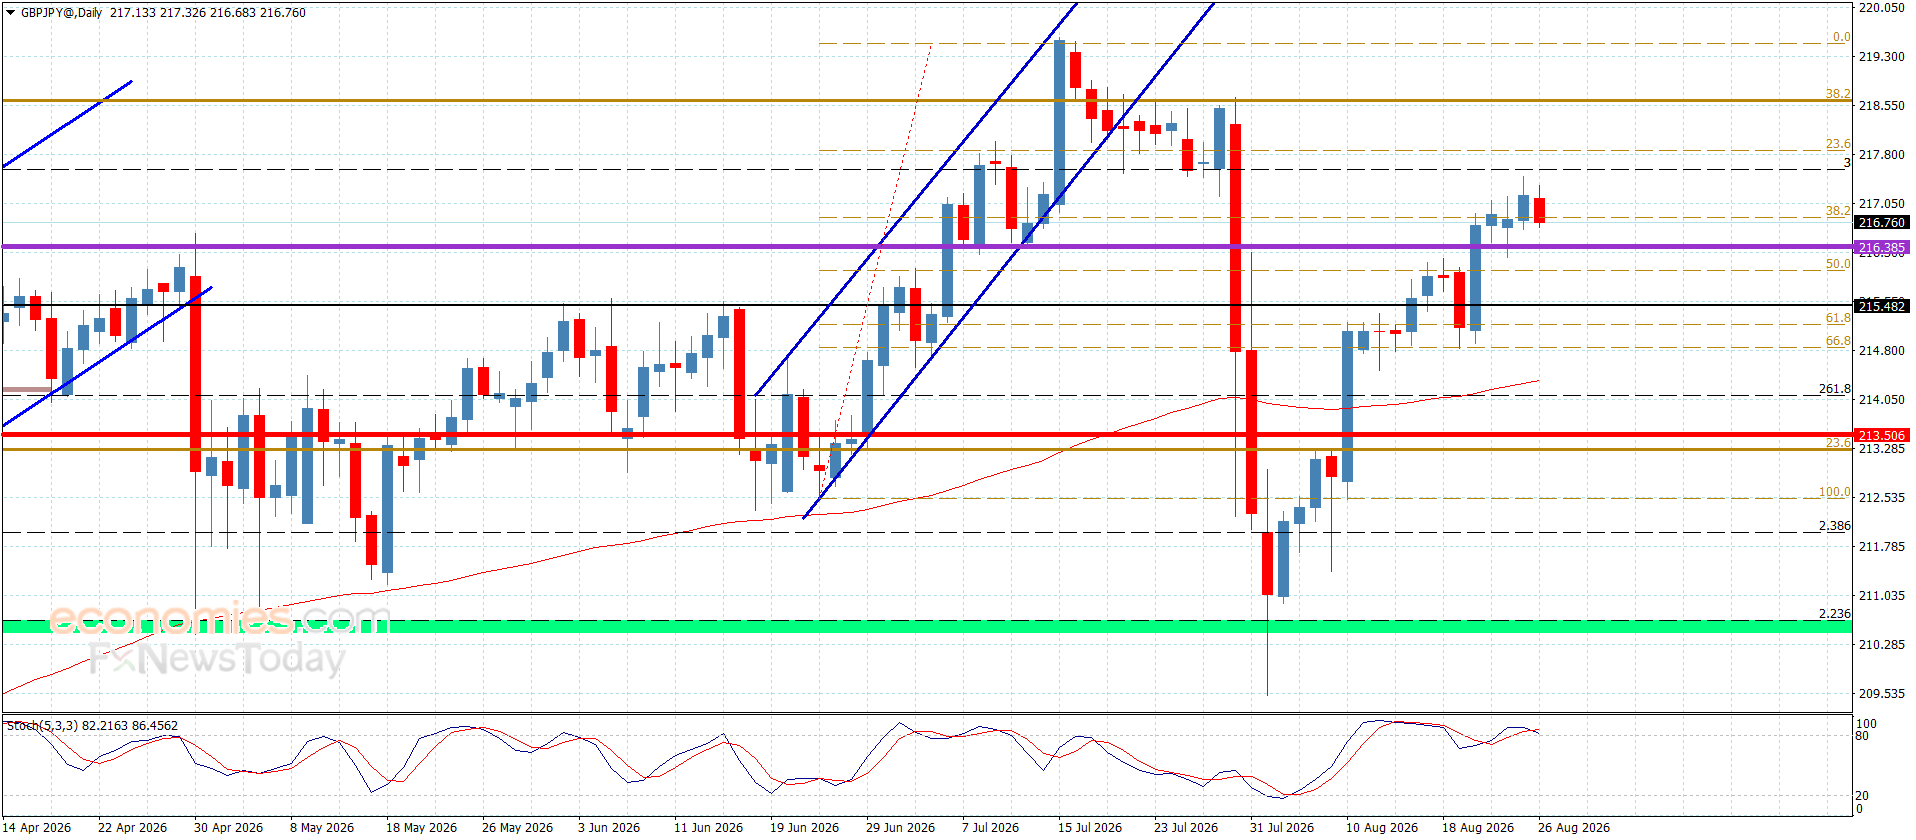
The pair’s price failed to reach the resistance barrier near 217.85, while it is currently reacting to the attempt of the Stochastic indicator to exit the overbought zone, forcing the pair to move in mixed sideways trading and fluctuate around 216.75.
We emphasize the importance of maintaining trading above 216.35 during the current period, as this would allow the pair to renew its bullish attempts and push toward the aforementioned resistance barrier. A breakout above this level would confirm its transition into a new positive phase, extending the move directly toward 218.35 and 218.65. On the other hand, slipping below 216.35 would force the pair to activate the bearish corrective scenario, targeting 215.55 initially.
The expected trading range for today is between 216.50 and 217.85
Trend forecast: Bullish
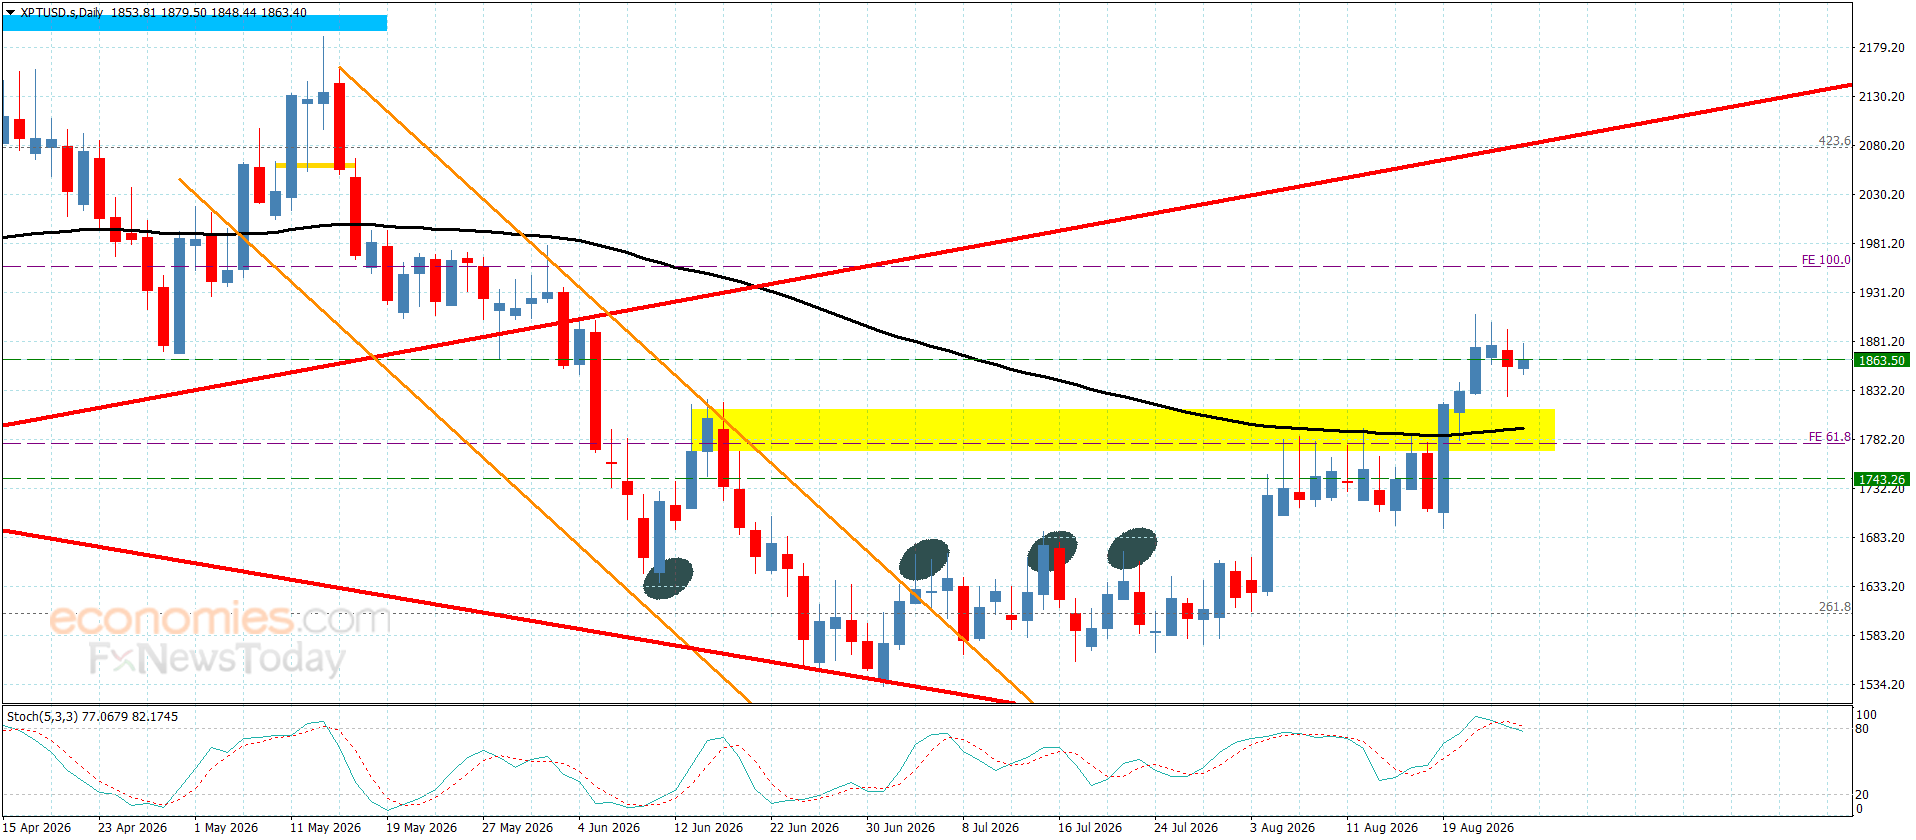
The platinum price was forced into mixed sideways trading, continuing to hover near $1865.00, as it remains confined between the resistance barrier at $1905.00 and the important support level at $1780.00.
We note that renewed positive momentum from the main indicators would increase the chances of the price resuming its bullish attempts. Accordingly, we expect it to retest the resistance barrier, where surpassing it will open the way for resuming the bullish move, targeting $1955.00 and $1990.00.
The expected trading range for today is between $1485.00 and $1910.00
Trend forecast: Sideways
The Indicators feature provides value and direction analysis for various instruments under a selection of technical indicators, together with a technical summary.
This feature includes nine of the commonly used technical indicators: MACD, RSI, KDJ, StochRSI, ATR, CCI, WR, TRIX and MA. You may also adjust the timeframe depending on your needs.
Please note that technical analysis is only part of investment reference, and there is no absolute standard for using numerical values to assess direction. The results are for reference only, and we are not responsible for the accuracy of the indicator calculations and summaries.
Silver Price Forecast: XAG/USD Reclaims 100-Day SMA, Analysts Eye $70
Silver (XAG/USD) has reclaimed its 100-day simple moving average (SMA), a key technical level that signals a potential shift in momentum, with market participants now setting their sights on the $70 per ounce mark.
The move above the 100-day SMA, a widely watched indicator by traders and analysts, suggests that the recent pullback in silver prices may be losing steam. As of the latest trading session, silver is holding above this level, which previously acted as resistance during the recent decline. This reclaim often attracts technical buyers and can lead to further upside momentum.
The 100-day SMA is a critical gauge of the medium-term trend. A sustained move above it could open the door for a test of the $70 psychological level, a price point not seen in recent history. However, traders should note that a failure to hold this level could lead to a retest of lower support zones.
Several fundamental factors are underpinning silver’s strength. A softer US dollar, as reflected in the DXY index, has historically been supportive for precious metals, as it makes them cheaper for holders of other currencies. Additionally, expectations that the Federal Reserve may pivot towards a more accommodative monetary policy in the coming months have boosted the appeal of non-yielding assets like silver.
Industrial demand also plays a crucial role. Silver’s extensive use in solar panels, electronics, and electric vehicles continues to provide a solid demand floor. As global green energy initiatives accelerate, silver’s industrial consumption is projected to remain robust, adding a supportive backdrop to its price action.
The $70 level is not just a round number; it represents a significant technical and psychological barrier. A move to this price would represent a substantial gain from current levels and could trigger a new wave of investment interest. However, it is essential to approach such targets with caution, as markets can be volatile and unforeseen macroeconomic events can derail even the most bullish technical setups.
For investors, the reclaim of the 100-day SMA offers a potential entry point, but prudent risk management remains paramount. Monitoring the dollar’s trajectory, upcoming Fed statements, and global industrial production data will be key to gauging whether silver can sustain its upward path.
Silver’s reclaim of the 100-day SMA is a bullish technical signal, and the path towards $70 is now a focal point for market watchers. While the outlook appears constructive, driven by a softer dollar and robust industrial demand, investors should remain vigilant about potential headwinds, including shifts in monetary policy and broader economic data releases.
Q1: What is the 100-day simple moving average (SMA)?
The 100-day SMA is a technical indicator that calculates the average closing price of silver over the last 100 days. It is used by traders to assess the medium-term trend. A price above the SMA often indicates bullish momentum, while a price below suggests bearish sentiment.
Q2: Why is the $70 level significant for silver?
The $70 level is a major psychological and technical resistance point. It represents a price target that could attract significant buying interest if reached, but it also may trigger profit-taking. Such round numbers often act as magnets for price action.
Q3: What are the main factors that could push silver to $70?
A continued weaker US dollar, expectations of a less hawkish Federal Reserve, and strong industrial demand, particularly from the green energy sector, are the primary factors that could drive silver towards $70. Additionally, sustained technical buying above the 100-day SMA could add momentum.
This post Silver Price Forecast: XAG/USD Reclaims 100-Day SMA, Analysts Eye $70 first appeared on BitcoinWorld.
The euro initially gapped higher against the Pound on Monday but has since loosened its grip.
The euro initially gapped higher against the British pound to kick off the week but has since fallen a bit to continue the overall consolidation that we have seen. It looks like the 50-day EMA has come into the picture to cause a little bit of a headache.

The euro leg seems to be the big story here as German flash manufacturing PMI hit its strongest level since 2022 on defense spending, and the broader read is Eurozone activity is still expanding in August with manufacturing improving. That keeps the ECB hike story alive, but the higher-for-longer UK rates trade is starting to flex its muscles later in the day.
Keep in mind that there are concerns about the sanctions coming from the United States for the Iranians. Will this tighten the oil supply even further? And the European Union is particularly vulnerable to this, not to mention the fact that the liquefied natural gas coming from Qatar could be affected as well.
Quite frankly, the biggest prints coming out of the United Kingdom have already passed mid-month, thinking about CPI and jobs, so there aren’t any Tier 1 UK releases scheduled this week. That in and of itself might help the British pound continue to flex its muscles.
We’ve been in a downtrend. We pulled back to test the 50-day EMA a couple of times. Now the question is, will we break down below this consolidation, which is basically seeing support near the 0.8530 level?
The German IFO numbers come out tomorrow. That will have a major influence on the euro if it shocks the market. But as things stand right now, this looks very much like a market that just simply wants to continue its consolidation, perhaps with a little bit more of a bearish hint to it than anything else. I’ll be watching that 0.8530 level to see if we break down.
Ready to trade our Forex forecast? We’ve shortlisted the best European brokers in the industry for you.
Christopher Lewis is a technical analyst and market commentator at DailyForex with more than two decades of trading experience in Forex and other leveraged markets. Based in Columbus, Ohio, he specializes in chart-based analysis of major currency pairs, stock indices, commodities, and energy markets, focusing on clear support and resistance levels, trend structure, and risk management. Christopher produces daily written and video analysis for traders who rely on technical setups to navigate volatile market conditions
As seen on: Pairs Of Aces Podcast,The Trader Guy, FXEmpire
Welcome, my fellow traders! I have prepared a price forecast for the USCrude, XAUUSD, and EURUSD using a combination of the margin zones method and technical analysis. Based on the market analysis, I suggest entry signals for intraday traders.
The oil price is approaching support A of 83.32–82.92.
The article covers the following subjects:
Oil is approaching support A of 83.32–82.92. Once this zone is tested, consider long trades, with the first target at 85.14 and the second one around 87.36.
If the price breaks below the support A today, the correction will extend toward support B of 81.30–80.70, the trend boundary. Long trades can be considered near this zone.
Buy near support A of 83.32–82.92. TakeProfit: 85.14, 87.36. StopLoss: 81.86.
Yesterday, the gold price hit the Target Zone 3 of 4,698–4,677 within a short-term uptrend. However, the metal failed to break through this zone. Consequently, the price began to decline today, approaching support A of 4,594–4,583. Once this zone is tested, long trades can be considered, with the first target at 4,640 and the second one around 4,696.
The trend boundary is shifting to 4,542–4,527.
Buy near support A of 4,594–4,583. TakeProfit: 4,640, 4,696. StopLoss: 4,558.
The euro is correcting lower and nearing support A of 1.1627–1.1619. Once this zone is tested, long trades can be considered, with the first target at 1.1665 and the second at 1.1711.
If the price exceeds the 1.1711 level, the rally may continue toward the Target Zone 2 of 1.1761–1.1744. If the asset breaks below the support A, the correction may extend toward support B of 1.1585–1.1572.
Buy near support A of 1.1627–1.1619. TakeProfit: 1.1665, 1.1711. StopLoss: 1.1597.
Would you like to learn more about technical analysis methods and principles? Explore our comprehensive guide.
P.S. Did you like my article? Share it in social networks: it will be the best “thank you” 🙂
Useful links:
The content of this article reflects the author’s opinion and does not necessarily reflect the official position of LiteFinance broker. The material published on this page is provided for informational purposes only and should not be considered as the provision of investment advice for the purposes of Directive 2014/65/EU.
According to copyright law, this article is considered intellectual property, which includes a prohibition on copying and distributing it without consent.
– Written by
David Woodsmith
STORY LINK GBP/USD Forecast: Pound Eyes 1.37 as Dollar Risks Mount
The Pound to Dollar (GBP/USD) exchange rate maintained a firm tone on Tuesday, trading around 1.3630-1.3640 and holding close to Friday’s six-month high above 1.3670.
Pound Sterling has struggled to extend its advance, but the Dollar remains under pressure amid persistent concerns over US fiscal policy, trade tensions and the credibility of recent Treasury intervention in the bond market.
GBP/USD reached 1.3675 at the end of last week before correcting modestly, with the pair retaining a generally bullish technical tone.
On a short-term view, UoB sees scope for GBP/USD gains towards 1.3700, but added; “On the downside, if GBP breaks below 1.3585 it would mean that 1.3700 is out of reach.”
Scotiabank maintains a positive outlook on the Pound; “Underlying trend dynamics remain solidly bullish and, after a period of range trading and two tests of 1.3150, a sustained push above 1.3650/60 implies potential for an extension towards the 1.41 zone over the balance of the year.”
US policy developments remain a dominant influence on currency markets this week.
Get better rates and lower fees on your next international money transfer.
Compare TorFX with top UK banks in seconds and see how much you could save.
Trade tensions with Canada have intensified sharply following the collapse of negotiations.
Canada announced retaliatory tariffs on around $20bn of US goods on Tuesday, matching recent US tariffs dollar-for-dollar.
The measures cover hundreds of products and are due to take effect in September.
President Trump has also threatened to impose 50% tariffs on Canadian cars, trucks and automotive parts from January 2027, increasing concerns over disruption to highly integrated North American supply chains.
ING had commented; “With a new chapter in the US-Canada trade war opening up over the weekend, the question will be to what degree the new sanctions on Iran threaten US trade ties with China again.”
The bank added that a significant re-escalation in the tariff conflict would probably be negative for the Dollar.

US Treasury Secretary Scott Bessent also announced an expansion of sanctions against Iran on Monday.
The measures are intended to restrict Iran’s access to the global financial system and target economic activity supporting Tehran.
However, Washington stopped short of immediately applying the most severe measures against China, Iran’s largest energy customer, reducing fears of an abrupt escalation in US-China tensions.
The announcement produced only limited support for the Dollar.
Markets remain cautious over whether sanctions will materially alter Iran’s behaviour or instead increase geopolitical and energy-market risks.
Fiscal policy is also attracting increasing attention following last week’s Treasury intervention in the bond market.
The Treasury doubled the size of buybacks of longer-dated government securities after the 30-year yield climbed to its highest level since 2007.
Bessent said on Monday that regularly scheduled Treasury auctions would continue despite the larger buyback programme.
The strategy remains controversial.
Billionaire investor Stanley Druckenmiller criticised the intervention this week, arguing that Treasury bond buying risks undermining the credibility of the world’s largest government debt market.
Concerns have also intensified after total US government debt surpassed $40trn.
MUFG commented; “We await US Treasury Secretary Scott Bessent’s details on addressing concerns over the fiscal outlook in the US but we along with market participants are very sceptical of anything meaningful coming from an announcement.”
It added; “A failure to cap yields would be viewed as a policy misstep that would undermine investor confidence and hurt the dollar while steps to cap yields would also likely undermine the dollar.”
This potentially leaves the Dollar in a difficult position.
A renewed surge in long-term yields could revive concerns over US debt sustainability, while more aggressive Treasury intervention could encourage investors to reduce exposure to the currency.
Fed Chair Kevin Warsh’s Jackson Hole speech later this week is likely to become the next major test for GBP/USD.
The Federal Reserve remains caught between inflation that is still above target and a recent run of softer US employment, retail sales and inflation data.
Warsh will also be speaking against an increasingly sensitive political backdrop following Treasury efforts to contain long-term borrowing costs.
A hawkish speech could push Treasury yields higher and offer the Dollar some support, although another aggressive bond sell-off could revive broader concerns over US fiscal stability.
Conversely, a softer message would reinforce expectations that the Fed will leave rates unchanged in September and could push GBP/USD back towards 1.3675 and 1.3700.
A sustained break above 1.3700 would strengthen the bullish technical picture and bring the 1.3800 area into focus.
Initial support is located around 1.3585-1.3600, with a break below this region likely to undermine the current upward bias.
International Money Transfer? Ask our resident FX expert a money transfer question or try John’s new, free, no-obligation personal service! ,where he helps every step of the way,
ensuring you get the best exchange rates on your currency requirements.
TAGS: Pound Dollar Forecasts
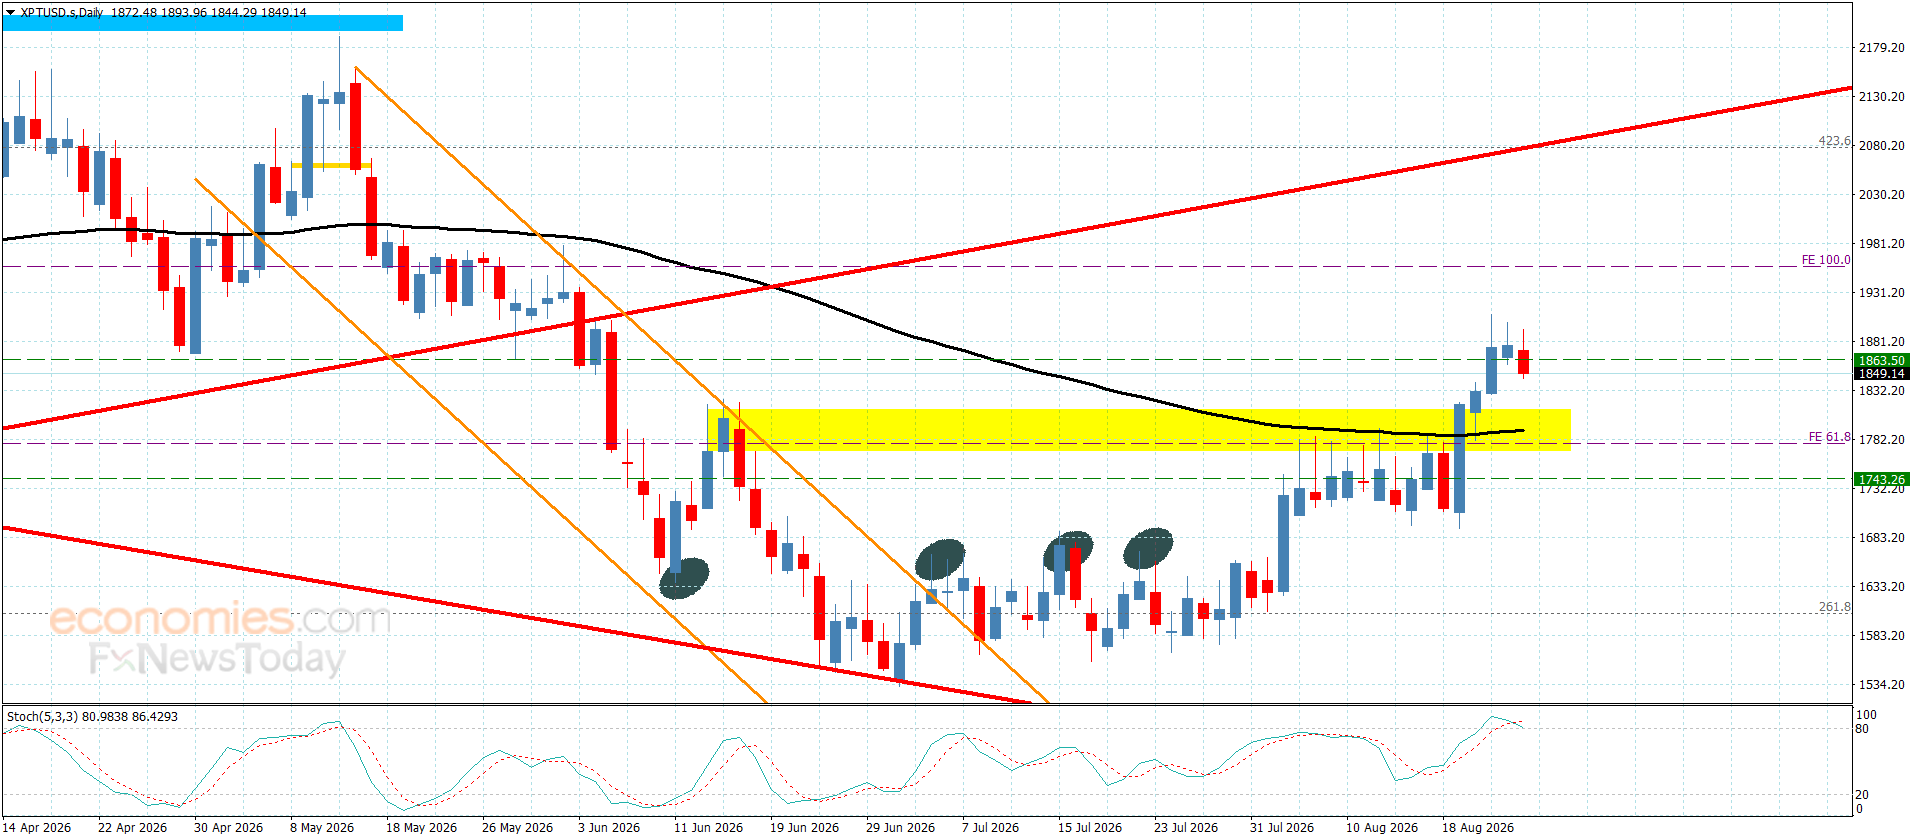
The platinum price failed to break through the barrier at $1905.00, forcing it to postpone its bullish attack and begin forming negative waves, as it is currently edging toward the $1,845.00 level.
Repeatedly holding below the barrier could increase the negative pressure on current trading, leading us to favor further temporary bearish attempts, which could target $1815.00 and $1780.00, respectively. However, a successful break above the barrier and holding above it would give the price a strong opportunity to achieve new gains, initially targeting $1955.00.
The expected trading range for today is between $1815.00 and $1890.00
Trend forecast: Bearish