The main category of Forex News.
You can use the search box below to find what you need.
[wd_asp id=1]
The main category of Forex News.
You can use the search box below to find what you need.
[wd_asp id=1]
Most Read: Gold (XAU/USD) Outlook: $3000/oz Target Possible as Safe Haven Demand Rises
Oil prices continued their recovery today running into a key resistance level. The rise in Oil prices this week has surprised me given the trade war fears which have weighed on overall market sentiment.
In a similar vein to what we are seeing with Gold prices where tariffs should be negative, prices continue to rise. It appears that other influences are balancing out this risk. Similarly, with Oil prices, tariffs raise concerns about lower demand, but this is being offset by tighter sanctions on Russian and Iranian Oil supplies.
U.S. sanctions on Iranian and Russian oil are causing disruptions and increasing supply concerns. Restrictions on Russian oil shipments to China and India have been affected, impacting tankers, producers, and insurers.
Meanwhile, sanctions on networks shipping Iranian Oil to China have added pressure, reinforcing the U.S.’s tough stance on Iranian exports.
There were also reports in the media today regarding drone attacks on a Russian refinery plant in the Saratov region. The refinery in question is part of Rosneft, called Kreking, one of Russia’s oldest, has been affected. At the same time, Russia launched an overnight attack on Ukraine’s gas and power facilities, targeting its energy infrastructure.
All of these developments are keeping oil prices supported for now.
The U.S. Energy Information Administration (EIA) reported that U.S. oil production is expected to grow more this year than previously predicted. By 2025, they estimate production will average 13.59 million barrels per day, slightly higher than the earlier forecast of 13.55 million barrels per day. However, the EIA kept its prediction for U.S. oil and fuel demand unchanged at 20.5 million barrels per day in 2025.
The EIA expects Brent crude prices to average about $74 in 2025 before dropping to $66 in 2026, as production gradually increases and global demand remains weak. OPEC+ production cuts will lower global oil supplies and help keep prices steady through early 2025.
This is something which OPEC + themselves have reiterated many times.
OPEC’s Secretary General Haitham Al Ghais said the group focuses on long-term plans for the global oil market, aiming to keep prices steady. His statement was made at the India Energy Week conference and followed repeated calls from U.S. President Donald Trump for OPEC to increase oil production to bring prices down.
The group is looking to gradually raise output from April, but with the US expected to increase production I still maintain that production cuts will remain in place in Q2 2025.
US API data will be released in a short while with the EIA inventories data due out tomorrow. Markets are expecting
The API forecast for crude oil stock changes is an increase of 2.8 million barrels, compared to the previous week’s larger build of 5.025 million barrels.
For all market-moving economic releases and events, see the MarketPulse Economic Calendar.
This is a follow-up analysis of my prior report “Brent Crude Oil Analysis: Iran Tensions, OPEC+ and Price Trends” published on 4 February 2025.
From a technical analysis standpoint, Brent in enjoying its third successive day of gain but does face a significant handle around the 77.68 with another area of resistance just above at 78.19.
The 14-day RSI has crossed above the 50-handle which is usually a sign that momentum has shifted to favor bulls.
Brent Crude Oil Daily Chart, February 11, 2025

Source: TradingView (click to enlarge)
When dropping down to a four-hour chart, the RSI has tapped into overbought territory which leaves the door open for a short-term pullback.
Supporting a bullish narrative is the fact that price is currently trading above both the 100 and 200-day MAs on a four-hour chart.
If price is to pullback, immediate support rests at 76.35 before support at the psychological 75.00 handle comes into focus.
Brent Crude Oil Four-Hour Chart, February 11, 2025

Source: TradingView (click to enlarge)
Support
Resistance
Follow Zain on Twitter/X for Additional Market News and Insights @zvawda
Content is for general information purposes only. It is not investment advice or a solution to buy or sell securities. Opinions are the authors; not necessarily that of OANDA Business Information & Services, Inc. or any of its affiliates, subsidiaries, officers or directors. If you would like to reproduce or redistribute any of the content found on MarketPulse, an award winning forex, commodities and global indices analysis and news site service produced by OANDA Business Information & Services, Inc., please access the RSS feed or contact us at info@marketpulse.com. Visit https://www.marketpulse.com/ to find out more about the beat of the global markets. © 2023 OANDA Business Information & Services Inc.
The next upside targets are the 200-Day MA at $74.74 and the 20-Day MA, now at $74.89. Notice that the 20-Day line is falling and close to converging with the 200-Day line. Each line presents potentially solid resistance on its own but more so if combined to identify a similar price area. Confirming the 200-Day line is the 38.2% Fibonacci retracement at $74.69. Together, they put a bull’s eye on a price zone from $74.6 to $74.89 and increases the chance of the price zone being tested as resistance.
Higher price targets start with the 50% retracement at $75.85. That price area is confirmed by the interim swing high at $75.82. The swing high is part of the bearish price structure for the recent correction as it was a lower swing high, relative to the recent $80.76 peak. Once support is successfully tested at the lower end of the week’s range, as seen on Monday, a swing back toward the top of the range is possible. This would be similar behavior to what is seen inside a consolidation pattern.
Once one side of the pattern is tested as either support or resistance, and a reversal sets up, the other side of the pattern becomes a potential target. If crude follows through as it might, the top of the weekly range at $75.82 becomes a target. Since the week’s high gives credence to the 50% target zone, it is possible that it is eventually reached. Moreover, the 50-Week MA is also nearby at $76.02.
For a look at all of today’s economic events, check out our economic calendar.
Important DisclaimersThe content provided on the website includes general news and publications, our personal analysis and opinions, and contents provided by third parties, which are intended for educational and research purposes only. It does not constitute, and should not be read as, any recommendation or advice to take any action whatsoever, including to make any investment or buy any product. When making any financial decision, you should perform your own due diligence checks, apply your own discretion and consult your competent advisors. The content of the website is not personally directed to you, and we does not take into account your financial situation or needs.The information contained in this website is not necessarily provided in real-time nor is it necessarily accurate. Prices provided herein may be provided by market makers and not by exchanges.Any trading or other financial decision you make shall be at your full responsibility, and you must not rely on any information provided through the website. FX Empire does not provide any warranty regarding any of the information contained in the website, and shall bear no responsibility for any trading losses you might incur as a result of using any information contained in the website.The website may include advertisements and other promotional contents, and FX Empire may receive compensation from third parties in connection with the content. FX Empire does not endorse any third party or recommends using any third party’s services, and does not assume responsibility for your use of any such third party’s website or services.FX Empire and its employees, officers, subsidiaries and associates, are not liable nor shall they be held liable for any loss or damage resulting from your use of the website or reliance on the information provided on this website.Risk DisclaimersThis website includes information about cryptocurrencies, contracts for difference (CFDs) and other financial instruments, and about brokers, exchanges and other entities trading in such instruments. Both cryptocurrencies and CFDs are complex instruments and come with a high risk of losing money. You should carefully consider whether you understand how these instruments work and whether you can afford to take the high risk of losing your money.FX Empire encourages you to perform your own research before making any investment decision, and to avoid investing in any financial instrument which you do not fully understand how it works and what are the risks involved.
Spot Gold peaked at $2,942.76 early on Tuesday, reaching yet another record high before giving up. The bright metal fell towards $2,880 early in the American session but quickly recovered the $2,900 mark, trading above it as the session progressed.
The US Dollar (USD) lost its recent attractiveness across the FX board despite a cautious mood that prevailed throughout the day, once again correcting lower after a strong start to the week.
Asian and European traders held cautious ahead of Federal Reserve (Fed) Chairman Jerome Powell’s appearance before Congress. Powell, who testified on monetary policy, repeated much of what he said after the January Fed monetary policy meeting. Powell said policymakers are in no hurry to adjust the monetary policy and would like to make more progress on inflation. He also added that the economy was in a “pretty good place” and refused to comment on tariffs.
His words brought some relief to financial markets, helping Wall Street to trim most of its early losses while reviving the USD’s weakness.
Powell will repeat his testimony on Wednesday, although before a different commission. Additionally, the United States (US) will release the January Consumer Price Index (CPI), foreseen up by 2.9% from a year earlier, matching the December reading. The core annual advance is expected at 3.1%, slightly below the previous 3.2%.
From a technical point of view, XAU/USD remains bullish, yet overbought conditions suggest a corrective decline remains likely. In the daily chart, technical indicators are retreating just modestly while still developing within extreme levels. At the same time, the bright metal remains far above all its moving averages, with the 20 Simple Moving Average (SMA) heading firmly higher, yet currently at around $2,787.34, too far below the current level to be relevant.
XAU/USD corrected overbought conditions in the near term and could resume its advance from here. The 4-hour chart shows buyers added longs in the intraday dip towards a bullish 20 SMA, now providing dynamic support at around $2,883.50. The 100 and 200 SMAs, in the meantime, maintain their strong upward slopes far below the shorter one. Finally, technical indicators corrected extreme overbought readings but turned flat above their midlines, reflecting buying interest surging on price retracements.
Support levels: 2,883.50 2,872.30 2,855.45
Resistance levels: 2,911.60 2,925.00 2,940.00
The table below shows the percentage change of Japanese Yen (JPY) against listed major currencies today. Japanese Yen was the strongest against the Swiss Franc.
| USD | EUR | GBP | JPY | CAD | AUD | NZD | CHF | |
|---|---|---|---|---|---|---|---|---|
| USD | -0.53% | -0.60% | 0.30% | -0.16% | -0.28% | -0.23% | 0.16% | |
| EUR | 0.53% | -0.08% | 0.85% | 0.39% | 0.25% | 0.30% | 0.70% | |
| GBP | 0.60% | 0.08% | 0.93% | 0.46% | 0.31% | 0.36% | 0.76% | |
| JPY | -0.30% | -0.85% | -0.93% | -0.45% | -0.59% | -0.53% | -0.14% | |
| CAD | 0.16% | -0.39% | -0.46% | 0.45% | -0.13% | -0.08% | 0.31% | |
| AUD | 0.28% | -0.25% | -0.31% | 0.59% | 0.13% | 0.05% | 0.44% | |
| NZD | 0.23% | -0.30% | -0.36% | 0.53% | 0.08% | -0.05% | 0.39% | |
| CHF | -0.16% | -0.70% | -0.76% | 0.14% | -0.31% | -0.44% | -0.39% |
The heat map shows percentage changes of major currencies against each other. The base currency is picked from the left column, while the quote currency is picked from the top row. For example, if you pick the Japanese Yen from the left column and move along the horizontal line to the US Dollar, the percentage change displayed in the box will represent JPY (base)/USD (quote).
Home Depot’s stock price (HD) rose in the intraday levels, after leaning on the support of the 50-day SMA, lending the stock positive momentum, amid the dominance of the main upward trend, while trading alongside the secondary short-term trend line, with positive signals from the RSI after reaching oversold levels.
Therefore we expect more gains for the stock, targeting the pivotal resistance of $440.97, provided the support of $401.76 holds on.
Trend forecast for today: Bullish
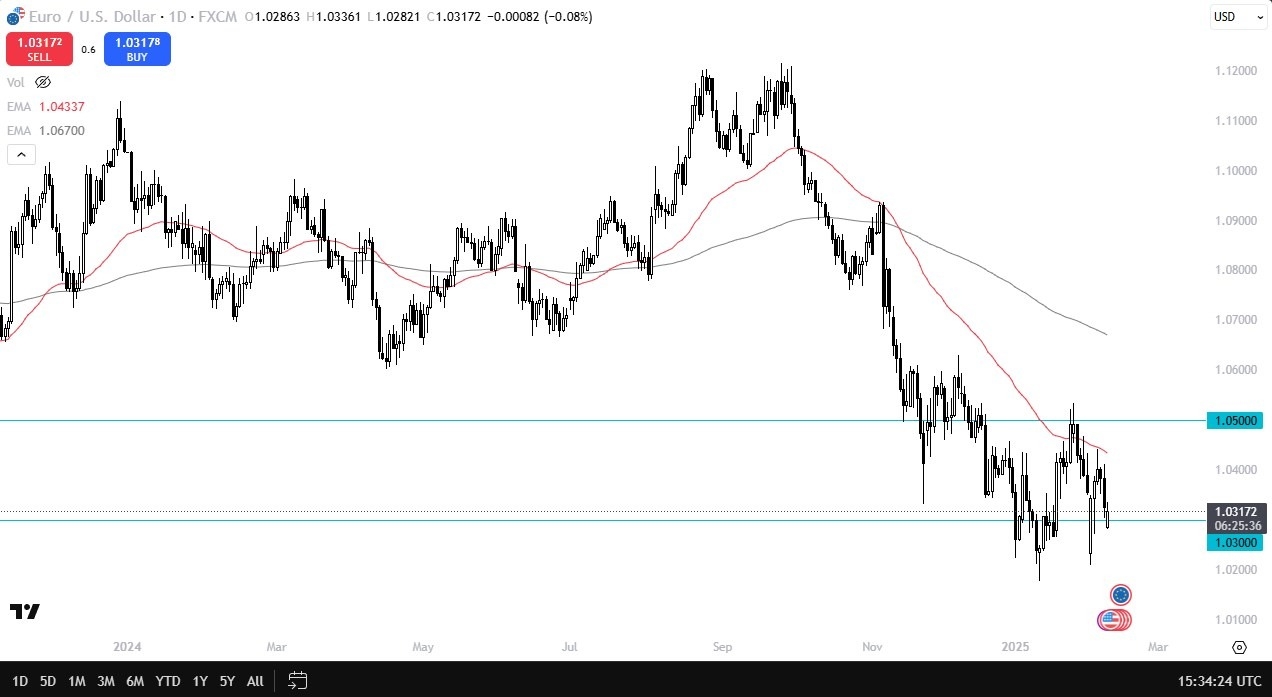
Sure, there will be an occasional short-term rally in this market, but as things stand right now, the fundamental simply do not line up for a protracted uptrend. In fact, I suspect you have a situation where this market will eventually try to rally, but that should end up being a nice shorting opportunity at the first signs of exhaustion. After all, we have been in a downtrend for quite some time, and there’s no real reason to think that it’s about the change anytime soon. Ultimately, this is a market that I think goes to the parity level before it is all said and done.

The technical analysis for this EUR/USD pair is obviously quite bleak, but it is worth noting that the market recovered quite nicely from the initial gap lower on the open for the Monday session. That being said, the 50 Day EMA currently sits right around the 1.0425 level, and after that we see the 1.05 level offering a significant amount of resistance. It is not until we break above that I think the market could pick up any type of momentum, and it’s really not until we break above the 1.06 level that I think anything will be sustained.
To the downside, if we were to break down below the level 1.02, that opens up the door to parity, something that this pair seems to be destined to reach. In fact, I’m starting to read some highly respected research that suggests the euro could even drop down to the 0.90 level at this rate. I’m not calling for that yet, but I certainly think parity is not out of the question.
Ready to trade our Forex EUR/USD forecast? We’ve shortlisted the best European brokers in the industry for you.
Silver price (XAG/USD) retraces its recent gains, trading around $31.80 per troy ounce during the European session on Tuesday. However, the downside of the metal price could be restrained as safe-haven demand for precious metals surged amid increased risk aversion following the latest US tariffs.
US President Donald Trump imposed a flat 25% tariff on steel and aluminum imports on Monday, removing all exemptions and nullifying previous trade agreements with key United States (US) allies. The move is intended to support struggling domestic industries but increases the risk of a broader trade conflict.
Geopolitical tensions in the Middle East could support the prices of the safe-haven Silver. President Trump has urged Israel to end its ceasefire with Hamas if hostages are not returned by the weekend, increasing the risk of renewed conflict as both sides accuse each other of violating the agreement.
However, the demand for non-interest-bearing Silver could face challenges as higher interest rates in the United States (US) could last longer. A Reuters poll of economists suggests the US Federal Reserve (Fed) may postpone interest rate cuts until next quarter due to inflation concerns. Many analysts who had anticipated a rate cut in March have now adjusted their forecasts, with most predicting at least one cut by June.
Investors await the release of the latest US inflation figures and comments from Federal Reserve Chair Jerome Powell later this week, which could influence the outlook for US monetary policy.
Silver is a precious metal highly traded among investors. It has been historically used as a store of value and a medium of exchange. Although less popular than Gold, traders may turn to Silver to diversify their investment portfolio, for its intrinsic value or as a potential hedge during high-inflation periods. Investors can buy physical Silver, in coins or in bars, or trade it through vehicles such as Exchange Traded Funds, which track its price on international markets.
Silver prices can move due to a wide range of factors. Geopolitical instability or fears of a deep recession can make Silver price escalate due to its safe-haven status, although to a lesser extent than Gold’s. As a yieldless asset, Silver tends to rise with lower interest rates. Its moves also depend on how the US Dollar (USD) behaves as the asset is priced in dollars (XAG/USD). A strong Dollar tends to keep the price of Silver at bay, whereas a weaker Dollar is likely to propel prices up. Other factors such as investment demand, mining supply – Silver is much more abundant than Gold – and recycling rates can also affect prices.
Silver is widely used in industry, particularly in sectors such as electronics or solar energy, as it has one of the highest electric conductivity of all metals – more than Copper and Gold. A surge in demand can increase prices, while a decline tends to lower them. Dynamics in the US, Chinese and Indian economies can also contribute to price swings: for the US and particularly China, their big industrial sectors use Silver in various processes; in India, consumers’ demand for the precious metal for jewellery also plays a key role in setting prices.
Silver prices tend to follow Gold’s moves. When Gold prices rise, Silver typically follows suit, as their status as safe-haven assets is similar. The Gold/Silver ratio, which shows the number of ounces of Silver needed to equal the value of one ounce of Gold, may help to determine the relative valuation between both metals. Some investors may consider a high ratio as an indicator that Silver is undervalued, or Gold is overvalued. On the contrary, a low ratio might suggest that Gold is undervalued relative to Silver.
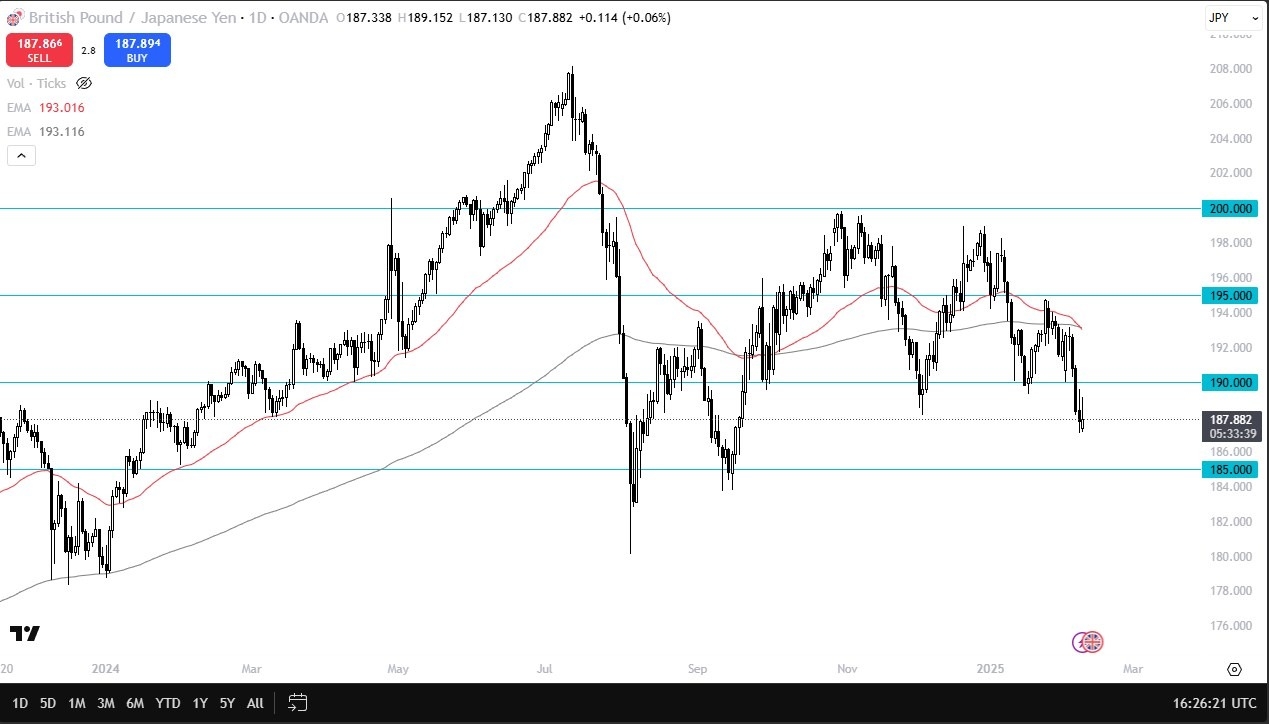
At the same time, you have the Bank of Japan mulling the idea of tightening monetary policy due to the fact that inflation is a problem in Japan for the first time in like 20 years. So, with that being the case, I do think that there is still more of a downward bias in this pair, perhaps to reach as low as the 185 yen level. Rallies at this point in time, I would treat with suspicion with the 190 yen level being an area I’d pay close attention to. If we can break above there, then we could challenge the 192.75 yen level where the 50 day EMA and the 200 day EMA currently meet and are crossing for the so-called death cross.
Now I’m not a big figure in that kind of thinking when it comes to trading the death cross, but I know a lot of people are really into it. I don’t believe it so much. I think it’s normally late, but it is worth noting that some traders will look at this as a sign to start selling. If we do break down from here, the 185 yen level is an area that I think a lot of people will be watching closely as it is a large round and psychologically significant figure, but it’s also an area that on longer-term charts does show some promise at being support. If we break down below that level, then 180 yen could be the target. As things stand right now, I think this probably makes more sense as a fade the rally type of situation.
Ready to trade our daily forecast and analysis? Here’s a list of some of the top forex brokers UK to check out.
Texas Instruments’ stock price (TXN) fell in the intraday levels, while preparing to pierce the pivotal support of $180.00, amid the dominance of the downward correctional trend in the short term, coupled with negative pressure due to trading below the 50-day SMA, and countered with positive signals from the RSI after reaching oversold levels, curbing upcoming losses.
Therefore we expect more losses for the price, provided the aforementioned support of $180.00 was breached, thus targeting the next one at $166.90.
Trend forecast for today: Bearish