The main category of Forex News.
You can use the search box below to find what you need.
[wd_asp id=1]
The main category of Forex News.
You can use the search box below to find what you need.
[wd_asp id=1]
Given the sharp bullish reversal seen today, higher targets seem likely before the advance is complete. This doesn’t mean natural gas goes straight up but it does indicate a possible bottom has been established at last Friday’s low of 2.99, at least for now. That low was in an area of confluence from several indicators all pointing to possible support around the 61.8% Fibonacci retracement at 3.03.
A breakout above today’s high of 3.41 triggers a continuation of the bounce. The next upside target is marked by two indicators from 3.51 to 3.52, consisting of the 38.2% Fibonacci retracement and the 50-Day MA, respectively. If upward momentum can be sustained there is a chance for a test of a higher potential resistance zone starting from the October 2023 peak at 3.64.
A potential resistance zone goes up to the 20-Day MA, currently at 3.71. Notice that a breakdown of the rising trend triggered a breakdown below the 20-Day MA and trendline on the same day, January 27. The current advance has the potential to eventually test resistance around the 20-Day line.
If natural gas decides to pullback and further test recent lows as support, the expectation is that it would hold as support, at least till there is a higher bounce. This is due to the combination of a clear support zone, as well as the rising trendline that is also around the lows. The expectation would be for further tests of recent lows to find support above the 2.99 price level.
Last week’s high was 3.83 and it established a high for a relatively wide range week. Since natural gas is stuck within the range, there is a chance to approach and test the area zone as resistance in reaction to last week’s very bearish price action.
For a look at all of today’s economic events, check out our economic calendar.
The Silver price (XAG/USD) tumbles to near $30.90 during the early European trading hours on Monday. The mounting fears of a global trade war following US President Donald Trump’s sweeping tariff measures boost the US Dollar (USD) broadly and exerts some selling pressure on the white metal.
According to the 4-hour chart, the bullish outlook of the white metal remains intact, with the price holding above the key 100-period Exponential Moving Averages (EMA). Nonetheless, the Relative Strength Index (RSI) hovers around the midline, suggesting that further consolidation cannot be ruled out.
The first downside target is located at $30.60, the 100-period EMA. Further south, the next contention level to watch is $30.40, the lower limit of the Bollinger Band. Extended losses will pave the way to the $30.00, psychological level, en route to $29.50, the low of January 13.
In the bullish case, the immediate resistance level emerges at $31.72, the high of January 31. The next hurdle is seen at the $31.90-$32.00 region, representing the upper limit of the Bollinger Band and the round mark.
Silver is a precious metal highly traded among investors. It has been historically used as a store of value and a medium of exchange. Although less popular than Gold, traders may turn to Silver to diversify their investment portfolio, for its intrinsic value or as a potential hedge during high-inflation periods. Investors can buy physical Silver, in coins or in bars, or trade it through vehicles such as Exchange Traded Funds, which track its price on international markets.
Silver prices can move due to a wide range of factors. Geopolitical instability or fears of a deep recession can make Silver price escalate due to its safe-haven status, although to a lesser extent than Gold’s. As a yieldless asset, Silver tends to rise with lower interest rates. Its moves also depend on how the US Dollar (USD) behaves as the asset is priced in dollars (XAG/USD). A strong Dollar tends to keep the price of Silver at bay, whereas a weaker Dollar is likely to propel prices up. Other factors such as investment demand, mining supply – Silver is much more abundant than Gold – and recycling rates can also affect prices.
Silver is widely used in industry, particularly in sectors such as electronics or solar energy, as it has one of the highest electric conductivity of all metals – more than Copper and Gold. A surge in demand can increase prices, while a decline tends to lower them. Dynamics in the US, Chinese and Indian economies can also contribute to price swings: for the US and particularly China, their big industrial sectors use Silver in various processes; in India, consumers’ demand for the precious metal for jewellery also plays a key role in setting prices.
Silver prices tend to follow Gold’s moves. When Gold prices rise, Silver typically follows suit, as their status as safe-haven assets is similar. The Gold/Silver ratio, which shows the number of ounces of Silver needed to equal the value of one ounce of Gold, may help to determine the relative valuation between both metals. Some investors may consider a high ratio as an indicator that Silver is undervalued, or Gold is overvalued. On the contrary, a low ratio might suggest that Gold is undervalued relative to Silver.
Bitcoin price (BTCUSD) shows additional positive trades to attempt to surpass 95195.00$ level, and as we mentioned this morning, this level represents important key to detect the next trend, as breaching it will push the price to attempt to regain the bullish track and achieve positive targets that reach 100000.00$, while consolidating below it will put the price under additional negative pressure that its next target reaches 87055.00$.
Therefore, we will continue with our neutrality until the price confirms its situation according to the above mentioned level followed by getting clearer signal for the next trend.
The expected trading range for today is between 90000.00$ support and 98500.00$ resistance.
Trend forecast: Neutral
February 3, 2025 – Written by David Woodsmith
STORY LINK GBP/USD Alert: Pound Rallies vs Dollar as Mexico Secures 1-Montb Tariff Delay
BREAKING: The Pound to Dollar exchange rate (GBP) jumped to 1.2420 from around 1.2330 at the US open. Risk appetite recovered strongly after Monday’s opening following reports that President Trump’s 25% tariffs on Mexico had been delayed by 1 month.
The dollar also pared gains against European currencies amid hopes that bilateral negotiations could lead to further concessions.
The Pound to Euro (GBP/EUR) exchange rate held firm around 1.2030.
The move followed a conference call between Trump and Mexican President Sheinbaum.
Volatility will inevitably remain high with risk vulnerable again if Canada adopts a hardline stance and fails to secure a reprieve.
According to sources, Mexico wanted the tariffs dropped entirely, but Trump would only agree on a 1-month postponement.
Inevitably, the US Administration will look to force more concessions from Mexico.

The immediate relief sparked hopes for a delay to tariffs on Canada and helped trigger a rebound in risk appetite, with equities paring losses.
The Canadian dollar rebounded strongly with USD/CAD at 1.4575 from 21-year highs near 1.4800.
Scotiabank commented, “The weekend advance has left a gap on the intraday chart between 1.4550/00, which markets may have to try and fill before the USD’s broader advance resumes.”
The Euro also rallied, although the threat of tariffs will loom large as a negotiating tactic.
International Money Transfer? Ask our resident FX expert a money transfer question or try John’s new, free, no-obligation personal service! ,where he helps every step of the way,
ensuring you get the best exchange rates on your currency requirements.
TAGS: Pound Dollar Forecasts
Spot Gold benefited from a risk-averse environment, with XAU/USD advancing beyond the $2,800 mark ahead of the American session opening. Fears are dominating financial markets after United States (US) President Donald Trump announced tariffs on three of its major trading counterparts.
Trump announced 25% tariffs on Mexico and Canada and 10% levies on Chinese imports on Saturday while anticipating he will also target the European Union (EU) and the United Kingdom, spurring concerns about a trade war that would disrupt global supply chains. Safe-haven assets soared while worldwide indexes edged sharply lower. Authorities from the affected countries rushed to announce countermeasures with different degrees of detail.
The panic mood, however, receded during American trading hours. Wall Street started the day with sharp losses but trimmed a good part of those following headlines that cooled down concerns, as Mexico’s President Claudia Sheinbaum said tariffs against the country would be paused after announcing retaliatory levies over the weekend.
As for the bright metal, it benefited throughout the first half of the day from the dismal sentiment, extending gains while the USD retraced. As a result, XAU/USD reached a fresh all-time high of $2,825.39, trading nearby at the time being.
The macroeconomic calendar will feature the Bank of England (BoE) monetary policy decision this week and US employment-related data, including the ADP survey on Employment Change and the monthly Nonfarm Payrolls report. Nevertheless, tariffs and the trade war are likely to dominate financial markets.
From a technical point of view, the daily chart for XAU/USD shows the pair trades inside a bullish channel, retreating just modestly from the upper end of the figure. Still, the upward momentum remains intact, and higher highs are in sight. In the mentioned time frame, technical indicators have partially lost their bullish strength but continue advancing within overbought territory. At the same time, the pair develops above all its moving averages, with the 20 Simple Moving Average (SMA) accelerating north above the 100 and 200 SMAs while providing dynamic support at around $2,726.
The near-term picture suggests buyers retain control despite a short pause. In the 4-hour chart, technical indicators reached overbought readings before turning flat, reflecting the ongoing retracement instead of suggesting a potential change in the dominant direction. At the same time, all moving averages gained upward traction far below the current level, with the 20 SMA at around $2,786.50.
Support levels: 2,804.50 2,786.50 2,772.00
Resistance levels: 2,825.20 2,840.00 2,855.00
According to the forex market trading, the Japanese yen was in a good position against the rest of the other major currencies amid strong signals of the future tightening of the Japanese central bank’s policies. In this regard, Deputy Governor of the Bank of Japan Ryozo Himino stated that the Japanese central bank plans to continue raising rates if the economy and inflation are in line with expectations. On the economic front, data released at the end of the week showed that core inflation in Tokyo accelerated to an 11-month high of 2.5% in January, reinforcing expectations for hawkish policy from the Bank of Japan.
In addition, Japanese retail sales exceeded expectations, industrial production rebounded, and the country’s unemployment rate fell unexpectedly.

Keep in mind that currency investors are waiting for new buying opportunities for the dollar against the Japanese yen, so be a good follower of the events of this important week
And this week, investors will closely analyse the summary of opinions from the last Bank of Japan meeting for insights into potential policy tightening this year.
After the US central bank kept interest rates unchanged. Amid expectations of a future dispute between Trump and Jerome Powell. In a decisive post on the Truth Social website, Trump attacked the Federal Reserve after the meeting. “Because Jay Powell and the Fed have failed to stop the problem they created with inflation, I will do so by unleashing American energy production, cutting regulation, rebalancing international trade, and re-igniting American manufacturing,” Trump wrote.
Meanwhile, it’s worth noting that Trump is not necessarily calling for lower interest rates and is proposing his own solutions independently of the Fed. This is a different approach from his first term and may be related to the recognition that inflation remains a risk. Other criticisms have been directed at the Fed. Trump continued by saying that “if the Fed had spent less time on diversity, equity, inclusion, gender ideology, ‘green’ energy, and fake climate change, inflation would never have been a problem.”
Overall, Trump has probably had more influence on these issues than on actual policy. While Powell claimed he had “not been in touch” with Trump, some reporters at the press conference asked him about some of the recent changes. As the BBC noted, “…the questions Powell faced about how the Fed would handle a new White House order to scrap its diversification programs – and why it had pulled out of a global group of central banks focused on the risks of climate change to the financial system – underscored the challenges he will face in keeping the bank above the political fray.”
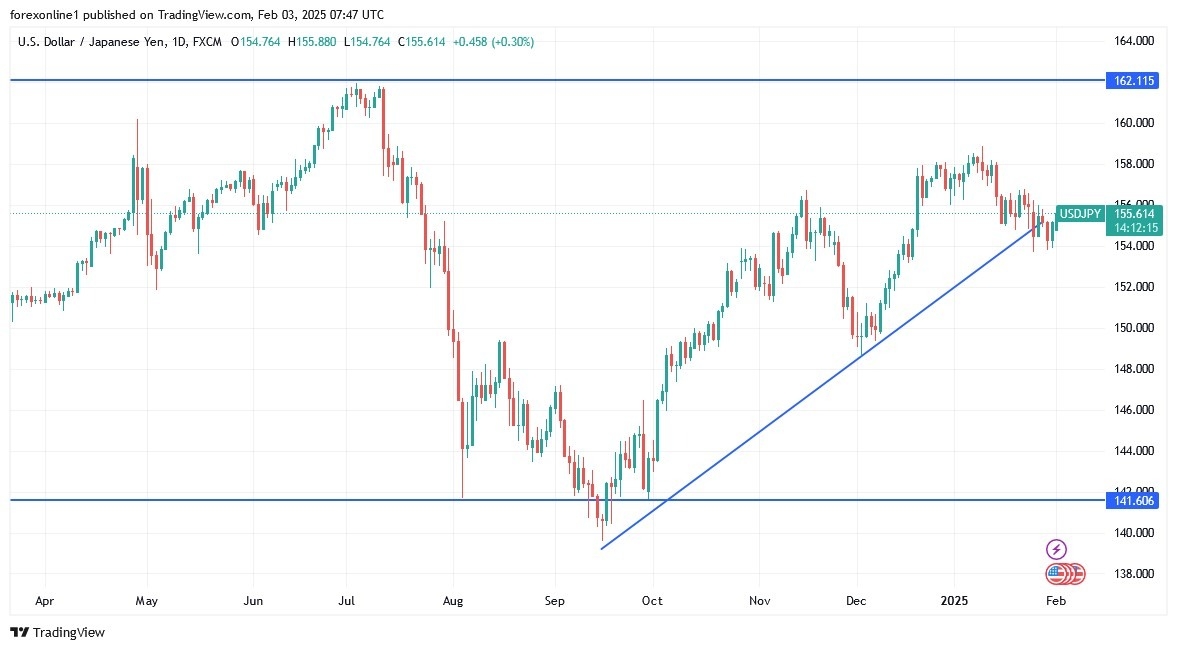
According to the performance on the daily chart, as is clear the USD/JPY pair is in an uptrend breakout mode. Therefore, forex investors may be looking for new opportunities to buy the USD/JPY. Technically, we see that the most appropriate levels for buying the USD/JPY currently are around the support levels of 153.30 and 151.90 respectively. Furthermore, as we always recommend not taking risks, no matter how strong the trading opportunities are. On the other hand, and over the same period of time, the resistance of 156.70 will remain the most important for bulls to control, and thus prepare for the psychological resistance of 160.00 again.
Want to trade our USD/JPY forex analysis and predictions? Here’s a list of forex brokers in Japan to check out.
Natural gas price took advantage of stochastic positivity that consolidates near 80 level now, to notice forming strong bullish rally this morning and surpass the MA55 at 3.260$, to start recording some gains by reaching 3.345$.
Now, the stability above 3.120$ support line and the continuous positive momentum coming by the major indicators support the chances of renewing the bullish attempts to target 3.420$ and 3.530$ levels.
The expected trading range for today is between 3.210$ and 3.420$
Trend forecast: Bullish
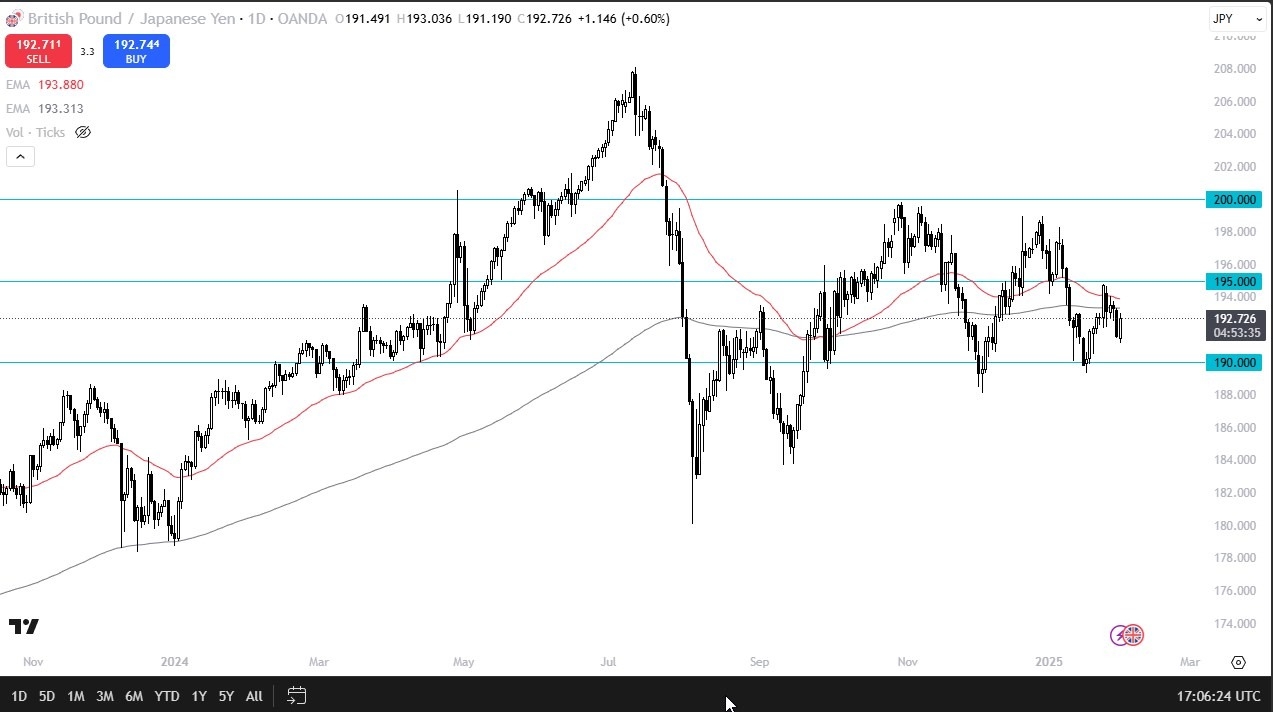
Ultimately, at this point in time, you have to be very cognizant of the fact that we have recently tested a major support level, and it now looks very much like a market that is trying to determine whether or not we can continue to climb. I think that’s probably the case given enough time, but I also recognize that there is a lot of technical resistance just above. Not only at the 200 day EMA, but also the 50 day EMA and then the 195 yen level. In general, I like this pair. I just don’t necessarily want to get overly exposed at this point.
This is very sensitive to risk appetite, and therefore I think you have to be very cautious because as we’ve seen on Friday, Donald Trump is willing to play games in the media, and that has the computers trading back and forth in a wild fashion. So, with all of that being said, I think you’ve got a scenario where a lot of traders are going to be looking at this basically as the carry trade and hoping for a lot of sideways action. The 190 yen level underneath is the bottom, and the 200 yen level above is the top. Right now, we’re closer to the bottom, so I’m more inclined to be a buyer, but again, not in huge, massive positions.
Begin trading our daily forecasts and analysis. Here is a list of Forex brokers in Japan to work with.
The Silver price (XAG/USD) tumbles to near $30.90 during the early European trading hours on Monday. The mounting fears of a global trade war following US President Donald Trump’s sweeping tariff measures boost the US Dollar (USD) broadly and exerts some selling pressure on the white metal.
According to the 4-hour chart, the bullish outlook of the white metal remains intact, with the price holding above the key 100-period Exponential Moving Averages (EMA). Nonetheless, the Relative Strength Index (RSI) hovers around the midline, suggesting that further consolidation cannot be ruled out.
The first downside target is located at $30.60, the 100-period EMA. Further south, the next contention level to watch is $30.40, the lower limit of the Bollinger Band. Extended losses will pave the way to the $30.00, psychological level, en route to $29.50, the low of January 13.
In the bullish case, the immediate resistance level emerges at $31.72, the high of January 31. The next hurdle is seen at the $31.90-$32.00 region, representing the upper limit of the Bollinger Band and the round mark.
Silver is a precious metal highly traded among investors. It has been historically used as a store of value and a medium of exchange. Although less popular than Gold, traders may turn to Silver to diversify their investment portfolio, for its intrinsic value or as a potential hedge during high-inflation periods. Investors can buy physical Silver, in coins or in bars, or trade it through vehicles such as Exchange Traded Funds, which track its price on international markets.
Silver prices can move due to a wide range of factors. Geopolitical instability or fears of a deep recession can make Silver price escalate due to its safe-haven status, although to a lesser extent than Gold’s. As a yieldless asset, Silver tends to rise with lower interest rates. Its moves also depend on how the US Dollar (USD) behaves as the asset is priced in dollars (XAG/USD). A strong Dollar tends to keep the price of Silver at bay, whereas a weaker Dollar is likely to propel prices up. Other factors such as investment demand, mining supply – Silver is much more abundant than Gold – and recycling rates can also affect prices.
Silver is widely used in industry, particularly in sectors such as electronics or solar energy, as it has one of the highest electric conductivity of all metals – more than Copper and Gold. A surge in demand can increase prices, while a decline tends to lower them. Dynamics in the US, Chinese and Indian economies can also contribute to price swings: for the US and particularly China, their big industrial sectors use Silver in various processes; in India, consumers’ demand for the precious metal for jewellery also plays a key role in setting prices.
Silver prices tend to follow Gold’s moves. When Gold prices rise, Silver typically follows suit, as their status as safe-haven assets is similar. The Gold/Silver ratio, which shows the number of ounces of Silver needed to equal the value of one ounce of Gold, may help to determine the relative valuation between both metals. Some investors may consider a high ratio as an indicator that Silver is undervalued, or Gold is overvalued. On the contrary, a low ratio might suggest that Gold is undervalued relative to Silver.
GBP/USD declined sharply at the weekly opening and touched its lowest level in two weeks near 1.2250. Although the pair corrects higher and trades above 1.2300 in the European session, it could have a difficult time gathering recovery momentum, with safe-haven flows dominating the action in financial markets.
The table below shows the percentage change of British Pound (GBP) against listed major currencies today. British Pound was the weakest against the Japanese Yen.
| USD | EUR | GBP | JPY | CAD | AUD | NZD | CHF | |
|---|---|---|---|---|---|---|---|---|
| USD | 1.10% | 0.69% | 0.20% | -0.16% | 1.06% | 0.51% | 0.06% | |
| EUR | -1.10% | -0.02% | 0.38% | 0.04% | 0.42% | 0.71% | 0.26% | |
| GBP | -0.69% | 0.02% | -0.69% | 0.06% | 0.44% | 0.73% | 0.30% | |
| JPY | -0.20% | -0.38% | 0.69% | -0.36% | 1.01% | 1.22% | 0.52% | |
| CAD | 0.16% | -0.04% | -0.06% | 0.36% | 0.12% | 0.67% | 0.24% | |
| AUD | -1.06% | -0.42% | -0.44% | -1.01% | -0.12% | 0.29% | -0.14% | |
| NZD | -0.51% | -0.71% | -0.73% | -1.22% | -0.67% | -0.29% | -0.43% | |
| CHF | -0.06% | -0.26% | -0.30% | -0.52% | -0.24% | 0.14% | 0.43% |
The heat map shows percentage changes of major currencies against each other. The base currency is picked from the left column, while the quote currency is picked from the top row. For example, if you pick the British Pound from the left column and move along the horizontal line to the US Dollar, the percentage change displayed in the box will represent GBP (base)/USD (quote).
Over the weekend, US President Donald Trump delivered on his tariff threats, announcing that they will impose sweeping 25% tariffs on Mexican and Canadian imports and 10% on Chinese goods entering the US. Additionally, Trump told reporters that he would “definitely” impose tariffs on European imports but didn’t provide any additional details.
Reflecting the negative impact of this development on risk mood, the UK’s FTSE 100 Index is down more than 1%. Furthermore, US stock index futures were last seen losing between 1.3% and 1.9%.
In the second half of the day, the ISM Manufacturing PMI data for January will be featured in the US economic calendar. Unless there is a significant divergence between the market expectation and the data, investors are likely to remain focused on risk perception. A bearish opening in Wall Street, followed by an extended selloff in major equity indexes could boost the USD and force GBP/USD to continue to push lower.
The Relative Strength Index (RSI) indicator on the 4-hour chart stays below 40, suggesting that the bearish bias stays intact. The pair was last seen trading near 1.2310, where the 100-period Simple Moving Average (SMA) and the ascending trend line align. In case GBP/USD fails to clear this hurdle, technical sellers could retain control. In this scenario, 1.2260-1.2250 (Fibonacci 23.6% retracement of the latest downtrend, daily low) could be seen as next support before 1.2160 (static level) and 1.2100 (static level, end-point of the downtrend).
On the upside, 1.2370 (Fibonacci 38.2% retracement), 1.2400 (200-period SMA) and 1.2450 (Fibonacci 50% retracement) could be seen as next resistance levels.
Tariffs are customs duties levied on certain merchandise imports or a category of products. Tariffs are designed to help local producers and manufacturers be more competitive in the market by providing a price advantage over similar goods that can be imported. Tariffs are widely used as tools of protectionism, along with trade barriers and import quotas.
Although tariffs and taxes both generate government revenue to fund public goods and services, they have several distinctions. Tariffs are prepaid at the port of entry, while taxes are paid at the time of purchase. Taxes are imposed on individual taxpayers and businesses, while tariffs are paid by importers.
There are two schools of thought among economists regarding the usage of tariffs. While some argue that tariffs are necessary to protect domestic industries and address trade imbalances, others see them as a harmful tool that could potentially drive prices higher over the long term and lead to a damaging trade war by encouraging tit-for-tat tariffs.
During the run-up to the presidential election in November 2024, Donald Trump made it clear that he intends to use tariffs to support the US economy and American producers. In 2024, Mexico, China and Canada accounted for 42% of total US imports. In this period, Mexico stood out as the top exporter with $466.6 billion, according to the US Census Bureau. Hence, Trump wants to focus on these three nations when imposing tariffs. He also plans to use the revenue generated through tariffs to lower personal income taxes.