The main category of Forex News.
You can use the search box below to find what you need.
[wd_asp id=1]
The main category of Forex News.
You can use the search box below to find what you need.
[wd_asp id=1]
According to recent forex market trading, the US dollar declined to record its weakest performance in more than a year last week, as investors reduced their expectations for imposing comprehensive tariffs on US imports, which markets considered the most positive policy that Donald Trump could implement. Overall, Trump’s victory in November accelerated the rise of the US dollar index, as investors considered such a scenario. After a week in office, traders are increasingly certain that the comprehensive tariffs will not be implemented.
Instead, it became clear that US tariffs would be used as part of a geopolitical bargaining tool, allowing for negotiations and avoiding the worst outcomes from a trade perspective. In this regard, the transactional approach to tariffs was revealed on Sunday when Trump threatened Colombia with a 50% tariff on imports after refusing to allow a deportation flight to Colombia to land. The Colombian government quickly abandoned its position, and tariffs are now out of the picture.
As for the Eurozone, it appears that Trump will drop the tariff threat if European countries commit to buying more US oil and gas. That is not a huge hurdle to overcome for a region that is almost entirely devoid of its own oil and gas production. The developments therefore reduce the chances of reaching parity between the Euro and the US Dollar, although it should be noted that the downward exchange rate trend remains intact from a multi-week perspective and we may just see a pullback in the overbought US Dollar.
Meanwhile, resuming selling remains a high-risk outcome for the first half of 2025.

The Euro-Dollar will remain in its current range until the reaction to the central bank announcements this week and the signals coming from the US administration’s policies, so always be careful and do not take risks.
This week, the US Federal Reserve meeting comes amid Trump’s speech in Davos where he explicitly called for a cut in US interest rates, confirming that the Federal Reserve will face a more interventionist White House. As is known, the US Federal Reserve is independent, but verbal pressure from the executive branch could lead to 50-50 wrong decisions on the dovish side, i.e. more cuts than would have been the case previously. This is negative for the US Dollar against other major currencies.
The expectations are that the Federal Reserve will leave US interest rates unchanged, saying that more time is needed to reflect on the strong nature of the US economy and the impact of previous interest rate cuts. Concurrently, the market is pricing in just one cut this year A rate cut is essential to boost growth in the eurozone economy. Moreover, inflationary pressures remain stubbornly above the European Central Bank’s 2.0% target.
The ECB will therefore welcome last week’s unexpectedly higher-than-expected PMI reading, which suggested that the eurozone’s economic data pulse has bottomed out. This should allow the ECB to express some optimism and respond to calls for an acceleration in the pace of cuts, which could boost the euro exchange rate.
Furthermore, this could allow the EUR/USD pair to recover above the 1.05 resistance for a while.
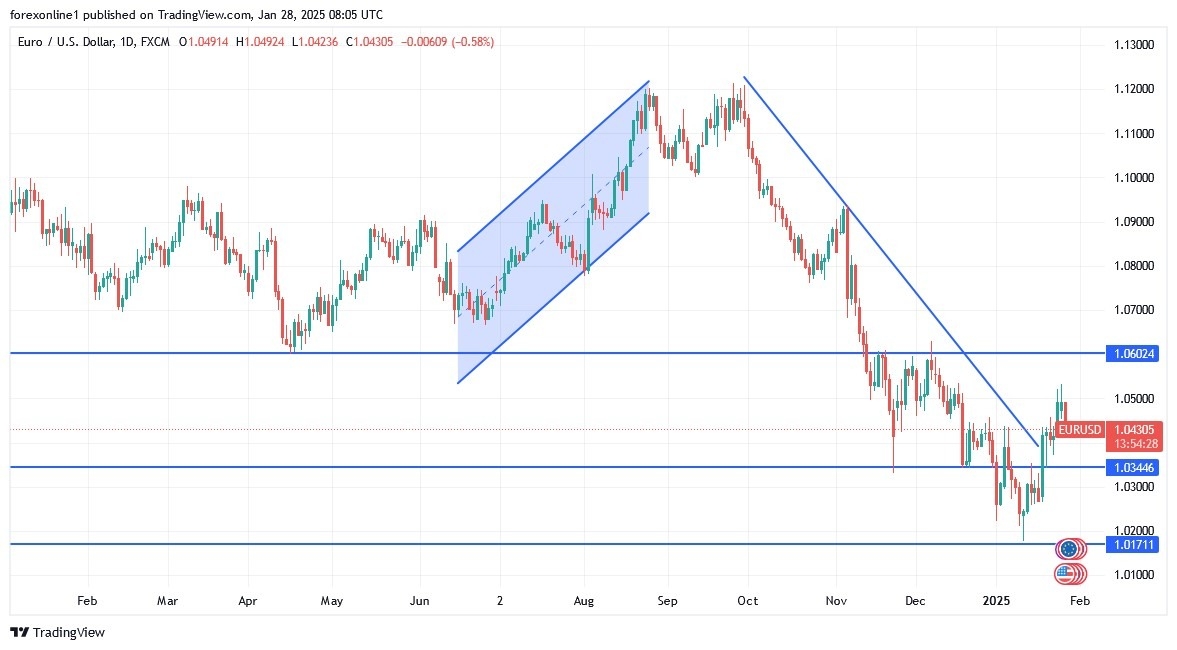
The EUR/USD exchange rate is trading at 1.0490 after last week’s 2.20% gain, its biggest weekly advance since July 2023. The advanced technical setup suggests that the euro has broken the downtrend line that defined the September-January sell-off, which could increase confidence in a short-term interim bottom. Now, EUR/USD has moved above its nine-day exponential moving average (EMA) as the bounce grows, confirming bullish momentum on the multi-day forecast horizon. However, the advance late last week means that the spot has deviated quite far from the nine-day EMA (currently at 1.0408), suggesting some neutrality towards this level is likely in the next couple of days.
EUR/USD is expected to hold between 1.0409 and 1.05 in the first part of the week, with a break higher in the latter part of the week likely to send it higher towards the near-term target of 1.0570. This level represents the 38.2% Fibonacci retracement of the September and January selloffs. Overall, this gain will depend on what the US Federal Reserve says about interest rate expectations at its policy meeting tomorrow, Wednesday, and what the European Central Bank says and does on Thursday. Furthermore, Donald Trump’s ongoing efforts to shape America and the world order in his image will overshadow the risks of the two central bank events. Ultimately, expect more tariff threats and musings from the US President to provide volatility in the near term.
Ready to trade our EUR/USD daily forecast? Here’s a list of some of the top forex brokers in Europe to check out.
The GBPCAD price succeeded to confirm the continuation of the positivity by consolidating within the bullish channel, to notice breaching 1.7810$ barrier and achieving many gains by rallying towards 1.7990.
The current negative rebound towards 1.7920 hints the attempt to gather the required additional positive momentum to resume the bullish attack, also, 1.7880 level attempt to form the additional support will reinforce the chances of forming bullish waves to target 1.8030 and 1.8080 levels.
The expected trading range for today is between 1.7880 and 1.8030
Trend forecast: Bullish
January 28, 2025 – Written by Frank Davies
STORY LINK Pound to Euro (GBP/EUR) Exchange Rate Muted despite Upbeat German Data
The Pound Sterling was trapped in a narrow range against the Euro on Monday despite the release of some better-than-expected German data.
At the time of writing, the GBP/EUR exchange rate was trading at around €1.1889, virtually unchanged from Monday’s opening levels.
Although flat against the Pound (GBP), the Euro (EUR) gained ground against several of its counterparts on Monday following the release of Germany’s latest IFO business climate index.
The index ticked up in January, rising from 84.7, the lowest level since May 2020, to 85.1, surpassing expectations that it would remain unchanged.
This positive data from the Eurozone’s largest economy bolstered the Euro at the beginning of the week, especially amid a generally cautious market sentiment.
As a safe-haven currency, the Euro also benefited from the risk-averse trading environment on Monday.
On Monday, the Pound stayed largely muted against most of its peers, owing to a lack of fresh economic data releases.

This absence of new information left Sterling without a clear direction at the start of the week, however, saw the Pound remain relatively steady.
Given the anticipated scarcity of UK economic data throughout the week, it’s likely that the Pound will continue to oscillate without any major economic drivers influencing its movement.
Looking ahead to Tuesday, the main factor influencing the Pound Euro exchange rate will likely be several speeches from European Central Bank (ECB) officials.
Both ECB official Piero Cipollone and ECB President Christine Lagarde are set to speak on Tuesday.
If either policymaker hints at a potential ECB interest rate cut, EUR exchange rates could weaken as a result.
For the Pound, with UK data remaining sparse, GBP exchange rates are likely to continue struggling to find a clear direction this week.
International Money Transfer? Ask our resident FX expert a money transfer question or try John’s new, free, no-obligation personal service! ,where he helps every step of the way,
ensuring you get the best exchange rates on your currency requirements.
TAGS: Pound Euro Forecasts
Gold price licks its wounds following the sharp pullback from three-month highs just shy of the all-time peak of $2,790. Gold trades take account of the latest tariff talks by US President Donald Trump and his administration as attention turns toward mid-tier US economic data and Federal Reserve (Fed) policy announcements.
Despite the unabated haven demand for the US Dollar (USD) amid mounting trade war fears and the extended sell-off on global stocks. The upswing in the US Treasury bond yields on reports of the White House pausing all federal grants add to the bearish undertone in Gold price.
Late Monday, US Treasury Secretary Scott Bessent called for new universal tariffs on US imports, starting at 2.5% and rising gradually, per the Financial Times (FT). Meanwhile, President Trump noted that he plans to impose tariffs on imports of computer chips, pharmaceuticals, steel, aluminum, and copper. He added that he “wants tariffs “much bigger” than 2.5%” as Treasury Secretary Bessent proposed.
The continued tariff threats by the Trump administration continue to dent risk sentiment. Meanwhile, Asian markets are still reeling from the pain of China’s low-cost artificial intelligence (AI) model – DeepSeek-led global AI sell-off, which smashed current AI leader Nvidia by roughly 18% on Tuesday.
Looking ahead, traders look forward to the mid-tier US Durable Goods Orders and Consumer Confidence data for fresh trading impetus. However, US President Donald Trump’s tariff threats and the sentiment on Wall Street will play a key role in driving markets, eventually impacting the value of the USD and the Gold price.
Markets will also remain on a cautious footing as the Fed begins its two-day monetary policy later this Tuesday, with the policy decision and Chairman Jerome Powell’s press conference due on Wednesday.
The daily chart shows that the short-term technical outlook remains constructive for Gold price despite the long-due correction.
Gold price’s failure to seek daily candlestick closing above the symmetrical triangle target of $2,785 warrants caution for buyers.
However, the 14-day Relative Strength Index (RSI) holds comfortably above the midline, currently near 61, keeping Gold buyers hopeful.
Adding credence to the bullish potential, the 50-day SMA closed above the 100-day SMA last Thursday, confirming a Bull Cross.
Gold price must seek a daily closing above the record high of $2,790 to set a new highest level ever above $2,800. Buyers will then aim for the $2,850 psychological level.
On the downside, the immediate support will be seen at the previous day’s low of $2,731.
Sellers will then aim for the $2,700 round level, below which the 21-day SMA at $2,691 will be challenged.
Gold has played a key role in human’s history as it has been widely used as a store of value and medium of exchange. Currently, apart from its shine and usage for jewelry, the precious metal is widely seen as a safe-haven asset, meaning that it is considered a good investment during turbulent times. Gold is also widely seen as a hedge against inflation and against depreciating currencies as it doesn’t rely on any specific issuer or government.
Central banks are the biggest Gold holders. In their aim to support their currencies in turbulent times, central banks tend to diversify their reserves and buy Gold to improve the perceived strength of the economy and the currency. High Gold reserves can be a source of trust for a country’s solvency. Central banks added 1,136 tonnes of Gold worth around $70 billion to their reserves in 2022, according to data from the World Gold Council. This is the highest yearly purchase since records began. Central banks from emerging economies such as China, India and Turkey are quickly increasing their Gold reserves.
Gold has an inverse correlation with the US Dollar and US Treasuries, which are both major reserve and safe-haven assets. When the Dollar depreciates, Gold tends to rise, enabling investors and central banks to diversify their assets in turbulent times. Gold is also inversely correlated with risk assets. A rally in the stock market tends to weaken Gold price, while sell-offs in riskier markets tend to favor the precious metal.
The price can move due to a wide range of factors. Geopolitical instability or fears of a deep recession can quickly make Gold price escalate due to its safe-haven status. As a yield-less asset, Gold tends to rise with lower interest rates, while higher cost of money usually weighs down on the yellow metal. Still, most moves depend on how the US Dollar (USD) behaves as the asset is priced in dollars (XAU/USD). A strong Dollar tends to keep the price of Gold controlled, whereas a weaker Dollar is likely to push Gold prices up.
GBP/USD climbed to its highest level in three weeks above 1.2500 on Monday and posted gains for the third consecutive day. Early Tuesday, however, the pair reversed its direction and declined below 1.2450.
The table below shows the percentage change of British Pound (GBP) against listed major currencies today. British Pound was the weakest against the US Dollar.
| USD | EUR | GBP | JPY | CAD | AUD | NZD | CHF | |
|---|---|---|---|---|---|---|---|---|
| USD | 0.52% | 0.34% | 0.56% | 0.17% | 0.57% | 0.51% | 0.44% | |
| EUR | -0.52% | -0.18% | 0.03% | -0.35% | 0.04% | -0.01% | -0.08% | |
| GBP | -0.34% | 0.18% | 0.23% | -0.17% | 0.19% | 0.16% | 0.10% | |
| JPY | -0.56% | -0.03% | -0.23% | -0.39% | 0.00% | -0.07% | -0.13% | |
| CAD | -0.17% | 0.35% | 0.17% | 0.39% | 0.40% | 0.33% | 0.27% | |
| AUD | -0.57% | -0.04% | -0.19% | -0.00% | -0.40% | -0.06% | -0.13% | |
| NZD | -0.51% | 0.01% | -0.16% | 0.07% | -0.33% | 0.06% | -0.07% | |
| CHF | -0.44% | 0.08% | -0.10% | 0.13% | -0.27% | 0.13% | 0.07% |
The heat map shows percentage changes of major currencies against each other. The base currency is picked from the left column, while the quote currency is picked from the top row. For example, if you pick the British Pound from the left column and move along the horizontal line to the US Dollar, the percentage change displayed in the box will represent GBP (base)/USD (quote).
In the absence of high-tier data releases, investors continue to react to headlines surrounding US President Donald Trump’s trade policy.
US Treasury Secretary Scott Bessent said late Monday that he is pushing for universal tariffs on imports to start at 2.5% and rise gradually, per the Financial Times. While speaking to reporters in the early Asian session on Tuesday, President Trump responded to these remarks, saying that he wants tariffs “much bigger than 2.5%.” Moreover, Trump noted they are going to be placing tariffs on foreign production of computer chips, semiconductors and pharmaceuticals “in the very near future,” to return production of these essential goods to the US.
Later in the day, December Durable Goods Orders and January CB Consumer Confidence Index data will be featured in the US economic calendar. More importantly, the Federal Reserve’s (Fed) two-day monetary policy meeting will start on Tuesday. Before the Fed announces policy decisions on Wednesday, market participants could stay focused on comments from Trump, or his administration, on tariffs.
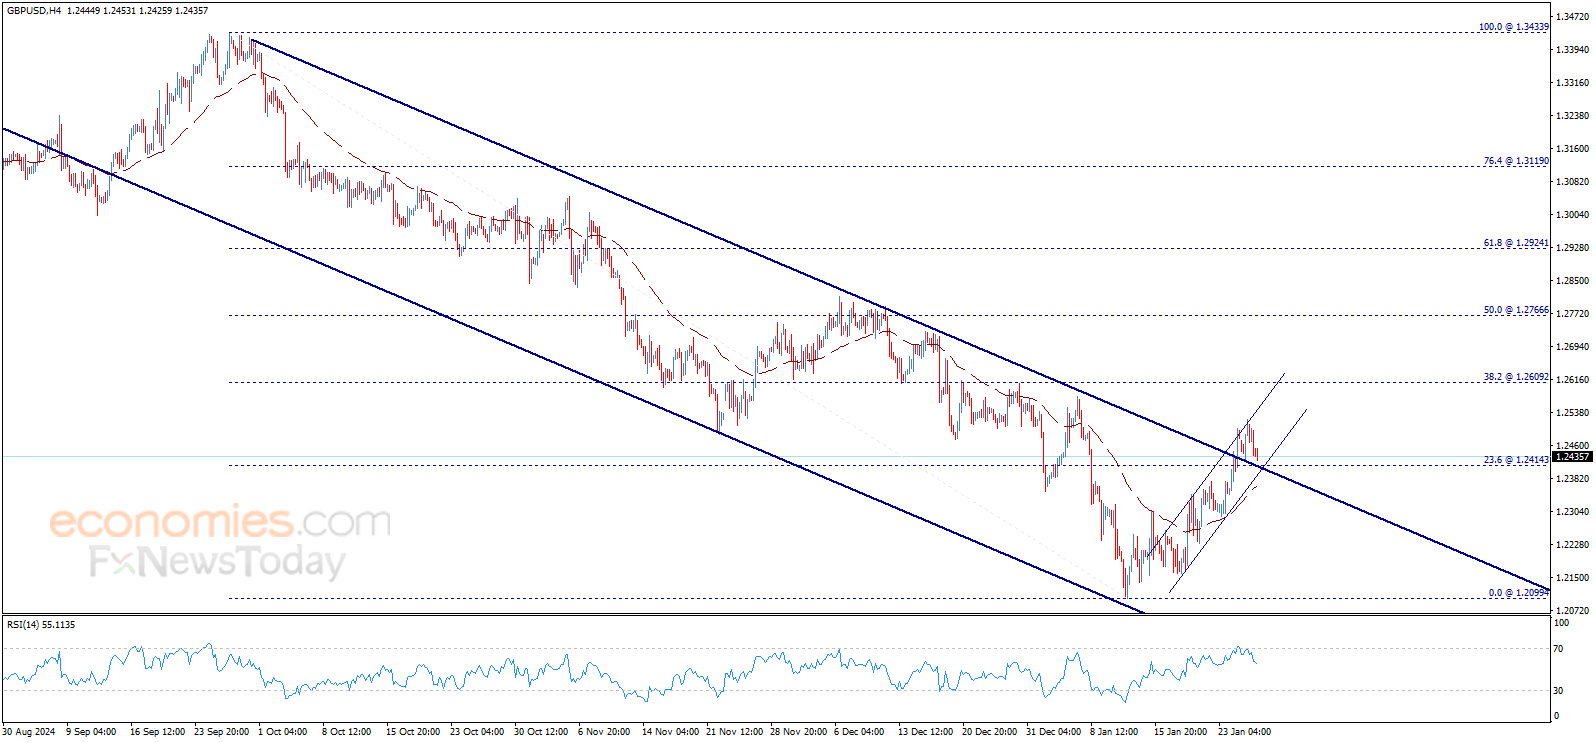
The Relative Strength Index (RSI) indicator on the 4-hour chart retreated but managed to hold comfortably above 50, reflecting sellers’ hesitancy.
In case GBP/USD confirms 1.2450 as resistance, where the Fibonacci 50% retracement level of the latest downtrend and the 200-period Simple Moving Average (SMA) align, additional losses toward 1.2400 (static level, round level), 1.2370 (Fibonacci 38.2% retracement) and 1.2320 (100-period SMA) could be seen.
If GBP/USD stabilizes above 1.2450, resistances could be spotted at 1.2500 (round level, static level) and 1.2530 (Fibonacci 61.8% retracement).
Silver price (XAG/USD) recovers some of its intraday losses and strives to hold the key level of $30.00 in Tuesday’s European session. The white metal trades with caution amid a dismal market sentiment. The marker sentiment is deeply risk-averse as global technology, power, and data center stocks have faced an intense sell-off as market experts believe that Chinese Deepseek’s low-cost Artificial Intelligence (AI) model could challenge the dominance of top chatbots like OpenAI and Meta.
Technically, the appeal of precious metals increases in a highly risky market environment. However, a significant surge in the US Dollar (USD) and bond yields has restrictive the upside in the Silver price. The safe-haven demand for the US Dollar has increased significantly amid a sharp sell-off in technology stocks. The US Dollar Index (DXY), which tracks the Greenback’s value against six major currencies, jumps to near 108.00.
Meanwhile, 10-year US Treasury yields jump to near 4.56% ahead of the Federal Reserve’s (Fed) monetary policy announcement on Wednesday. The Fed is certain to announce a temporary pause in the policy-easing cycle and leave interest rates unchanged in the range of 4.25%-4.50%, according to the CME FedWatch tool.
Investors will pay close attention to Fed Chair Jerome Powell’s press conference to know for how long the Fed will keep borrowing rates steady. Market participants would be keen to know the impact of potential tariffs by President Donald Trump on the monetary policy stance and the economy.
Silver price struggles near the 50-day Exponential Moving Average (EMA) around $30.40. The white metal continues to face pressure near the upward-sloping trendline around $30.90, which is plotted from the 29 February 2024 low of $22.30 on a daily timeframe.
The broader outlook of the Silver price remains firm above the 200-day Exponential Moving Average (EMA), which trades around $29.50.
The 14-day Relative Strength Index (RSI) oscillates in the 40.00-60.00 range, suggesting a sideways trend.
Silver is a precious metal highly traded among investors. It has been historically used as a store of value and a medium of exchange. Although less popular than Gold, traders may turn to Silver to diversify their investment portfolio, for its intrinsic value or as a potential hedge during high-inflation periods. Investors can buy physical Silver, in coins or in bars, or trade it through vehicles such as Exchange Traded Funds, which track its price on international markets.
Silver prices can move due to a wide range of factors. Geopolitical instability or fears of a deep recession can make Silver price escalate due to its safe-haven status, although to a lesser extent than Gold’s. As a yieldless asset, Silver tends to rise with lower interest rates. Its moves also depend on how the US Dollar (USD) behaves as the asset is priced in dollars (XAG/USD). A strong Dollar tends to keep the price of Silver at bay, whereas a weaker Dollar is likely to propel prices up. Other factors such as investment demand, mining supply – Silver is much more abundant than Gold – and recycling rates can also affect prices.
Silver is widely used in industry, particularly in sectors such as electronics or solar energy, as it has one of the highest electric conductivity of all metals – more than Copper and Gold. A surge in demand can increase prices, while a decline tends to lower them. Dynamics in the US, Chinese and Indian economies can also contribute to price swings: for the US and particularly China, their big industrial sectors use Silver in various processes; in India, consumers’ demand for the precious metal for jewellery also plays a key role in setting prices.
Silver prices tend to follow Gold’s moves. When Gold prices rise, Silver typically follows suit, as their status as safe-haven assets is similar. The Gold/Silver ratio, which shows the number of ounces of Silver needed to equal the value of one ounce of Gold, may help to determine the relative valuation between both metals. Some investors may consider a high ratio as an indicator that Silver is undervalued, or Gold is overvalued. On the contrary, a low ratio might suggest that Gold is undervalued relative to Silver.
The USD/JPY price analysis shows the dollar regaining its footing against the yen as market participants look forward to the FOMC meeting. At the same time, Trump’s remarks on tariffs in the previous session revived the greenback.
-Are you looking for automated trading? Check our detailed guide-
On Monday, the yen rallied as investors scrambled for safety after news of a free Chinese AI model shook markets. Risks appetite plunged after reports revealed that DeepSeek, a Chinese company, was introducing an AI model that uses less data and lower-cost chips.
The AI industry in the US has supported a strong rally in equities in recent years. Therefore, the threat of low cost AI in China significantly hurts the risk appetite. However, this was bullish for the yen, considered a traditional safe-haven.
Nevertheless, there was some support for the dollar when Trump announced plans to impose tariffs on steel, imported computer chips, and pharmaceuticals. As a result, demand for locally produced goods will increase, boosting the economy.
At the same time, market participants eagerly awaited the FOMC policy meeting. Economists expect the Fed to maintain interest rates. Moreover, analysts believe policymakers might maintain a cautious tone. Trump’s policies and their impact on the economy remain uncertain. Therefore, the US Central Bank might prefer a gradual approach as the economy adjusts to the new administration. Such an outlook will likely boost the dollar.
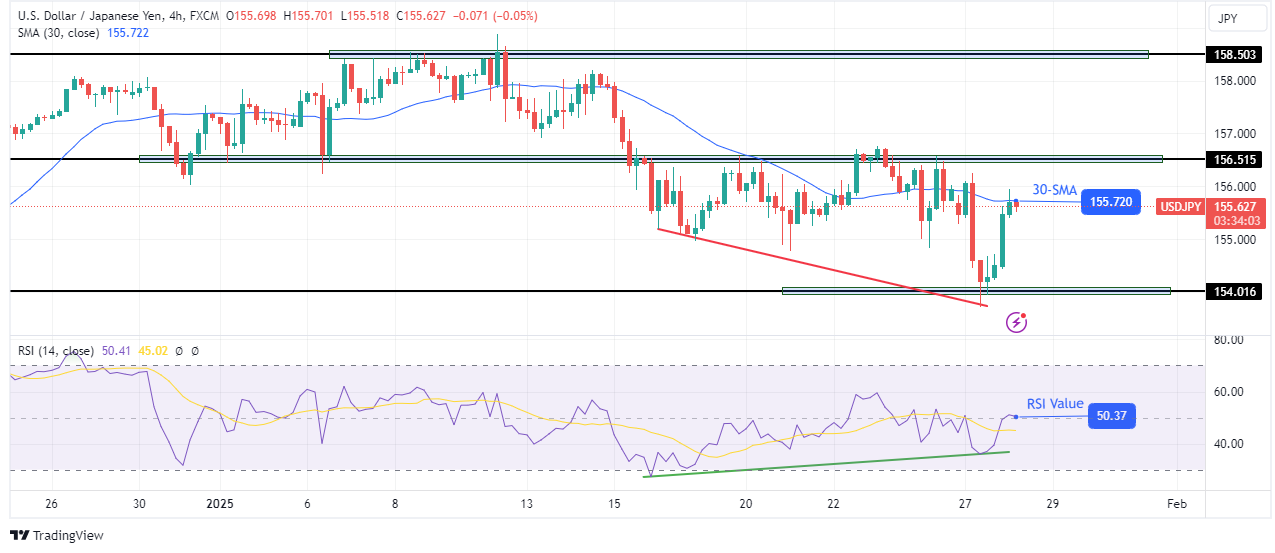
On the technical side, the USD/JPY price has rebounded and paused at the 30-SMA resistance. Meanwhile, the RSI trades slightly above 50, showing bulls are gaining momentum. The previous downtrend started showing weakness when the price punctured the 30-SMA resistance. However, bulls were unable to break above the 156.51 resistance level. As a result, the price fell to a lower low near the 154.01 support level.
-Are you looking for forex robots? Check our detailed guide-
Although price action indicated a continuation of the downtrend, the RSI made a bullish divergence, showing fading momentum. Consequently, bulls resurfaced at the 154.01 support, pushing the price to the 30-SMA.
Given the divergence, the price will likely breach the SMA resistance. However, bulls must also break above 156.51 to confirm a reversal. If this happens, USD/JPY will retest the 158.50 resistance level.
Looking to trade forex now? Invest at eToro!
67% of retail investor accounts lose money when trading CFDs with this provider. You should consider whether you can afford to take the high risk of losing your money.
Novavax’s stock price (NVAX) edged higher in the intraday levels, buoyed by trading above the 50-day SMA, and with positive signals from the RSI, while trading alongside the secondary upward trend line in the short term.
Therefore we expect more gains for the price, targeting the resistance of $12.23, provided the support of $8.40 holds on.
Trend forecast for today: Bullish
Ethereum price (ETHUSD) shows new positive trades to test 3222.00$ level again, getting positive signals through stochastic to support the chances of continuing the rise in the upcoming sessions, but we notice that the EMA50 forms negative pressure against the price, to face contradiction between the technical indicators that makes us prefer to stay aside until we get clearer signal for the next trend, through breaching 3222.00$ resistance or breaking 3017.30$ support.
Note that breaching the mentioned resistance will lead the price to achieve more gains and head towards 3425.50$ as a main positive target, while breaking the support represents the key to suffer new losses that reach 2765.00$.
The expected trading range for today is between 3030.00$ support and 3340.00$ resistance.
Trend forecast: Neutral
The lack of the positive momentum led the EURJPY pair to provide mixed trades, to move within tight track represented by 163.25 resistance and 161.60 support.
Also, the recent contradiction between the major indicators reinforces the domination of the sideways bias, to stay neutral until surpassing one of the major levels, noting that succeeding to breach the resistance will confirm moving to the bullish track to start achieving many gains that start at 164.00, while breaking the support and holding below it will force the price to suffer many losses by moving towards 161.00 first.
The expected trading range for today is between 161.65 and 163.25
Trend forecast: Neutral