The main category of Forex News.
You can use the search box below to find what you need.
[wd_asp id=1]
The main category of Forex News.
You can use the search box below to find what you need.
[wd_asp id=1]
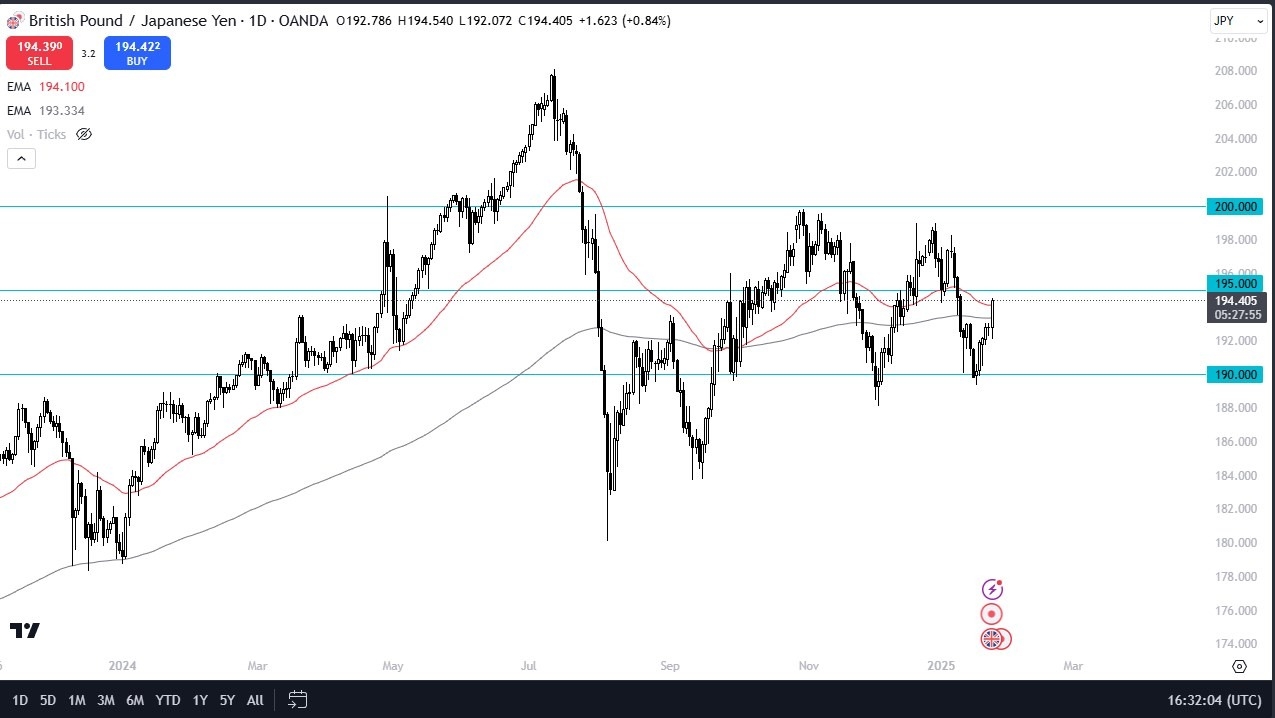
The 195 yen level is an area that’s been a bit of a barrier in the past. So, it’ll be interesting to see how we behave once we get there. If we can break above that level and go looking to the 200 yen level, I expect a major fight. The bank of Japan overnight did raise rates, but they made it sound like they’re pretty neutral at this point. And if that’s going to be the case, that means the interest rate differential and the carry trade will still be a thing. As long as that ends up working out in favor of traders, then I just don’t see how anything other than upward momentum against the yen is seen by most currencies.

I have no interest whatsoever in getting too cute with this, but I do recognize that a short-term pullback might be what you’re looking for, for a little bit of a buying opportunity. I also believe that the British pound, although much stronger than the Japanese yen may lose a little bit of momentum. So, we may see more of a grind to the upside than anything else. I do not expect anything other than consolidation between 190 yen on the bottom and 200 yen on the top, at least as far as I can reasonably look to the future. With this, I am neutral and positive more than anything else. Tactical short-term trades are probably the way forward.
Begin trading our daily forecasts and analysis. Here is a list of Forex brokers in Japan to work with.
The table below shows the percentage change of Euro (EUR) against listed major currencies today. Euro was the strongest against the New Zealand Dollar.
| USD | EUR | GBP | JPY | CAD | AUD | NZD | CHF | |
|---|---|---|---|---|---|---|---|---|
| USD | -0.03% | 0.07% | -0.68% | 0.20% | 0.58% | 0.48% | -0.48% | |
| EUR | 0.03% | 0.17% | -0.54% | 0.37% | 0.62% | 0.63% | -0.35% | |
| GBP | -0.07% | -0.17% | -1.00% | 0.20% | 0.45% | 0.48% | -0.51% | |
| JPY | 0.68% | 0.54% | 1.00% | 0.94% | 1.46% | 1.41% | 0.36% | |
| CAD | -0.20% | -0.37% | -0.20% | -0.94% | 0.18% | 0.28% | -0.71% | |
| AUD | -0.58% | -0.62% | -0.45% | -1.46% | -0.18% | 0.05% | -0.92% | |
| NZD | -0.48% | -0.63% | -0.48% | -1.41% | -0.28% | -0.05% | -1.20% | |
| CHF | 0.48% | 0.35% | 0.51% | -0.36% | 0.71% | 0.92% | 1.20% |
The heat map shows percentage changes of major currencies against each other. The base currency is picked from the left column, while the quote currency is picked from the top row. For example, if you pick the Euro from the left column and move along the horizontal line to the US Dollar, the percentage change displayed in the box will represent EUR (base)/USD (quote).
Spot Gold is under strong selling pressure at the beginning of the week, trading around the $2,730 mark in the American session. The bright metal was unable to advance against a battered US Dollar (USD) despite a dismal market mood.
News coming from China undermined the market sentiment. On the one hand, the country reported that business output declined in January. The NBS Manufacturing Purchasing Managers Index (PMI) printed at 49.1, below the 50.1 posted in December. The Non-Manufacturing PMI came in at 50.2, down from the previous 52.2.
Asian stock markets gained amid news related to AI developments while weighing on their overseas counterparts. DeepSeek, a Chinese AI company, gained traction and dragged alongside the tech sector. The same rally, however, fueled concerns about cheaper AI from China threatening US tech dominance. At the time being, Wall Street remains in the red, albeit most major indexes trimmed a good chunk of their early losses.
Speculative interest will now shift the focus to the upcoming central banks’ decision. The Federal Reserve (Fed) will announce its decision on monetary policy on Wednesday, while the European Central Bank (ECB) will follow on Thursday. At the same time, the United States (US) will release the preliminary estimate of the Q4 Gross Domestic Product (GDP). Annualized growth is foreseen at 2.8%, easing from the 3.1% posted in Q3 yet still indicating healthy progress.
From a technical point of view, XAU/USD seems to be correcting overbought conditions. In the daily chart, technical indicators retreat from extreme peaks, heading firmly lower albeit well above their mid-lines, not enough to support a sustained bearish continuation. At the same time, the 20 Simple Moving Average (SMA) maintains a bullish slope, providing dynamic support at around $2,687.70. The 100 and 200 SMAs, in the meantime, have lost their upward strength, far below the shorter one.
In the near term, and according to the 4-hour chart, XAU/USD is poised to extend its slide. The pair accelerated sharply lower once it broke below a now bearish 20 SMA. At the same time, technical indicators head south almost vertically within negative levels without showing signs of downward exhaustion. Still, Gold remains far above its 100 and 200 SMAs, supporting the case of an ongoing correction rather than anticipating a continued slide.
Support levels: 2,724.60 2,712.90 2,700.00
Resistance levels: 2,747.30 2,764.85 2,777.30
January 27, 2025 – Written by David Woodsmith
STORY LINK Pound Sterling to Dollar Rate Hits 1.247 as UK Government Talks up Economy
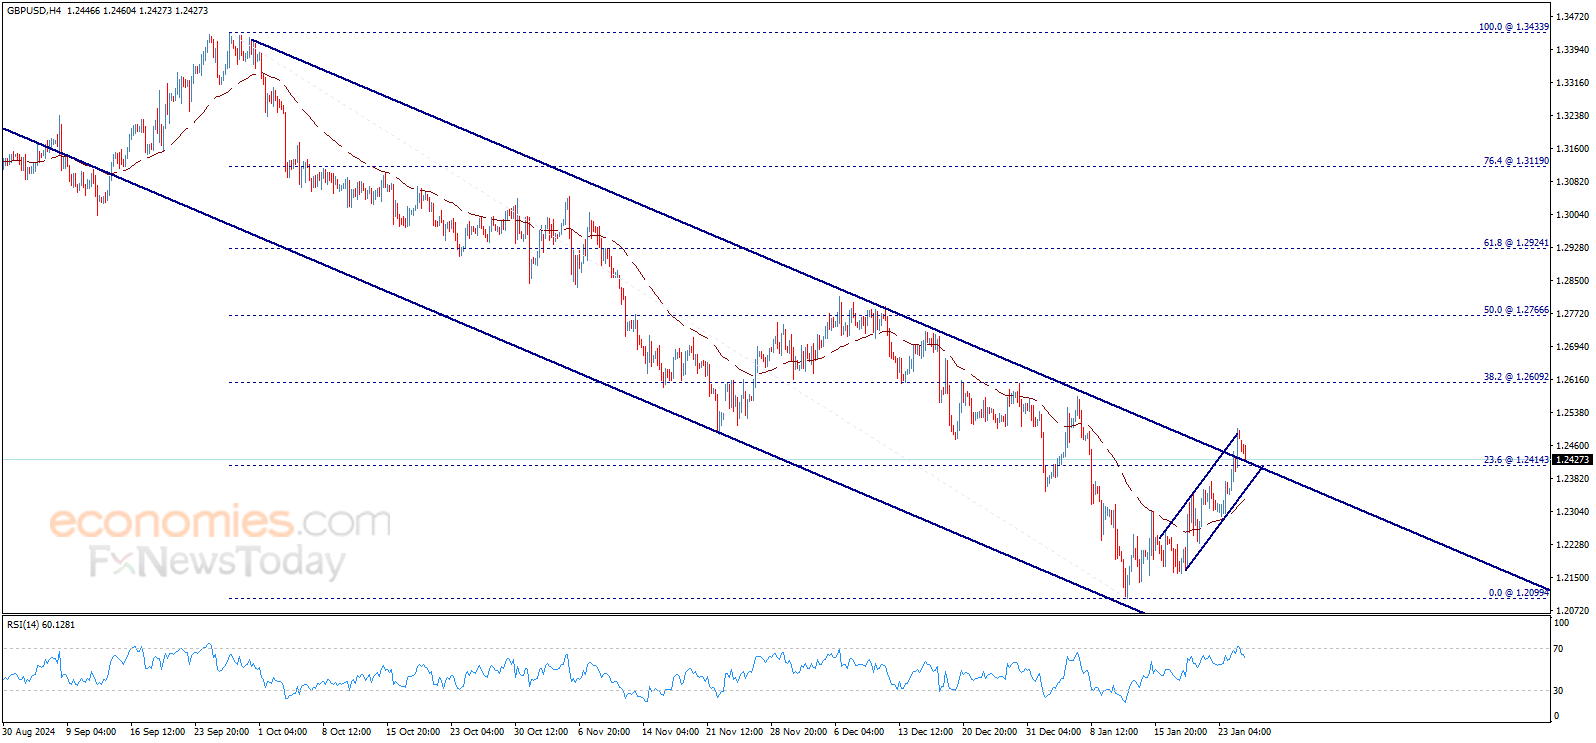
The Pound to Dollar exchange rate (GBP/USD) hit 20-day highs just above 1.2520 before settling just above 1.2500.
The government’s shift in stance to talk up the economy and put renewed focus on the growth outlook had some impact in supporting Pound sentiment, although there are still important reservations over the near-term outlook.
COT data, released by the CFTC also recorded a net short position in speculative Pound positions, the first short position since May 2024.
This suggests the potential for short covering if the UK economic news is more positive.
According to Scotiabank. The GBP/USD outlook is bullish with the third leg of a bullish morning star candle pattern on the weekly chart.
It added; “Solid gains again today so far, at least, support the more positive technical outlook and the prospect of a retracement towards the 1.26/1.27 range.”
In contrast, ING and MUFG both expect GBP/USD gains will stall below 1.2600.

The dollar jumped overnight due to the US-Colombia spat over the return of illegal immigrants.
President Trump threatened to impose 25% tariffs on Colombian exports to the US after the Colombian government refused to allow flights to land.
The dollar lost ground after Colombia backed down and the dollar then lost further ground as US yields dipped lower.
US equities came under pressure after Chinese company DeepSeek stated that it could produce a low-cost, low-power AI system.
There were concerns that this would pose a threat to US tech dominance with the Nasdaq index sliding 3%.
The Pound to Euro exchange rate (GBP/EUR) consolidated just below the 1.1900 level.
Domestically, research firm Incomes Data Research (IDR) found that 69% of employers are likely to slow wage growth, with over half “extremely likely” to do so. One-third may cut jobs, while others will absorb costs through lower profits.
There are very strong expectations that the Bank of England will cut interest rates next week, although the medium-term outlook remains extremely uncertain.
Within Europe, the German IFO index improved to 85.1 for January from 84.7 previously and marginally above consensus forecasts of 84.9.
There was a net improvement in current conditions, but the expectations component declined marginally, limiting Euro support.
Markets expect that the ECB will announce a further 25 basis-point interest rate cut this week, taking to deposit rate to 2.75%.
International Money Transfer? Ask our resident FX expert a money transfer question or try John’s new, free, no-obligation personal service! ,where he helps every step of the way,
ensuring you get the best exchange rates on your currency requirements.
TAGS: Pound Dollar Forecasts
Ethereum price (ETHUSD) declined strongly to succeed touching our suggested negative target at 3017.30$, and the way seems open to surpass this level and suffer additional losses on the intraday and short-term basis, noting that confirming the break will push the price towards 2765.00$ as a next negative station.
On the other hand, we should note that the consolidation of 3017.30$ level against the current negative pressure will lead the price to attempt to recover and build bullish wave that targets testing 3222.00$ areas initially.
The expected trading range for today is between 2950.00$ support and 3200.00$ resistance.
Trend forecast: Bearish
The Bank of Japan recently raised interest rates to their highest level since the 2008 global financial crisis and revised inflation forecasts upward. The benchmark interest rate was raised by 25 basis points to 0.5%. This was the first interest rate increase since July. Kazuo Ueda, the Governor of the Bank of Japan, affirmed that monetary authorities will continue to raise rates amid higher-than-expected consumer price and wage inflation pressures. However, Ueda noted that the Bank of Japan is not on a predetermined path. He added, “We don’t have any predetermined idea. We will decide at each policy meeting by considering economic developments, prices and risks
Overall, Japan, the world’s fourth-largest economy, has suffered years of deflation and stagnant growth. With U.S. President Donald Trump’s tariffs likely to cast uncertainty over the global economy, Tokyo and others may have to respond.
For now, Ueda notes that there is no clear plan from the United States yet. “Various data shows that the U.S. economy is doing well. Meanwhile, Markets have been stabling as the general direction of Trump’s policies becomes clearer. There is very high uncertainty. Once there is more clarity, we will take that into account and reflect it in our policy decision,” Ueda said.
Following the Japanese rate hike, yields on Japanese government bonds rose, the yields on five- and 10-year bonds rose to 0.91% and 1.23%, respectively.
The recent gains of the Japanese yen will be on an important US date this week that may determine attempts to change the direction to a downside.
The USD/JPY currency pair may consolidate in its recent trajectory pending the market’s reaction and investors’ response to the US Federal Reserve’s announcement this week. Especially, after Trump’s indications that he prefers to lower US interest rates. Therefore, investors may compare the Bank of Japan’s announcement with the US Federal Reserve’s announcement this week to determine the direction of the US dollar against the Japanese yen.
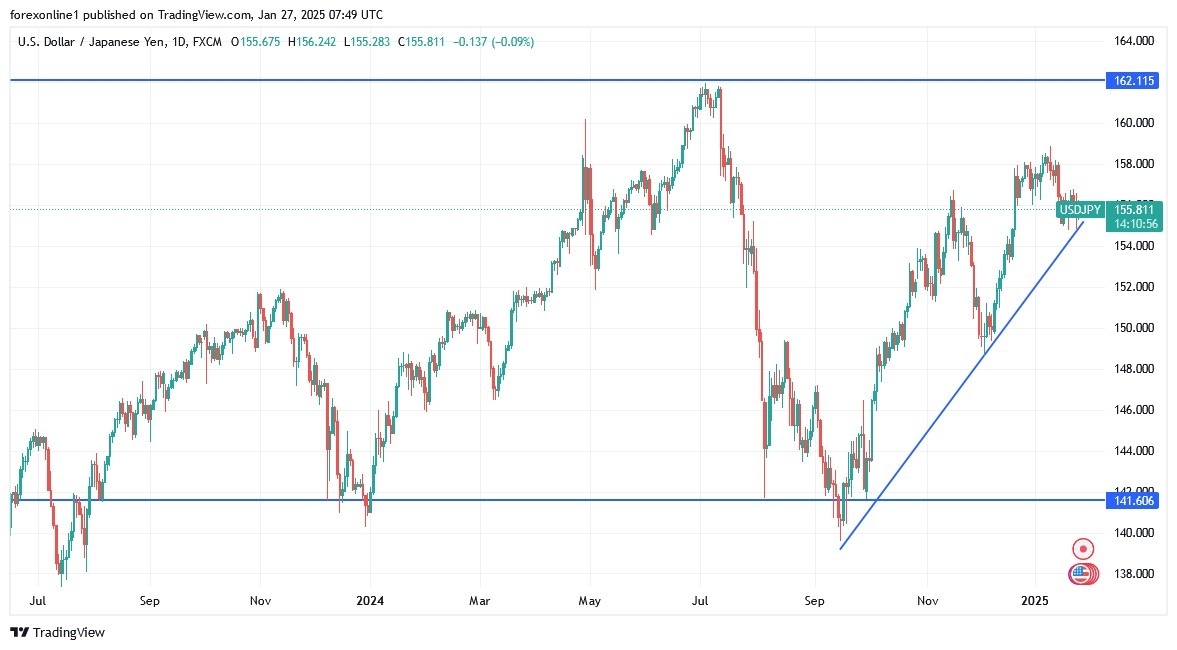
Technically, Friday’s decline pushed the USD/JPY currency pair slightly below the 100-hour moving average line. As a result, the currency pair avoided rising to the overbought levels of the 14-hour Relative Strength Index. In the short term, the bears will seek to extend the recent decline towards the support levels of 155.40 and 154.90 respectively. In the same time frame, the bulls will target the resistance levels of 156.20 and 156.80 respectively.
In the long term, according to the performance on the daily chart, the USD/JPY pair is trading within an ascending channel formation. However, the 14-day RSI has recently declined to avoid entering overbought levels. Therefore, the bears will target further movement towards lower levels, the closest of which is currently 154.20 and then the support 151.60 respectively. In the same time frame, the bulls’ most important targets will be the resistance levels of 158.50 and 161.00 respectively. Moreover, these are enough to push the technical indicators towards strong overbought levels. Decisively, the event increases with it the Japanese intervention in the forex markets to prevent further collapse of the Japanese yen exchange rate.
Want to trade our USD/JPY forex analysis and predictions? Here’s a list of forex brokers in Japan to check out.
Gold price is retreating further from three-month highs just shy of the all-time peak of $2,790 early Monday. Gold buyers turn cautious heading into a big week, with the central focus on US President Donald Trump’s trade policies and the US Federal Reserve (Fed) policy announcements.
That said, Gold traders resort to liquidating their long positions to take profits off the table as the bright metal fell a thread line short of the record highs. Further, repositioning ahead of the Fed event risk also remains a weight on the Gold price.
Additionally, resurgent demand for the US Dollar (USD) as a safe-haven currency following mounting fears of a global trade war capped the upside in the USD-denominated Gold price.
On Sunday, President Trump slapped a 25% tariff on all Colombian imports, which would be escalated to 50% in a week after the South American country refused to allow two military planes carrying deported migrants to land as part of the new US administration’s immigration crackdown. Colombia’s President Gustavo Petro threatened his own 50% tariff hours later.
Meanwhile, the Wall Street Journal (WSJ) carried a gated report on Monday, citing that US President Trump’s advisers want to impose 25% tariffs on Mexico and Canada as soon as February 1. An unnamed ‘senior administration official’ in the report said Trump is willing to move quickly, citing the President’s imposition of tariffs on Colombia.
An unexpected contraction in China’s manufacturing sector contributed to the risk-off market environment. The January official purchasing managers’ index (PMI) came in at 49.1, the National Bureau of Statistics (NBS) said on Monday, missing the estimated reading of 50.1.
Later in the day, Trump’s tariff plans will continue to drive risk sentiment, eventually impacting the Greenback and the Gold price without top-tier US economic data releases.
On Friday, Gold price rally extended and buyers almost tested the lifetime highs of $2,790 as the USD got slammed across the board following the release of downbeat US S&P Global preliminary business PMI data.
The preliminary US Composite PMI Output Index, which tracks the manufacturing and services sectors, declined to 52.4 in January, hitting the lowest level since April and was significantly down from December’s 55.4.
The US PMI data added to the recent slew of dismal statistics, reinforcing bets for two Fed interest rate cuts this year and rendering negative for the Greenback.
The daily chart shows that the short-term technical outlook remains constructive for Gold price despite the latest retracement from near a record peak.
Gold price achieved the symmetrical triangle target, measured at $2,785 on Friday but failed to yield a daily candlestick closing above it, which prompted buyers to turn on the sidelines.
Gold price charted a symmetrical triangle breakout earlier this month.
The 14-day Relative Strength Index (RSI) has turned lower after prodding the overbought region, currently near 65. The leading indicator suggests that Gold price remains a good dip-buying opportunity.
Adding credence to the bullish potential, the 50-day SMA closed above the 100-day SMA on Thursday, confirming a Bull Cross.
Gold price must seek a daily closing above the record high of $2,790 to set a new highest level ever above $2,800. Buyers will then aim for the $2,850 psychological level.
However, if the Gold price correction extends, immediate support will be seen at the January 23 low of $2,736.
Sellers will then aim for the $2,700 round level, below which the 21-day SMA at $2,686 will come into play.
Gold has played a key role in human’s history as it has been widely used as a store of value and medium of exchange. Currently, apart from its shine and usage for jewelry, the precious metal is widely seen as a safe-haven asset, meaning that it is considered a good investment during turbulent times. Gold is also widely seen as a hedge against inflation and against depreciating currencies as it doesn’t rely on any specific issuer or government.
Central banks are the biggest Gold holders. In their aim to support their currencies in turbulent times, central banks tend to diversify their reserves and buy Gold to improve the perceived strength of the economy and the currency. High Gold reserves can be a source of trust for a country’s solvency. Central banks added 1,136 tonnes of Gold worth around $70 billion to their reserves in 2022, according to data from the World Gold Council. This is the highest yearly purchase since records began. Central banks from emerging economies such as China, India and Turkey are quickly increasing their Gold reserves.
Gold has an inverse correlation with the US Dollar and US Treasuries, which are both major reserve and safe-haven assets. When the Dollar depreciates, Gold tends to rise, enabling investors and central banks to diversify their assets in turbulent times. Gold is also inversely correlated with risk assets. A rally in the stock market tends to weaken Gold price, while sell-offs in riskier markets tend to favor the precious metal.
The price can move due to a wide range of factors. Geopolitical instability or fears of a deep recession can quickly make Gold price escalate due to its safe-haven status. As a yield-less asset, Gold tends to rise with lower interest rates, while higher cost of money usually weighs down on the yellow metal. Still, most moves depend on how the US Dollar (USD) behaves as the asset is priced in dollars (XAU/USD). A strong Dollar tends to keep the price of Gold controlled, whereas a weaker Dollar is likely to push Gold prices up.
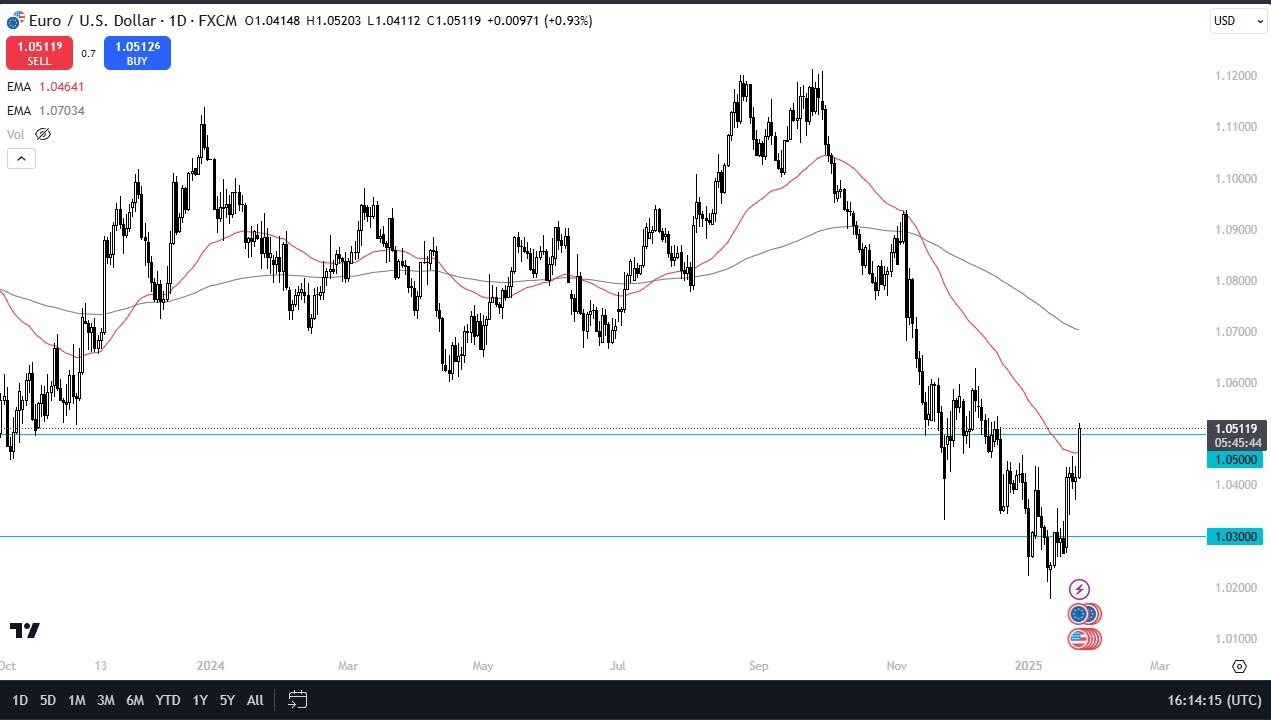
I really don’t believe this until we break above 1.06, because that would be a real recovery. Right now, when you look at the overall drop that we have seen, we are still not even to the 38.2% Fibonacci retracement level.
So really with that being the case, I think this is a little bit of an oversold bounce and I will be selling into this unless of course, we break above the 1.06 level, then I’ll have to reassess things. The Euro is going to continue to suffer at the hands of the European economy and bureaucrats. That’s just the reality of the situation and I think ultimately, you’ve got a scenario where eventually people go looking for cheap US dollars again, and they may be finding them in the cluster just above current trading. Again, I’m looking for signs of exhaustion to sell into. I recognize that this is a nice little bounce, but it doesn’t really change the trend, at least not quite yet.
At this juncture, the market is likely to continue to be noisy, but if we can get some type of negativity, then it’s likely that the momentum could come unraveled for the Euro, and then we would see money running right back into the United States, as I expect to be the case of the longer-term anyway.
Ready to trade our EUR/USD daily forecast? Here’s a list of some of the top forex brokers in Europe to check out.
The EURUSD price is testing the key support base 1.0455$, noticing that stochastic gains the positive momentum clearly, waiting to motivate the price to resume the expected bullish trend for today, which its next target located at 1.0600$.
We remind you that it is important to hold above 1.0455$ to continue the expected rise, as breaking it represents the key to turn to decline and build bearish wave that its first main target reaches 1.0325$.
The expected trading range for today is between 1.0400$ support and 1.0540$ resistance
Trend forecast: Bullish
Copper price failed to confirm breaching 4.3300$ barrier to form intraday decline and test the MA55 again by reaching 4.2300$, reminding you that the stability of the price above 4.1500$ support line and stochastic attempt to provide the positive momentum reinforce the chances of renewing the bullish attempts that might target 4.4400$ followed by reaching 4.5300$ on the medium term basis.
On the other hand, facing strong negative pressures and crawling below the mentioned support will confirm surrendering to the domination of the negativity, to expect suffering additional losses by moving towards 4.0900$ and 4.0200$ levels.
The expected trading range for today is between 4.2000$ and 4.4400$
Trend forecast: Bullish