The main category of Forex News.
You can use the search box below to find what you need.
[wd_asp id=1]
The main category of Forex News.
You can use the search box below to find what you need.
[wd_asp id=1]
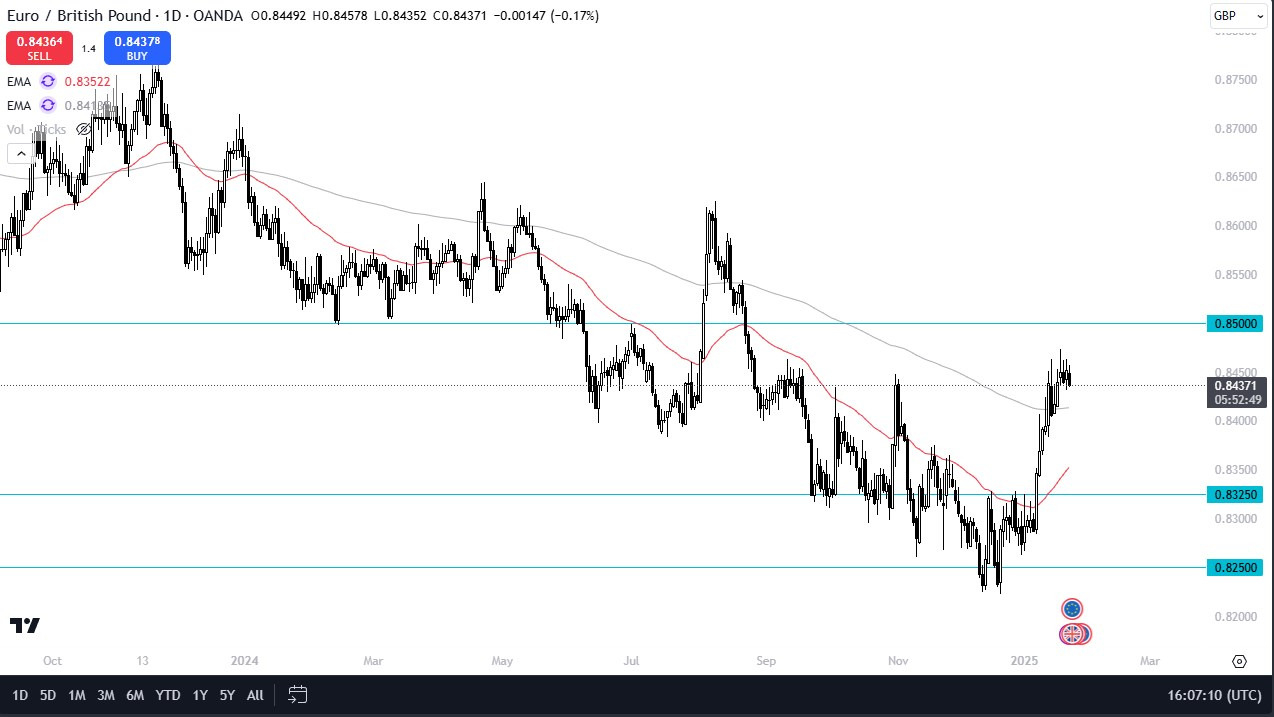
After all the market had been in a massive downtrend for what seemed like a lifetime and then dropped down toward the 0.8250 level to bounce that’s an area that’s been important as support all the way back to 2016 so the bounce is not a huge surprise. The question then becomes what happens next because we have to look at this through the prism of a market that is going to continue to see a lot of questions asked of both economies and with this, I would anticipate this overbought condition eventually breaks down, but I would not get short of the market until we break down below the 200 day EMA.

If we were to turn around and break above the 0.85 level, then the EUR/GBP market could go much higher, perhaps reaching the 0.86 level. The 0.85 level is an area that’s been important multiple times as well, so I think you need to pay close attention to it, but it is worth noting that just a few days ago, we ended up forming a shooting star, which of course is a sign of exhaustion. That exhaustion probably ends up being a nice cell signal if we do get a little bit more downward momentum. The overall trend, of course, is most certainly negative. I don’t wish to fight that. I think we are more likely than not to drop from here, as the euro itself is a bit of a basket case overall. Ultimately, I am still bearish, but don’t necessarily like either of these currencies.
Ready to trade our Forex daily forecast? We’ve shortlisted the best regulated forex brokers UK in the industry for you.
Citi increased its oil price forecast today with expectations for geopolitical conflicts to drive the price of the energy source higher in 2025. The bank expects Brent crude to rise to an average of $67 a barrel this year, compared to its prior estimate of $62 per barrel. Citi’s average 2025 forecast for WTI crude was also increased to $63 a barrel.
A Citi note explained its reasoning behind these updated oil price forecasts. The firm believes “heightened, sustained geopolitical risks in Iran/Russia-Ukraine” could “potentially wipe out the 2025 oil balance surplus.”
While Citi expects oil prices to increase, a wild card could change things. The bank notes that President Donald Trump “appears intent on dealmaking.” This could alter oil prices if the new President can resolve geopolitical conflicts between nations.
Additionally, President Trump wants to increase oil production in the U.S. He’s already announced an energy emergency, allowing additional oil production and looser regulations for the sector. Trump also rolled back the government’s climate change commitments and electric vehicle (EV) mandate, putting oil back in focus as the main energy source in the U.S. moving forward.
Oil stocks will likely benefit from the Trump administration’s stances. Fewer regulations and faster permit grants could see the market take off over the next four years. As such, investors might consider taking a stake in oil stocks to get ahead of those potential gains.
Turning to the TipRanks comparison tool, traders will see some of the best oil stocks. If it’s a huge upside potential and Wall Street’s backing that traders seek, then ConocoPhillips (COP) is one of the best bets with its Strong Buy rating and $134.33 price target, representing a potential 28.82% upside. Chevron (CVX) is another powerful option with the same rating and a $175.56 price target, representing a possible 10.85% upside.
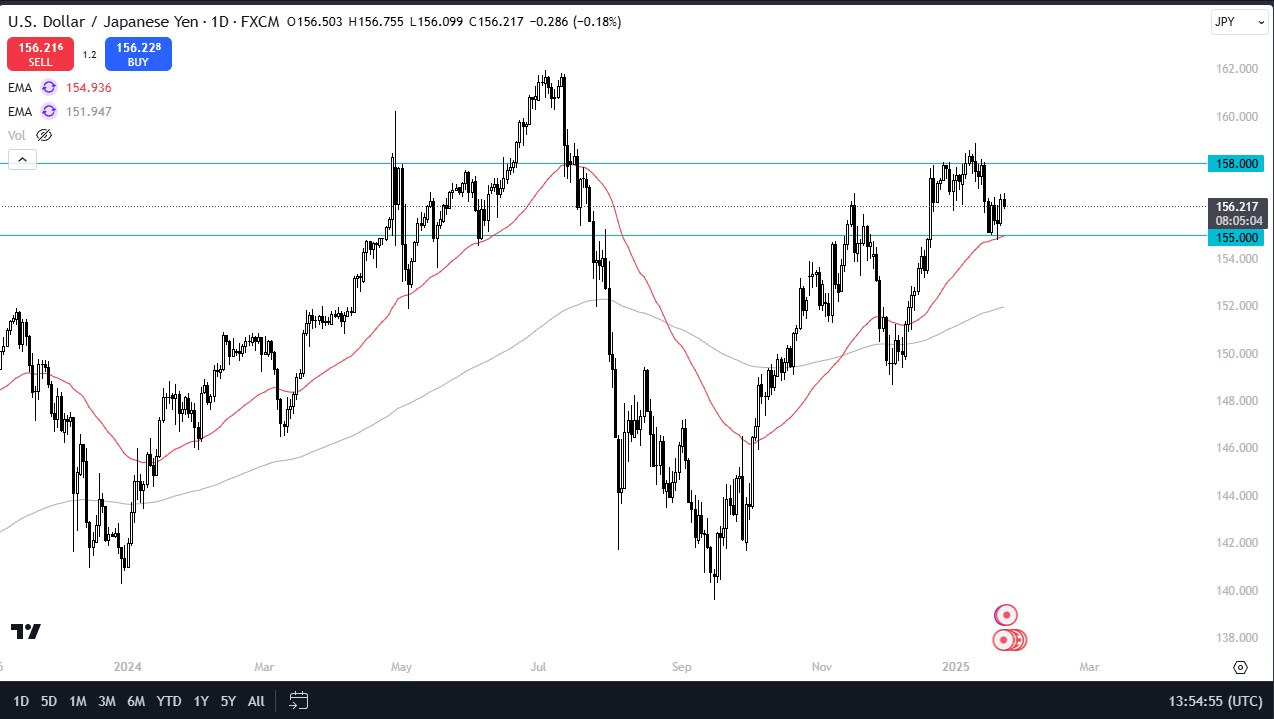
At this point, we will likely see a knee-jerk reaction to whatever happens next. Therefore, I think if the Bank of Japan suddenly sounds like it is going to be tight, we could see this market plunge. Yet, the interest rate differential will continue to favor the US dollar quite drastically, so I think that would end up being a buying opportunity unless, of course, the Bank of Japan does something unprecedented. While rates have risen in Japan just a bit, the reality is that the differential still favors the greenback quite drastically. Of course, the US economy is by far one of the strongest in the world right now, in both hard and soft numbers. Quite frankly, if Trump gets even remotely close to what he’s trying to get done in America, the United States could be back to the 1980s.
The technical analysis for the USD/JPY market is somewhat sideways at the moment, but it’s also worth noting that we have been in an uptrend for quite some time. Therefore, I think we are working off some of the froth but also trying to sort out whether the Bank of Japan is going to be an issue. I suspect that by the end of the day on Friday, we should have quite a few questions answered, so I am cautious about getting overly aggressive one way or the other until the BoJ releases all of its noise.
If we were to break down below the 50 Day EMA, then I suspect that somewhere between there and the 200 Day EMA we would find buyers. On the other hand, if we break out to the upside, once the ¥158 level is overcome, as a barrier, it could open up a move to the ¥160 level.
Want to trade USD/JPY forex analysis and predictions? Here’s a list of forex brokers in Japan to check out.
BoJ Rate Hike Impacts Yen and Forex Markets: What Traders Need to Know
The global financial landscape is abuzz after the Bank of Japan (BoJ) announced its latest interest rate hike. This move not only strengthens the yen but also reshapes the dynamics of the forex markets. In this article, we’ll explore the BoJ interest rate decision, its implications on the yen, and provide an insightful USD to JPY forecast. Let’s dive into the details and make sense of these developments.
The BoJ interest rate serves as a benchmark for borrowing costs in Japan. By adjusting this rate, the BoJ influences inflation, economic growth, and the yen’s strength on the global stage.
On Friday, the BoJ raised interest rates by 25 basis points. This decision was widely expected, given recent economic data showing steady inflation and rising wages in Japan.
The BoJ’s rate hike is a signal of confidence in Japan’s economic stability. By projecting inflation to remain close to its annual target, the central bank has set the stage for potential further hikes.
Immediately following the announcement, the USD to JPY pair dropped by 0.4%. This reflects the yen’s strengthened position against the dollar, a significant shift for forex traders.
The USD to JPY forecast hinges on several factors:
Forex experts anticipate the yen to gain further ground if the BoJ maintains its hawkish stance. However, traders should remain cautious about volatility in the USD to JPY pair.
At the World Economic Forum in Davos, former President Donald Trump urged the Federal Reserve to implement immediate interest rate cuts. His reasoning? Lower oil prices could pressure Russia to resolve the Ukraine conflict, indirectly stabilizing global markets.
Following Trump’s statements, the US Dollar Index fell by 0.3%. The dollar also faced its worst week in two months, reflecting market concerns over the Fed’s potential response.
The weakened dollar provided breathing room for several Asian currencies:
These sharp gains highlight how regional currencies can benefit from a strong yen and a weakened dollar, creating opportunities for strategic forex trading.
When central banks cut interest rates, it often reshapes the investment banking sector. Lower borrowing costs can stimulate corporate funding, while also impacting equity markets.
In Asia, rate cuts by the Fed or other central banks could enhance liquidity, benefiting emerging economies. However, the strength of the BoJ interest rate could offset some of these gains.
The interplay between the BoJ and Fed policies has far-reaching implications for forex markets. Traders must stay informed about developments in the USD to JPY forecast, as well as broader interest rate trends.
In this environment, diversification is key. Consider balancing investments across currencies, bonds, and equities to mitigate risks.
The BoJ interest rate hike marks a pivotal moment for the yen and global forex markets. As the USD to JPY pair adjusts to these changes, traders must remain vigilant and adapt their strategies. Understanding the interplay between the BoJ, the Fed, and geopolitical factors is crucial for navigating today’s volatile markets.
When considering shares, indices, forex (foreign exchange) and commodities for trading and price predictions, remember that trading CFDs involves a significant degree of risk and could result in capital loss.
Past performance is not indicative of any future results. This information is provided for informative purposes only and should not be construed to be investment advice.
Silver price recovers some ground and trades with gains of 0.91% yet it has failed to clear key resistance at the 100-day Simple Moving Average (SMA) at $30.95. At the time of writing, XAG/USD trades at $30.70 after bouncing off a low of $30.36.
Silver recovered after testing the 200-day SMA near $30.05 and rose above the 50-day SMA but faces stir resistance at $30.95. The trend is tilted to the downside as the grey metal carved a series of successively lower highs and lower lows. Even though the Relative Strength Index (RSI) suggests that buyers are gathering momentum, the grey metal has to surpass $32.32, the latest cycle high hit on December 12.
On the other hand, sellers must surpass the 200-day SMA and the $30.00 mark for a bearish continuation. Once taken out, the next support would be the January 13 low of $29.51, followed by the January 1 low of $28.89.
Silver is a precious metal highly traded among investors. It has been historically used as a store of value and a medium of exchange. Although less popular than Gold, traders may turn to Silver to diversify their investment portfolio, for its intrinsic value or as a potential hedge during high-inflation periods. Investors can buy physical Silver, in coins or in bars, or trade it through vehicles such as Exchange Traded Funds, which track its price on international markets.
Silver prices can move due to a wide range of factors. Geopolitical instability or fears of a deep recession can make Silver price escalate due to its safe-haven status, although to a lesser extent than Gold’s. As a yieldless asset, Silver tends to rise with lower interest rates. Its moves also depend on how the US Dollar (USD) behaves as the asset is priced in dollars (XAG/USD). A strong Dollar tends to keep the price of Silver at bay, whereas a weaker Dollar is likely to propel prices up. Other factors such as investment demand, mining supply – Silver is much more abundant than Gold – and recycling rates can also affect prices.
Silver is widely used in industry, particularly in sectors such as electronics or solar energy, as it has one of the highest electric conductivity of all metals – more than Copper and Gold. A surge in demand can increase prices, while a decline tends to lower them. Dynamics in the US, Chinese and Indian economies can also contribute to price swings: for the US and particularly China, their big industrial sectors use Silver in various processes; in India, consumers’ demand for the precious metal for jewellery also plays a key role in setting prices.
Silver prices tend to follow Gold’s moves. When Gold prices rise, Silver typically follows suit, as their status as safe-haven assets is similar. The Gold/Silver ratio, which shows the number of ounces of Silver needed to equal the value of one ounce of Gold, may help to determine the relative valuation between both metals. Some investors may consider a high ratio as an indicator that Silver is undervalued, or Gold is overvalued. On the contrary, a low ratio might suggest that Gold is undervalued relative to Silver.
Gold price shows sideways trades now, and it might test the key support base 2762.00$ before turning back to rise again, as it is affected by stochastic negativity that hinders the mission of continuing the rise.
Until now, the bullish trend scenario still suggested for today unless breaking the mentioned support and holding below it, reminding you that our main waited target reaches 2790.00$.
The expected trading range for today is between 2755.00$ support and 2795.00$ resistance.
Trend forecast: Bullish
Yesterday’s high was the second lower swing high that has occurred since a bearish reversal followed the 4.37 trend high from last week. The day ended down and today’s drop below yesterday’s low of 3.86 earlier in the trading session marked it has a swing high.
There is a possibility that the lower swing high is retained and the developing small downtrend (countertrend decline) of lower swing highs may be setting the stage for a deeper correction. However, today’s bullish price action following a successful test of support at the 20-Day line and possibility of a strong close, leaves open the prospect of a continuation of Wednesday’s bounce off support at the 20-Day MA
On the upside, a breakout above the 4.05 swing high will trigger a continuation of the bull advance from Wednesday’s low of 3.71. That low was also a higher swing low and now part of the price structure of the uptrend, which is also near support represented by the uptrend line.
The 61.8% Fibonacci retracement, where resistance might be seen, is at 4.09 and it is followed by the 78.6% retracement at 4.20. Moreover, there are two additional potential resistance areas. There is also a monthly high at 4.20, which provides confirmation for that price level as it matches the Fibonacci level.
Outlook turns bearish if there is a drop below this week’s low at 3.71 as it is key trend support of a higher swing low. However, there is an identified potential support zone from around 3.70 and 3.64, which could either hold and lead to a bullish reversal, or natural gas breaks down through the zone and heads lower towards 3.53 or so.
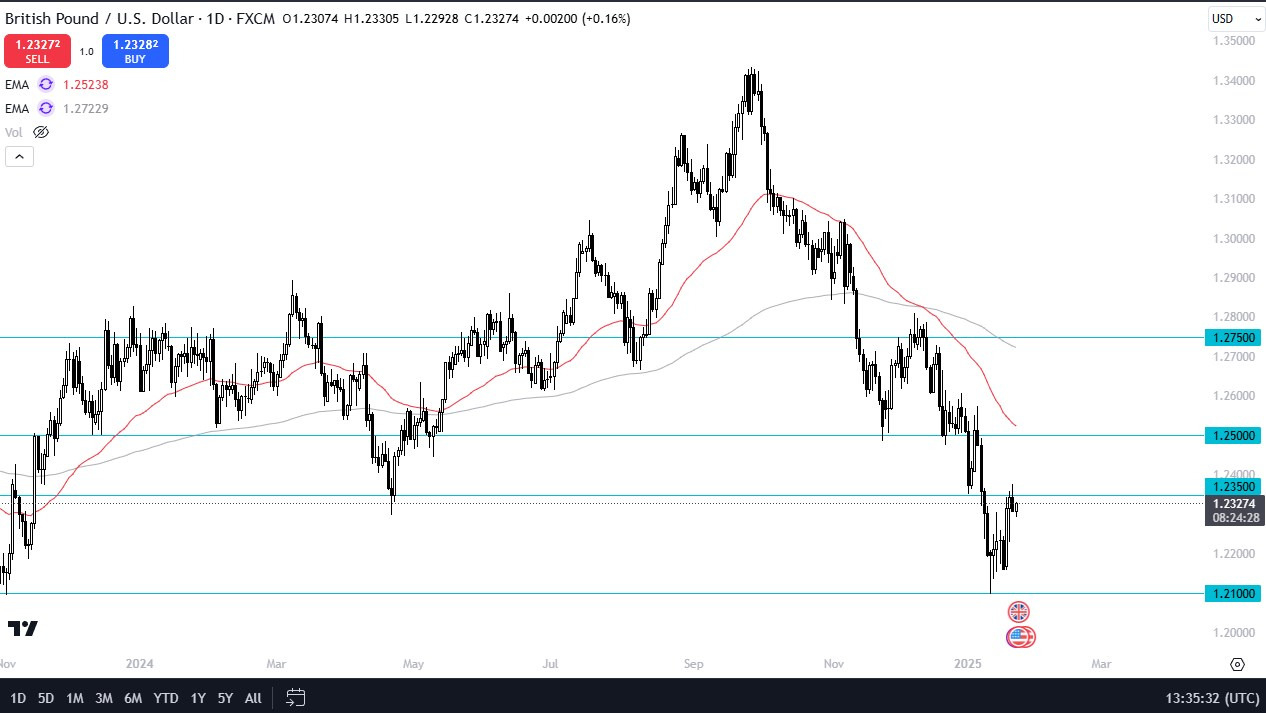
One of the biggest drivers of where we are going right now is the US economy, because quite frankly it is much stronger than most others around the world, including the United Kingdom. While the United Kingdom may not be as much trouble as others, the reality is that for some time now, anything not called “the US dollar” has struggled in the Forex world. There are a few outliers such as the Malaysian ringgit, but overall buying US dollars against other currencies has worked out quite nicely. This of course has been no different here, and the fact that money is flying into the United States at the moment it means that US dollars are heavily in demand.
While I do believe that a bounce from here could continue, the 1.25 level should end up being a major barrier. We also have the 50 Day EMA hanging around that area as well, so I think is worth noting that the technical traders will be watching that as well. Quite frankly though, I’m looking for the signs of weakness that will undoubtedly show up and stepping on the GBP/USD pair to the downside. I believe that we will revisit the bottom eventually, but the question just remains at this point as to how long it takes to get there.
Ready to trade our daily Forex forecast? Here’s a list of some of the top forex brokers UK to check out.
The EUR/GBP failed to extend its gains for the second straight day, as stir resistance near 0.8473 was strong enough to be cleared by bulls. Therefore, the cross tumbles towards the 200-day Simple Moving Average (SMA) at 0.8422 and print losses of 0.03%.
The pair resumed its uptrend on January 8, with the EUR/GBP posting gains of 2.29% in a seven-day span. Nevertheless, the EUR/GBP seems overextended, and it has consolidated above the 200-day SMA. If buyers hold prices above the latter, they could test the year-to-date (YTD) high at 0.8470.
On further strength, 0.8500 comes into play, followed by the August 24 peak at 0.8544. A breach of the latter will expose the August 14 daily high at 0.8592.
Conversely, if sellers drive EUR/GBP below the 200-day SMA, it will reach 0.8400. Further downside is clear, once the latter is surpassed, with bears targeting the 100-day SMA at 0.8348.
The Euro is the currency for the 19 European Union countries that belong to the Eurozone. It is the second most heavily traded currency in the world behind the US Dollar. In 2022, it accounted for 31% of all foreign exchange transactions, with an average daily turnover of over $2.2 trillion a day. EUR/USD is the most heavily traded currency pair in the world, accounting for an estimated 30% off all transactions, followed by EUR/JPY (4%), EUR/GBP (3%) and EUR/AUD (2%).
The European Central Bank (ECB) in Frankfurt, Germany, is the reserve bank for the Eurozone. The ECB sets interest rates and manages monetary policy. The ECB’s primary mandate is to maintain price stability, which means either controlling inflation or stimulating growth. Its primary tool is the raising or lowering of interest rates. Relatively high interest rates – or the expectation of higher rates – will usually benefit the Euro and vice versa. The ECB Governing Council makes monetary policy decisions at meetings held eight times a year. Decisions are made by heads of the Eurozone national banks and six permanent members, including the President of the ECB, Christine Lagarde.
Eurozone inflation data, measured by the Harmonized Index of Consumer Prices (HICP), is an important econometric for the Euro. If inflation rises more than expected, especially if above the ECB’s 2% target, it obliges the ECB to raise interest rates to bring it back under control. Relatively high interest rates compared to its counterparts will usually benefit the Euro, as it makes the region more attractive as a place for global investors to park their money.
Data releases gauge the health of the economy and can impact on the Euro. Indicators such as GDP, Manufacturing and Services PMIs, employment, and consumer sentiment surveys can all influence the direction of the single currency. A strong economy is good for the Euro. Not only does it attract more foreign investment but it may encourage the ECB to put up interest rates, which will directly strengthen the Euro. Otherwise, if economic data is weak, the Euro is likely to fall. Economic data for the four largest economies in the euro area (Germany, France, Italy and Spain) are especially significant, as they account for 75% of the Eurozone’s economy.
Another significant data release for the Euro is the Trade Balance. This indicator measures the difference between what a country earns from its exports and what it spends on imports over a given period. If a country produces highly sought after exports then its currency will gain in value purely from the extra demand created from foreign buyers seeking to purchase these goods. Therefore, a positive net Trade Balance strengthens a currency and vice versa for a negative balance.
Bitcoin price (BTCUSD) traded with clear positivity to reach the thresholds of the key resistance 106000.00$, and as we mentioned this morning, breaching this level will activate the positive effect of the bullish pennant pattern and lead the price to continue the bullish trend that targets 108350.45$ followed by 112000.00$ levels mainly.
On the other hand, we should note that breaking 101680.00$ will stop the bullish wave and push the price to decline towards 95195.00$ areas before any new attempt to rise.
The expected trading range for today is between 102000.00$ support and 108000.00$ resistance.
Trend forecast: Bullish