The main category of Forex News.
You can use the search box below to find what you need.
[wd_asp id=1]
The main category of Forex News.
You can use the search box below to find what you need.
[wd_asp id=1]
Spot Gold saw little action at the beginning of the week, with the bright metal stuck around $2,660 a troy ounce. The US Dollar (USD) finds near-term demand in a cautious mood ahead of central banks’ announcements. In the upcoming days, the United States (US) Federal Reserve (Fed), the Bank of England (BoE) and the Bank of Japan (BoJ) will have monetary policy meetings and decide on interest rates while hinting at what 2025 could bring to the table.
The Fed is widely expected to cut the benchmark rate by 25 basis points (bps), completing a 100 bps trim in 2024. The movement has been long ago priced in, which means the focus will be on the Summary of Economic Projections (SEP) or dot plot, in which policymakers detail their expectations on inflation, growth, rates and employment. Any change to what officials were seeing back in September will have an impact on the USD.
In the meantime, S&P Global published the preliminary estimates of the December Purchasing Managers Indexes (PMIs) for most major economies. The US report showed a solid improvement in services output, as the index printed at 58.5, much better than the 55.7 expected and the previous 56.1. The Manufacturing PMI, on the contrary, contracted to 48.3 from the 49.7 posted in November, also missing the expected 49.4.
Coming up next, the Asian macroeconomic calendar will have nothing relevant to offer, yet the United Kingdom (UK) will release the monthly employment report while Canada will release the November Consumer Price Index (CPI). Finally, the US will publish November Retail Sales on Tuesday.
From a technical point of view, the daily chart for XAU/USD shows it is seesawing around its opening while confined to a tight range. The same chart shows the pair is unable to clearly overcome a flat 20 Simple Moving Average (SMA), while technical indicators remain flat within neutral levels. The 100 and 200 SMAs maintain their upward slopes below the current level, limiting the Gold’s bearish potential.
In the near term, and according to the 4-hour chart, the risk skews to the downside. The pair is finding intraday buyers around converging and flat 100 and 200 SMAs. The 20 SMA turned gains downward traction above the longer ones, indicating mounting selling pressure. Finally, technical indicators resumed their slides within negative levels, in line with a continued slide in the upcoming sessions.
Support levels: 2,643.40 2,630.20 2,617.90
Resistance levels: 2,657.30, 2,672.70 2,689.00
Although the Bank of England wants to combat the slowdown of the British economy by cutting interest rates, rising inflation will prevent it from doing so. In this regard, the latest Bank of England/Ipsos inflation expectations survey reveals a rise in UK public inflation expectations, with average expectations for the coming year rising to 3%, up from 2.7% in August 2024. It also shows an increase in inflation expectations over the next 12 months to 2.8% from 2.6%. According to the announcement, long-term inflation expectations, measured over a five-year horizon, have risen to an average of 3.4%, compared to 3.2% in the previous survey. Consequently, these results reflect growing public concerns about inflationary pressures in Britain.

Overall, this is a significant development for policymakers at the Bank of England, ahead of its decision this week. Accordingly, inflation expectations are of paramount importance in driving actual inflation outcomes: If people expect inflation to rise in the future, they may accelerate their spending to avoid paying higher prices later. This increased demand could in turn lead to higher prices, creating a vicious cycle of inflation. The inflation expectations data comes on the day that the UK economy was announced to have contracted by 0.1% for the second consecutive month, confirming that the economy has lost momentum rapidly from the growth mentioned above in the first half of the year. This confirms market expectations that the bank will proceed cautiously in 2025, cutting interest rates on three to four occasions.
The price of the pound against the dollar may stabilize around its current path until the reaction to the results of important economic data and announcements from global central banks, so caution is required
According to the platforms of licensed trading companies. The price of the pound has been subjected to selling pressure against the rest of the other major currencies following the announcement of the contraction of the British economy for the second month in a row. According to the Office for National Statistics, the UK’s gross domestic product fell by 0.1%, and according to the announcement, British industrial production and construction output fell by 0.6% and 0.4%, respectively, while the services sector failed to grow.
On a quarterly basis, UK GDP grew slightly by 0.1% compared to the previous 3-month period. GDP increased by 1.3% over the year compared to market expectations of 1.6%. Economists commented on the announced figures that budget uncertainty has weighed on demand and sentiment. Furthermore, the survey data paints a more pessimistic picture for the fourth quarter than growth models from the Office for Budget Responsibility and the Bank of England suggest. At the same time, the fourth quarter could see a weaker pace of growth, as companies deal with the higher tax burden announced in the budget as well as heightened geopolitical uncertainty.
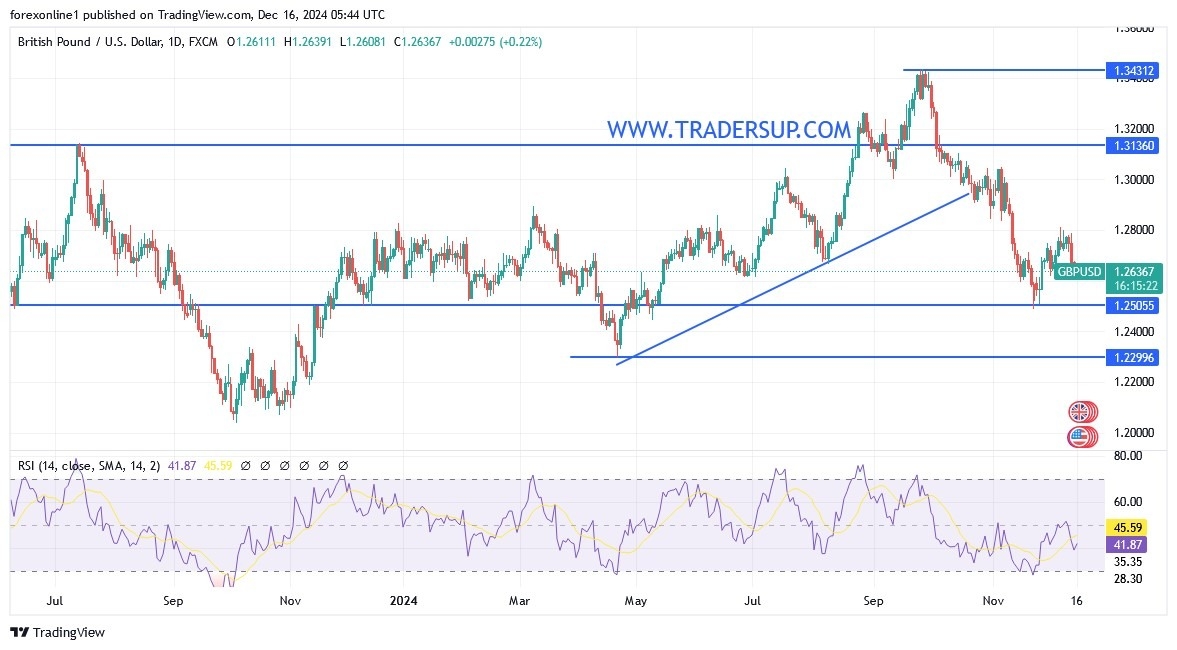
According to the performance of the GBP/USD price on the daily chart, the general trend is down and is getting stronger. Concurrently, Forex traders are looking forward to moving towards the psychological support level of 1.2500 now. Technically, the direction of the Relative Strength Index is still down and has room to move before reaching oversold levels. Moreover, the MACD is turning higher and will not lack strength. In contrast, and in the same time frame, there will be no initial break of the current downtrend without returning to the resistance level of 1.2830 first.
Decisively, the GBP/USD pair will be affected this week by the announcement of both the Bank of England and the US Federal Reserve on the scheduled interest rates and the banks’ policy statement will be of interest to investors and analysts. However, the interaction will be with the readings of the manufacturing and services purchasing managers’ indices. Also, the British inflation and employment figures. In addition to the announcement of the US retail sales figures and the GDP growth readings, then the US inflation reading preferred by the Federal Reserve – the Personal Consumption Expenditures Price Index – it is truly a trading and fateful week for the GBP/USD pair.
Ready to trade our daily GBP/USD Forex analysis? We’ve made this UK forex brokers list for you to check out.
This week, Federal Reserve officials will conclude a two-day meeting and issue an update on US interest rate policy. At their meeting last month, Fed officials cut the US interest rate by a quarter point. This came after a larger half-point cut in the September meeting. The biggest expectation is that the US Federal Reserve will announce another interest rate cut, although some Fed officials have recently indicated that they have not yet made a final decision on whether they will support a rate cut this month.
I still recommend buying the US dollar against the Japanese yen from every downward level, but without risk, while monitoring the strong factors influencing the trend this week
Since the beginning of this month, the Japanese yen has been under selling pressure against other major currencies. Clearly, the most prominent was against the US dollar. According to reliable trading company platforms, the Japanese yen has recorded its longest losing streak against the US dollar since last June, as traders bet that the Bank of Japan will refrain from raising interest rates.
On the policy front, Bloomberg recently reported that Bank of Japan policymakers see little cost in waiting until January 2025 or later to raise interest rates because there is a limited risk that inflation will exceed the cap. Also, the report added that they are open to raising interest rates depending on economic data and market developments. Overall, financial markets have reduced their bets on a rate hike by the Bank of Japan this month after the report, now setting a 16% probability for this outcome. A week ago, the chance of a Japanese rate hike was 64%. The Bank of Japan’s decision comes a day after the US Federal Reserve cut interest rates by a quarter of a percentage point, although the longer-term outlook is gloomier.
Affected by the bank’s decisions, the Bank of Japan’s quarterly Tankan survey released on Friday showed that confidence among major Japanese companies remains optimistic, but the data did not move interest rate expectations. Also, hedge funds have recently increased their bets against the yen, according to Commodity Futures Trading Commission data for the week ended December 10.
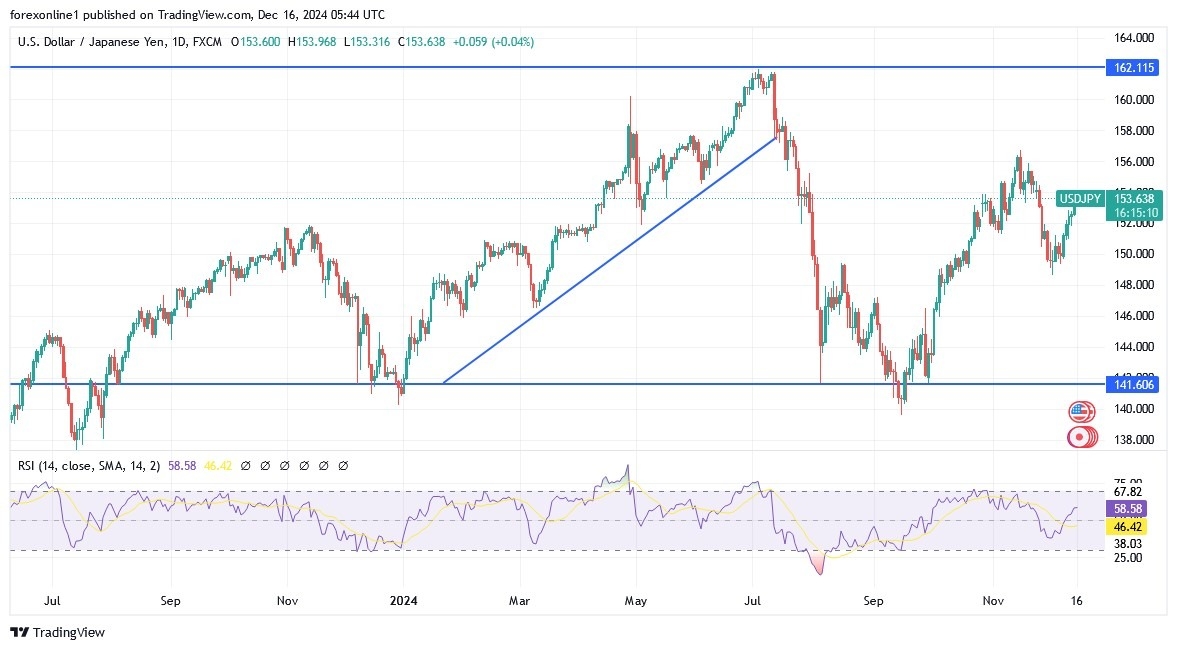
Based on recent performance, the USD/JPY has now risen to trade slightly above its 100-hour moving average. As a result, the currency pair is about to enter the overbought levels of the 14-hour RSI. Therefore, bulls will look to extend the current rally towards 154.71 or higher to the resistance of 155.61. On the other hand, bears will seek to benefit from a correction downwards around 152.68 or lower at the support of 151.80. In the long term, according to the performance on the daily chart, the USD/JPY currency pair has completed an upward breakout from a descending channel formation. Also, the 14-day RSI has bounced back to approach the overbought levels. Therefore, bulls will seek to continue moving within an upward channel towards the resistance levels of 157.65 or higher to the resistance of 161.75. As for the MACD indicator, it is trying to move away from the oversold levels. On the other hand, bears may benefit from selling to take profits from moving towards the support levels around 149.60 or lower at the support of 145.00.
Want to trade our USD/JPY Forex analysis and predictions? Here’s a list of forex brokers in Japan to check out.
The EUR/USD forecast shows a surge in European Central Bank rate cut bets after dovish policymaker remarks. Meanwhile, PMI data showed a slight rebound in the Eurozone economy. However, business activity remained in contraction, showing a frail economy.
–Are you interested to learn more about forex options trading? Check our detailed guide-
The euro dropped on Monday due to dovish comments from a top ECB official. ECB Vice President Luis De Guindos said that inflation in the Eurozone bloc would likely hold at the 2% target in 2025. Moreover, he noted that the central bank will continue cutting rates if inflation meets forecasts.
The European Central Bank lowered borrowing costs by 25-bps on Thursday. At the same time, policymakers remained dovish, forecasting more cuts due to the weak economy and uncertainty about likely tariffs in the US. Such an outlook will likely weigh on the euro, especially since it diverges with the US outlook.
Furthermore, data on Monday revealed that business activity in the Eurozone improved in December due to growth in the services sector. Notably, the flash composite PMI increased from 48.3 in November to 49.5 in December. Meanwhile, economists had expected a drop to 48.2. However, business activity remains in contraction below 50.
Elsewhere, the dollar extended its gains as markets anticipated a more cautious Fed in the coming year. Nevertheless, traders have fully priced a rate cut this week. Meanwhile, the likelihood of a January cut remains low at 24%.
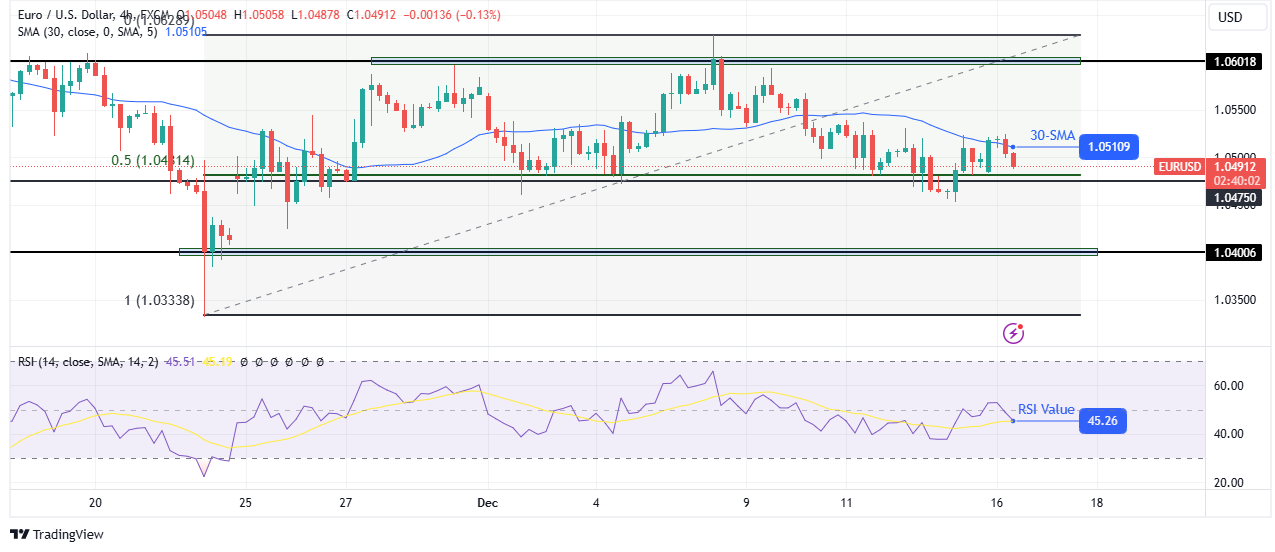
On the technical side, the EUR/USD price is bouncing lower after finding a strong barrier at the 30-SMA. Meanwhile, the RSI trades below 50, suggesting solid bearish momentum. However, bears have found it difficult to break below the 1.0475 support, which coincides with the 0.5 Fib retracement level.
–Are you interested to learn more about forex tools? Check our detailed guide-
A break below this zone would allow the price to make lower lows and reach the 1.0400 key support level. Such an outcome would signal a new downtrend. On the other hand, if the support zone holds firm, the price might break above the SMA to retest the 1.0601 resistance level. However, bulls would have to break above this resistance to confirm a new bullish trend.
Looking to trade forex now? Invest at eToro!
67% of retail investor accounts lose money when trading CFDs with this provider. You should consider whether you can afford to take the high risk of losing your money.
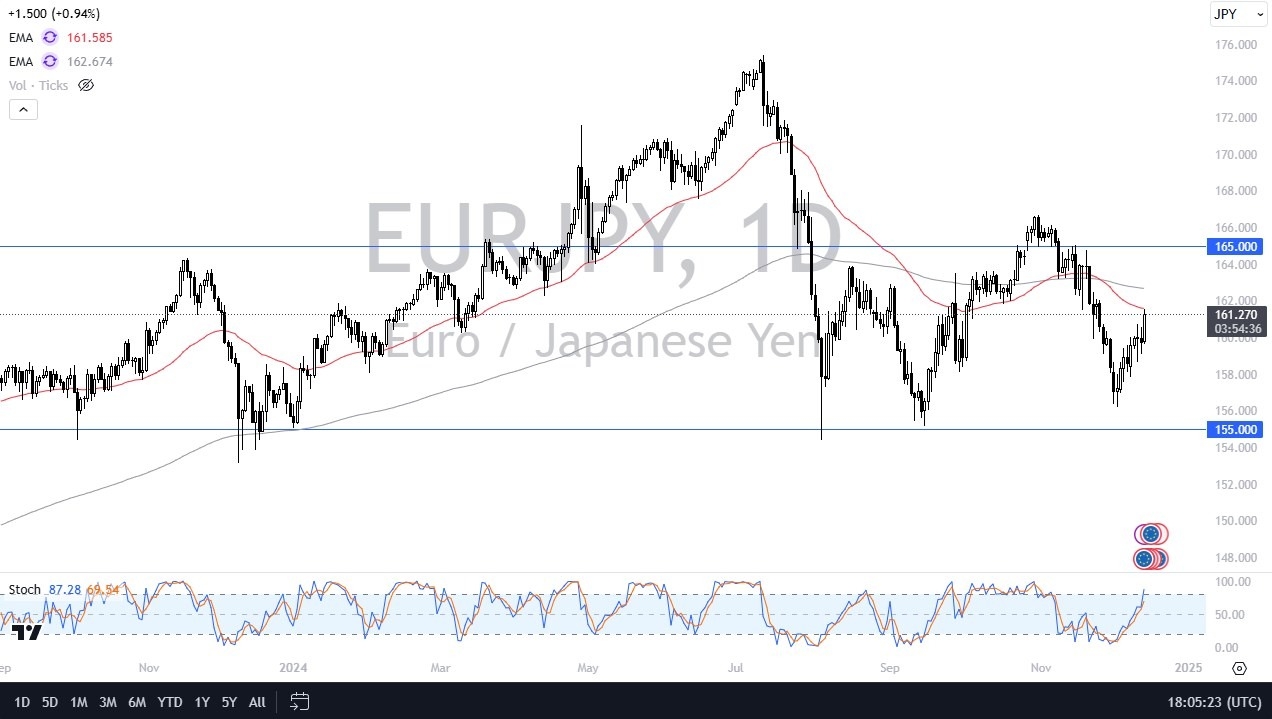
This is an area that will be somewhat difficult to break above, but I think we would have to pay very close attention to the market if we get anywhere near it.
Underneath, we have the 155 yen level as a floor. As we are basically in the middle of this, it makes quite a bit of sense that we see a lot of volatility here. The size of the candlestick is something worth paying close attention to as it does say that there’s alert into the euro against the yen or maybe a better way to put it is money’s just leaving Japan.
Either way EUR/JPY is a market that looks positive, and we have just formed a massive triple bottom so I do think we will probably turn things around. Again, while I don’t like the euro, I really don’t like the yen and therefore this is a battle of two very weak currencies although obviously, Europe is in better shape than Japan is, as the Japanese economy is crushed under the weight of debt and higher interest rates in that country would just wipe out economic progress. So, with all that being said, I think this remains a buy on the dip market, albeit probably not my favorite yen related pair.
Want to trade our daily forex analysis and predictions? Here’s a list of forex brokers in Japan to check out.
The GBP/USD is trading at $1.26396, up 0.24%, as it gains strength near the pivotal $1.26663 level, supported by an upward trendline on the 4-hour chart. This level is crucial for maintaining the bullish momentum, with immediate resistance at $1.27194 and a stronger hurdle at $1.27966.
On the downside, support is observed at $1.26046, followed by $1.25255, offering a safety net for the pair.
The 50 EMA at $1.26884 and the 200 EMA at $1.27083 highlight a mixed sentiment, with sellers likely to challenge gains near resistance levels. For now, the bullish trend remains intact, but a break below $1.26663 could invite sharp selling pressure, pushing prices toward lower supports.
The euro faced pressure following disappointing German trade balance data, which fell to €13.4B against a forecast of €15.7B. Weakness in wholesale prices (0.0%) and stagnant French CPI (-0.1%) underscored economic challenges.
Looking ahead, Monday’s key flash PMIs will shape sentiment. French Manufacturing PMI is expected at 43.2, signaling contraction, while Services PMI holds steady at 46.9. German PMIs are marginally better but still sluggish, with Services forecasted at 49.5.
ECB President Lagarde’s speeches will be closely monitored for policy signals, especially as inflation and growth concerns persist in the eurozone. The euro remains vulnerable to further downside.
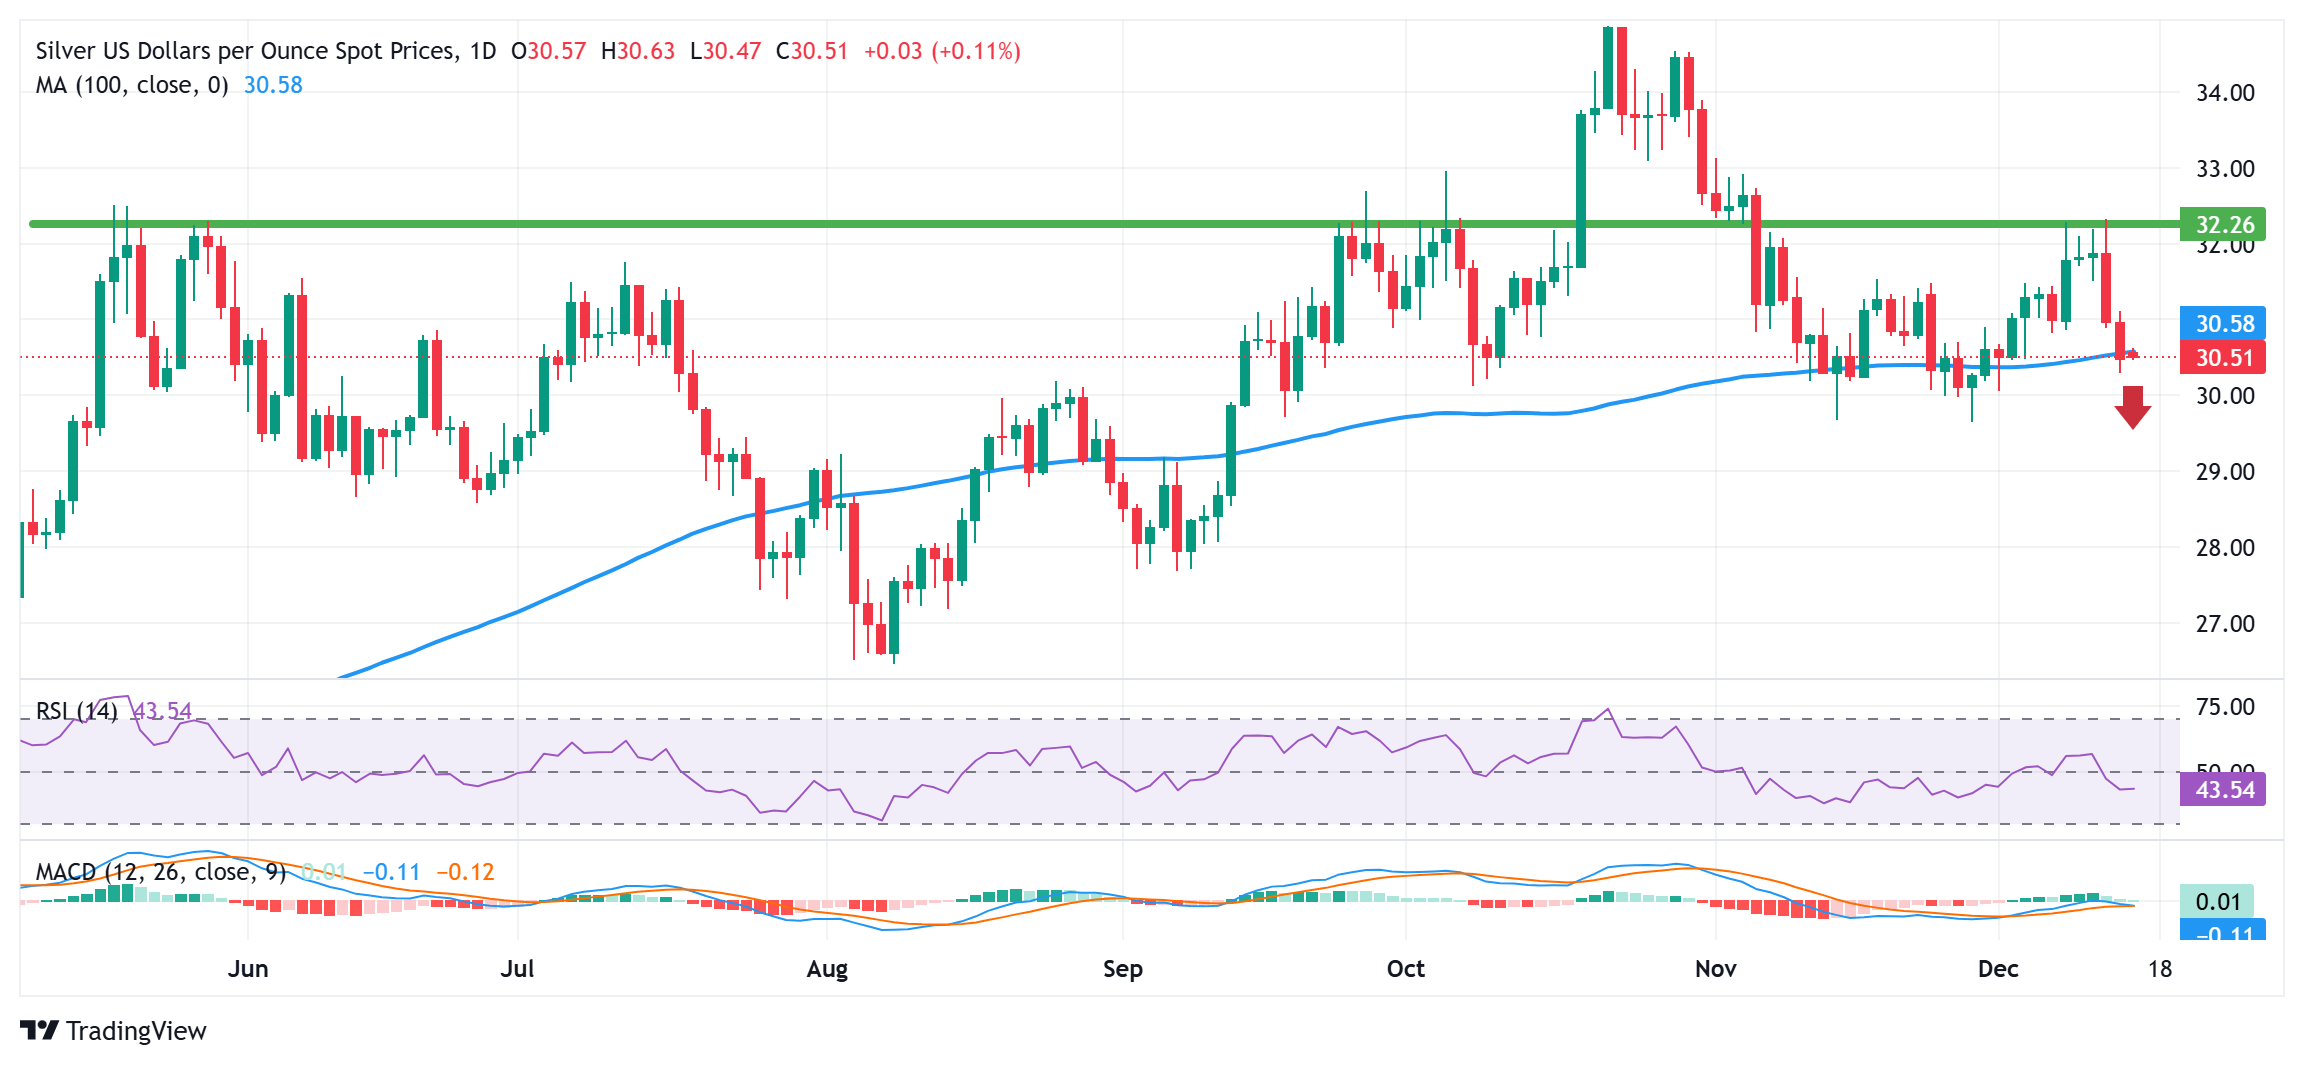
Silver (XAG/USD) kicks off the new week on a subdued note and consolidates last week’s retracement slide from or over a one-month high. The white metal remains close to a two-week low touched Friday and trades around the $30.55 region, or the 100-day Simple Moving Average (SMA), during the Asian session.
From a technical perspective, acceptance below the 100-day SMA will be seen as a fresh trigger for bearish traders against the backdrop of last week’s failure near the $32.35 horizontal resistance. Given that oscillators on the daily chart have just started gaining negative traction, the XAG/USD might then turn vulnerable to weaken further below the $30.00 psychological mark and test November lows, around the $29.70-$29.65 region.
Some follow-through selling should pave the way for an extension of the downward trajectory towards the $29.10-$29.00 support zone en route to the $28.40-$28.35 region before the XAG/USD eventually drops to the $28.00 round figure.
On the flip side, any meaningful recovery attempt now seems to confront stiff resistance and remain capped near the $31.00 mark. A sustained strength beyond, however, could trigger a short-covering rally and lift the XAG/USD towards the $31.75 horizontal barrier. The momentum could extend further towards the $32.00 round figure en route to the monthly swing high, around the $32.35 horizontal zone touched last week.
Silver is a precious metal highly traded among investors. It has been historically used as a store of value and a medium of exchange. Although less popular than Gold, traders may turn to Silver to diversify their investment portfolio, for its intrinsic value or as a potential hedge during high-inflation periods. Investors can buy physical Silver, in coins or in bars, or trade it through vehicles such as Exchange Traded Funds, which track its price on international markets.
Silver prices can move due to a wide range of factors. Geopolitical instability or fears of a deep recession can make Silver price escalate due to its safe-haven status, although to a lesser extent than Gold’s. As a yieldless asset, Silver tends to rise with lower interest rates. Its moves also depend on how the US Dollar (USD) behaves as the asset is priced in dollars (XAG/USD). A strong Dollar tends to keep the price of Silver at bay, whereas a weaker Dollar is likely to propel prices up. Other factors such as investment demand, mining supply – Silver is much more abundant than Gold – and recycling rates can also affect prices.
Silver is widely used in industry, particularly in sectors such as electronics or solar energy, as it has one of the highest electric conductivity of all metals – more than Copper and Gold. A surge in demand can increase prices, while a decline tends to lower them. Dynamics in the US, Chinese and Indian economies can also contribute to price swings: for the US and particularly China, their big industrial sectors use Silver in various processes; in India, consumers’ demand for the precious metal for jewellery also plays a key role in setting prices.
Silver prices tend to follow Gold’s moves. When Gold prices rise, Silver typically follows suit, as their status as safe-haven assets is similar. The Gold/Silver ratio, which shows the number of ounces of Silver needed to equal the value of one ounce of Gold, may help to determine the relative valuation between both metals. Some investors may consider a high ratio as an indicator that Silver is undervalued, or Gold is overvalued. On the contrary, a low ratio might suggest that Gold is undervalued relative to Silver.
Silver struggles to gain any meaningful traction on Monday and languishes near a two-week low.
Bears await a sustained break and acceptance below the 100-day SMA before placing fresh bets.
Any attempted recovery might be seen as a selling opportunity and is likely to remain capped.
Silver (XAG/UD) kicks off the new week on a subdued note and consolidates last week’s retracement slide from or over a one-month high. The white metal remains close to a two-week low touched Friday and trades around the $30.55 region, or the 100-day Simple Moving Average (SMA), during the Asian session.
From a technical perspective, acceptance below the 100-day SMA will be seen as a fresh trigger for bearish traders against the backdrop of last week’s failure near the $32.35 horizontal resistance. Given that oscillators on the daily chart have just started gaining negative traction, the XAG/USD might then turn vulnerable to weaken further below the $30.00 psychological mark and test November lows, around the $29.70-$29.65 region.
Some follow-through selling should pave the way for an extension of the downward trajectory towards the $29.10-$29.00 support zone en route to the $28.40-$28.35 region before the XAG/USD eventually drops to the $28.00 round figure.
On the flip side, any meaningful recovery attempt now seems to confront stiff resistance and remain capped near the $31.00 mark. A sustained strength beyond, however, could trigger a short-covering rally and lift the XAG/USD towards the $31.75 horizontal barrier. The momentum could extend further towards the $32.00 round figure en route to the monthly swing high, around the $32.35 horizontal zone touched last week.
Silver is a precious metal highly traded among investors. It has been historically used as a store of value and a medium of exchange. Although less popular than Gold, traders may turn to Silver to diversify their investment portfolio, for its intrinsic value or as a potential hedge during high-inflation periods. Investors can buy physical Silver, in coins or in bars, or trade it through vehicles such as Exchange Traded Funds, which track its price on international markets.
Silver prices can move due to a wide range of factors. Geopolitical instability or fears of a deep recession can make Silver price escalate due to its safe-haven status, although to a lesser extent than Gold’s. As a yieldless asset, Silver tends to rise with lower interest rates. Its moves also depend on how the US Dollar (USD) behaves as the asset is priced in dollars (XAG/USD). A strong Dollar tends to keep the price of Silver at bay, whereas a weaker Dollar is likely to propel prices up. Other factors such as investment demand, mining supply – Silver is much more abundant than Gold – and recycling rates can also affect prices.
Silver is widely used in industry, particularly in sectors such as electronics or solar energy, as it has one of the highest electric conductivity of all metals – more than Copper and Gold. A surge in demand can increase prices, while a decline tends to lower them. Dynamics in the US, Chinese and Indian economies can also contribute to price swings: for the US and particularly China, their big industrial sectors use Silver in various processes; in India, consumers’ demand for the precious metal for jewellery also plays a key role in setting prices.
Silver prices tend to follow Gold’s moves. When Gold prices rise, Silver typically follows suit, as their status as safe-haven assets is similar. The Gold/Silver ratio, which shows the number of ounces of Silver needed to equal the value of one ounce of Gold, may help to determine the relative valuation between both metals. Some investors may consider a high ratio as an indicator that Silver is undervalued, or Gold is overvalued. On the contrary, a low ratio might suggest that Gold is undervalued relative to Silver.
The Gold price (XAU/USD) trades flat around $2,650 during the early Asian session on Monday. However, strong central bank buying and ongoing geopolitical tensions in the Middle East could underpin the precious metal in the near term. Investors await the preliminary US December Purchasing Managers Index (PMI) for fresh impetus, which is due later on Monday.
Significant demand from central banks lifts the yellow metal price. Central banks have been net buyers of gold for nearly 15 years, emphasizing its value as a crisis hedge and a reliable reserve asset. According to the World Gold Council, the precious metal is expected to rise modestly in 2025 due to central bank actions, geopolitical tensions, and economic conditions in key markets like the US, China, and India.
On Sunday, Israel’s government approved a plan to double its population in the occupied Golan Heights, citing threats from Syria, per Reuters. Any signs of escalating geopolitical tensions in this region could boost a flight to safe assets, benefiting the Gold price.
On the flip side, US President-elect Donald Trump’s tariff plan would stoke further inflation and delay the Federal Reserve (Fed) easing policy. Additionally, the robust US economy could lift the US Dollar (USD) and undermine the USD-denominated commodity price as it increases the opportunity cost of holding non-yielding bullion. “Generally speaking, we see a stronger U.S. economy next year, which should leave less room for rate cuts and should thus bring less tailwinds for gold,” said Carsten Menke, an analyst at Julius Baer.
Gold traders will closely watch the Fed meeting on Wednesday, which is anticipated to cut the interest rates by 25 basis points (bps). The attention will be on Chair Jerome Powell’s speech, as it might offer some hints about US monetary policy for 2025.
Gold has played a key role in human’s history as it has been widely used as a store of value and medium of exchange. Currently, apart from its shine and usage for jewelry, the precious metal is widely seen as a safe-haven asset, meaning that it is considered a good investment during turbulent times. Gold is also widely seen as a hedge against inflation and against depreciating currencies as it doesn’t rely on any specific issuer or government.
Central banks are the biggest Gold holders. In their aim to support their currencies in turbulent times, central banks tend to diversify their reserves and buy Gold to improve the perceived strength of the economy and the currency. High Gold reserves can be a source of trust for a country’s solvency. Central banks added 1,136 tonnes of Gold worth around $70 billion to their reserves in 2022, according to data from the World Gold Council. This is the highest yearly purchase since records began. Central banks from emerging economies such as China, India and Turkey are quickly increasing their Gold reserves.
Gold has an inverse correlation with the US Dollar and US Treasuries, which are both major reserve and safe-haven assets. When the Dollar depreciates, Gold tends to rise, enabling investors and central banks to diversify their assets in turbulent times. Gold is also inversely correlated with risk assets. A rally in the stock market tends to weaken Gold price, while sell-offs in riskier markets tend to favor the precious metal.
The price can move due to a wide range of factors. Geopolitical instability or fears of a deep recession can quickly make Gold price escalate due to its safe-haven status. As a yield-less asset, Gold tends to rise with lower interest rates, while higher cost of money usually weighs down on the yellow metal. Still, most moves depend on how the US Dollar (USD) behaves as the asset is priced in dollars (XAU/USD). A strong Dollar tends to keep the price of Gold controlled, whereas a weaker Dollar is likely to push Gold prices up.
On Wednesday, the Fed will deliver its interest rate decision. Economists expect a 25-basis point interest rate cut, placing market focus on the economic projections and press conference.
Projections for a more hawkish Fed rate path may drive the USD/JPY toward 160 on interest rate differentials. Conversely, signals for multiple Fed rate cuts may pull the USD/JPY below 150.
On Friday, the US Personal Income and Outlays Report will wrap up an important week for the USD/JPY pair. Core PCE Price Index and personal income/spending trends could influence sentiment toward a Q1 2025 Fed rate cut.
In summary, a December and a potential Q1 2025 rate cut could drag the USD/JPY toward 140. Conversely, a hawkish Fed rate cut may drive the pair toward 160.
Near-term USD/JPY trends will hinge on the looming Fed and Bank of Japan interest rate decisions. A narrowing in the US-Japan interest rate differential in favor of the Yen could pull the USD/JPY pair toward 140. Conversely, a BoJ hold and hawkish Fed rate cut may drive the pair toward 160.
Investors should monitor real-time data, central bank decisions, and expert commentary to adapt trading strategies effectively. Don’t miss crucial market movements. Follow our real-time FX updates and stay ahead in the markets here!
After last week’s rebound, the USD/JPY sits above the 50-day and 200-day EMAs, signaling bullish momentum tied to BoJ and Fed policy expectations.
A USD/JPY return to 155 would support a move toward the 156.884 resistance level. Furthermore, a break above the 156.884 resistance level could enable the bulls to target the crucial 160 level.
Investors should consider the economic indicators and central bank policy decisions, potentially affecting USD/JPY price trends.
Conversely, a drop below the 50-day EMA could bring the 200-day EMA and 149.358 support level into play. A fall through the 149.358 support level may signal a drop to the 140.309 support level.
The 14-day RSI at 58.33 indicates a USD/JPY climb to the 156.884 resistance level before entering overbought territory (RSI above 70).