The main category of Forex News.
You can use the search box below to find what you need.
[wd_asp id=1]
The main category of Forex News.
You can use the search box below to find what you need.
[wd_asp id=1]
On Wednesday, Gold prices continued their ascent despite geopolitical tensions mitigated somewhat along with the appetite for safe-haven assets. Heightened anxiety over the Russia-Ukraine conflict, coupled with broader uncertainty in global markets, has been underpinning the strong weekly rebound in the precious metal for the time being.
The yellow metal, however, is expected to remain under scrutiny in the next few weeks as recent US economic data, coupled with expectations that Republican policies could fuel inflation, have increased the likelihood of interest rates staying elevated for an extended period. While gold is traditionally viewed as a hedge against inflation, higher interest rates make the non-yielding metal less attractive to investors.
So far this week, Gold prices surged past the recently breached $2,600 mark per troy ounce, finding decent resistance around the 55-day Simple Moving Average (SMA) above $2,640, which emerges as a noticeable hurdle as it seeks to build on its recovery momentum.
The yellow metal’s rebound was also supported by a softer US Dollar (USD), which has struggled to maintain the strength it gained during its Trump-trade rally. Adding to the bullish narrative, US Treasury yields have lost steam across multiple maturities, providing further breathing room for Gold prices.
Looking ahead, this week’s spotlight will turn to a series of key global economic data releases, with preliminary Purchasing Managers’ Indexes (PMIs) taking the lead. Market participants will also be tuning in to comments from central bank officials, particularly in the wake of Fed Chair Jerome Powell’s recent cautious stance. On this, let’s recall that Powell highlighted the resilience of the US economy but reiterated the need for prudence when considering future rate cuts.
From a positioning standpoint, speculative interest in gold has softened. Non-commercial traders reduced their net long positions to approximately 236.5K contracts as of November 12—the lowest level since early June, according to the latest CFTC report. This decline in long positions coincides with a second straight drop in open interest, which could prop up some loss of traction from the recent downtrend in gold prices.

The daily chart of XAU/USD indicates a clear break above the bullish 100-day Simple Moving Average (SMA) above $2,550, which is close to the November low of $2,536. Further up comes the current weekly high of $2,650 (November 20) corresponds with the transitory 55-day SMA, confirming this first resistance zone. Up from here, the next minor objective is the $2,700 barrier, prior to the weekly top of $2,749 (November 5).
On the other side, a rapid breach of the temporary 100-day SMA at $2,554 should draw attention to the November low of $2,536 (November 14).
In the short term, the 4-hour chart indicates that the current recovery has more space to go. The Relative Strength Index (RSI) has recovered but confronts resistance at 65, while the Average Directional Index (ADX) near 34 suggests a lack of significant trend momentum for the time being.
On the upside, the next resistance level to monitor is $2,650, followed by the more important 200-SMA at $2,677. On the downside, support remains solid around $2,536, a critical level to monitor if prices reverse course.
The table below shows the percentage change of British Pound (GBP) against listed major currencies today. British Pound was the strongest against the New Zealand Dollar.
| USD | EUR | GBP | JPY | CAD | AUD | NZD | CHF | |
|---|---|---|---|---|---|---|---|---|
| USD | 0.61% | 0.18% | 0.31% | 0.35% | 0.66% | 0.72% | 0.18% | |
| EUR | -0.61% | -0.43% | -0.31% | -0.27% | 0.03% | 0.09% | -0.43% | |
| GBP | -0.18% | 0.43% | 0.10% | 0.16% | 0.46% | 0.52% | -0.01% | |
| JPY | -0.31% | 0.31% | -0.10% | 0.05% | 0.35% | 0.40% | -0.12% | |
| CAD | -0.35% | 0.27% | -0.16% | -0.05% | 0.31% | 0.37% | -0.16% | |
| AUD | -0.66% | -0.03% | -0.46% | -0.35% | -0.31% | 0.06% | -0.46% | |
| NZD | -0.72% | -0.09% | -0.52% | -0.40% | -0.37% | -0.06% | -0.53% | |
| CHF | -0.18% | 0.43% | 0.00% | 0.12% | 0.16% | 0.46% | 0.53% |
The heat map shows percentage changes of major currencies against each other. The base currency is picked from the left column, while the quote currency is picked from the top row. For example, if you pick the British Pound from the left column and move along the horizontal line to the US Dollar, the percentage change displayed in the box will represent GBP (base)/USD (quote).
The USD/CAD price analysis shows a bearish shift in sentiment after data revealed that inflation in Canada was higher than expected. Meanwhile, the dollar eased as safe-haven demand caused by Putin’s nuclear announcement faded.
–Are you interested in learning more about Canadian forex brokers? Check our detailed guide-
Data on Tuesday revealed that Canada’s inflation prices increased by 2.0% in October, above estimates of 1.9%. Moreover, it was well above the previous reading of 1.6%. Consequently, traders lowered bets for another super-sized rate cut in December.
Initially, low inflation and poor growth in Canada pushed the Bank of Canada to cut rates by 50-bps in October. Furthermore, markets were pricing a 38% chance of another such move in December. However, after the inflation report, this likelihood fell to 23%. As a result, the Canadian dollar rallied against the dollar.
On the other hand, the greenback eased after a rally early on Tuesday due to safe-haven demand. Traders rushed for safety after Putin announced a lower threshold for using nuclear power against Ukraine. This change came after Ukraine used US missiles to attack Russia. However, the US made no response, easing fears of a nuclear war and an escalation in the Russia-Ukraine war.
Meanwhile, markets await more clues on the outlook for Fed rate cuts. Policymakers have maintained a slightly hawkish tone, leading to a decline in bets for a December rate cut. Moreover, looming policy changes under Trump’s administration have changed the outlook for future Fed moves. Upbeat economic data will further support a pause in December. On the other hand, if data comes in line with forecasts or is slightly below, the Fed will cut rates by 25-bps in December.
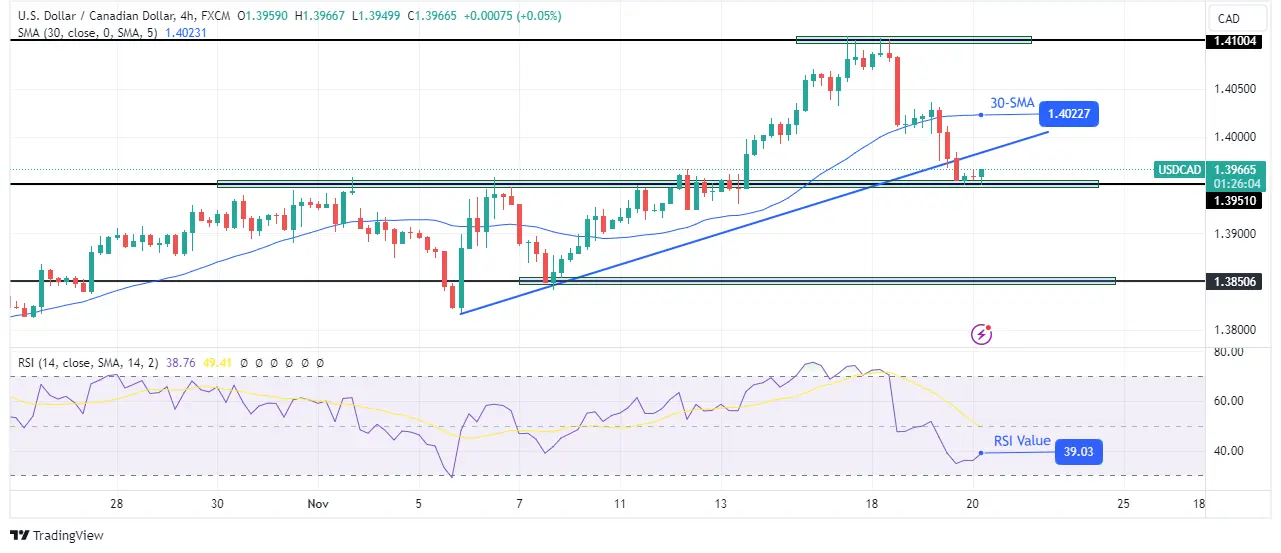
On the technical side, the USD/CAD price has broken below its bullish trendline, indicating a shift in sentiment. At the same time, the price trades far below the 30-SMA, showing a solid lead by bears. Meanwhile, the RSI trades near the oversold region, suggesting solid bearish momentum.
–Are you interested in learning more about high leveraged brokers? Check our detailed guide-
However, bears are facing the 1.3951 support level. A break below this level will allow bears to revisit the 1.3850 level. However, before that, the price might retest the recently broken trendline.
Looking to trade forex now? Invest at eToro!
68% of retail investor accounts lose money when trading CFDs with this provider. You should consider whether you can afford to take the high risk of losing your money
After falling toward 1.0520 in the European session on Tuesday, EUR/USD staged a rebound and closed the day virtually unchanged. The pair, however, lost its traction after meeting resistance near 1.0600 and started to edge lower toward 1.0550.
The table below shows the percentage change of Euro (EUR) against listed major currencies this week. Euro was the weakest against the Canadian Dollar.
| USD | EUR | GBP | JPY | CAD | AUD | NZD | CHF | |
|---|---|---|---|---|---|---|---|---|
| USD | -0.21% | -0.43% | 0.93% | -0.82% | -0.81% | -0.36% | -0.39% | |
| EUR | 0.21% | -0.05% | 1.25% | -0.50% | -0.46% | -0.03% | -0.07% | |
| GBP | 0.43% | 0.05% | 1.32% | -0.45% | -0.41% | 0.02% | -0.02% | |
| JPY | -0.93% | -1.25% | -1.32% | -1.74% | -1.66% | -1.21% | -1.24% | |
| CAD | 0.82% | 0.50% | 0.45% | 1.74% | 0.03% | 0.46% | 0.43% | |
| AUD | 0.81% | 0.46% | 0.41% | 1.66% | -0.03% | 0.43% | 0.39% | |
| NZD | 0.36% | 0.03% | -0.02% | 1.21% | -0.46% | -0.43% | -0.03% | |
| CHF | 0.39% | 0.07% | 0.02% | 1.24% | -0.43% | -0.39% | 0.03% |
The heat map shows percentage changes of major currencies against each other. The base currency is picked from the left column, while the quote currency is picked from the top row. For example, if you pick the Euro from the left column and move along the horizontal line to the US Dollar, the percentage change displayed in the box will represent EUR (base)/USD (quote).
The pullback seen in the US Treasury bond yields made it difficult for the US Dollar (USD) to gather strength on Tuesday and helped EUR/USD find a foothold. Nevertheless, the risk-averse market atmosphere on a further escalation of the Russia-Ukraine conflict didn’t allow the pair to extend its recovery.
Later in the session, the European Central Bank (ECB) will release the Negotiated Wage Rates data for the third quarter. In the second quarter, this data came in at 3.53%. A bigger increase in Q3 could help the Euro stay resilient against its major rivals with the immediate reaction. Additionally, ECB President Christine Lagarde will deliver a welcome address at the ECB Conference on Financial Stability and Macroprudential Policy in Frankfurt, Germany.
In the absence of high-tier data releases, the risk perception could drive EUR/USD’s action in the second half of the day. At the time of press, US stock index futures were up between 0.2% and 0.3%. A bullish opening in Wall Street could limit the USD’s gains but investors could refrain from moving towards risk-sensitive assets amid the uncertainty surrounding geopolitics.
The Relative Strength Index (RSI) indicator on the 4-hour chart retreated below 50, reflecting a lack of buyer interest. On the downside, immediate support is located at 1.0550 (static level) before 1.0500 (round level).
In case EUR/USD rises above 1.0600 (50-period Simple Moving Average (SMA), Fibonacci 23.6% retracement of the latest downtrend), it could meet next resistances at 1.0670 (Fibonacci 38.2% retracement) and 1.0715-1.0720 (100-period SMA, Fibonacci 50% retracement).
The Euro is the currency for the 19 European Union countries that belong to the Eurozone. It is the second most heavily traded currency in the world behind the US Dollar. In 2022, it accounted for 31% of all foreign exchange transactions, with an average daily turnover of over $2.2 trillion a day. EUR/USD is the most heavily traded currency pair in the world, accounting for an estimated 30% off all transactions, followed by EUR/JPY (4%), EUR/GBP (3%) and EUR/AUD (2%).
The European Central Bank (ECB) in Frankfurt, Germany, is the reserve bank for the Eurozone. The ECB sets interest rates and manages monetary policy. The ECB’s primary mandate is to maintain price stability, which means either controlling inflation or stimulating growth. Its primary tool is the raising or lowering of interest rates. Relatively high interest rates – or the expectation of higher rates – will usually benefit the Euro and vice versa. The ECB Governing Council makes monetary policy decisions at meetings held eight times a year. Decisions are made by heads of the Eurozone national banks and six permanent members, including the President of the ECB, Christine Lagarde.
Eurozone inflation data, measured by the Harmonized Index of Consumer Prices (HICP), is an important econometric for the Euro. If inflation rises more than expected, especially if above the ECB’s 2% target, it obliges the ECB to raise interest rates to bring it back under control. Relatively high interest rates compared to its counterparts will usually benefit the Euro, as it makes the region more attractive as a place for global investors to park their money.
Data releases gauge the health of the economy and can impact on the Euro. Indicators such as GDP, Manufacturing and Services PMIs, employment, and consumer sentiment surveys can all influence the direction of the single currency. A strong economy is good for the Euro. Not only does it attract more foreign investment but it may encourage the ECB to put up interest rates, which will directly strengthen the Euro. Otherwise, if economic data is weak, the Euro is likely to fall. Economic data for the four largest economies in the euro area (Germany, France, Italy and Spain) are especially significant, as they account for 75% of the Eurozone’s economy.
Another significant data release for the Euro is the Trade Balance. This indicator measures the difference between what a country earns from its exports and what it spends on imports over a given period. If a country produces highly sought after exports then its currency will gain in value purely from the extra demand created from foreign buyers seeking to purchase these goods. Therefore, a positive net Trade Balance strengthens a currency and vice versa for a negative balance.
Silver price (XAG/USD) extends its correction below $31.00 in European trading hours on Wednesday after facing selling pressure near $31.50 on Tuesday. The white metal falls back as fresh escalation in the Russia-Ukraine war inspired by President Vladimir Putin’s approval to lowering the threshold for counter attack by nuclear weapons faded after Russian Foreign Minister Sergei Lavrov said the country will “do everything possible” to avoid the onset of nuclear war.
Putin cleared revision in the nuclear doctrine after US President Joe Biden provided the Army Tactical Missile System (ATACMS) to Ukraine and permitted them to launch deep into Russian territory. Historically, demand for safe-haven assets such as Silver, strengthens in times of uncertainty and heightened geopolitical risks.
A sharp recovery in the US Treasury yields has also weighed on the Silver price. 10-year US Treasury yields jump to near 4.42% on expectations of fewer interest rate cuts from the Federal Reserve (Fed) in its current policy-easing cycle. Higher yields on interest-bearing assets increase the opportunity cost of holding an investment in non-yielding assets, such as Silver. The US Dollar Index (DXY), which gauges Greenback’s value against six major currencies, bounces back strongly above 106.60.
Market participants expect the economic agenda of President-elected Donald Trump will boost the United States (US) inflation and economic growth, a scenario that will force the Fed to follow a gradual rate-cut approach.
Silver price stays on track toward the upward-sloping trendline around $29.00, plotted from the February low of $22.30, which also coincides with the 200-day Exponential Moving Average (EMA). The white metal falls back after facing selling pressure near the 50-day EMA, which trades around $31.40.
The asset weakened after the breakdown of the horizontal support plotted from the May 21 high of $32.50.
The 14-day Relative Strength Index (RSI) slides to near 40.00. A bearish momentum will trigger if the RSI (14) sustains below the same.
Silver is a precious metal highly traded among investors. It has been historically used as a store of value and a medium of exchange. Although less popular than Gold, traders may turn to Silver to diversify their investment portfolio, for its intrinsic value or as a potential hedge during high-inflation periods. Investors can buy physical Silver, in coins or in bars, or trade it through vehicles such as Exchange Traded Funds, which track its price on international markets.
Silver prices can move due to a wide range of factors. Geopolitical instability or fears of a deep recession can make Silver price escalate due to its safe-haven status, although to a lesser extent than Gold’s. As a yieldless asset, Silver tends to rise with lower interest rates. Its moves also depend on how the US Dollar (USD) behaves as the asset is priced in dollars (XAG/USD). A strong Dollar tends to keep the price of Silver at bay, whereas a weaker Dollar is likely to propel prices up. Other factors such as investment demand, mining supply – Silver is much more abundant than Gold – and recycling rates can also affect prices.
Silver is widely used in industry, particularly in sectors such as electronics or solar energy, as it has one of the highest electric conductivity of all metals – more than Copper and Gold. A surge in demand can increase prices, while a decline tends to lower them. Dynamics in the US, Chinese and Indian economies can also contribute to price swings: for the US and particularly China, their big industrial sectors use Silver in various processes; in India, consumers’ demand for the precious metal for jewellery also plays a key role in setting prices.
Silver prices tend to follow Gold’s moves. When Gold prices rise, Silver typically follows suit, as their status as safe-haven assets is similar. The Gold/Silver ratio, which shows the number of ounces of Silver needed to equal the value of one ounce of Gold, may help to determine the relative valuation between both metals. Some investors may consider a high ratio as an indicator that Silver is undervalued, or Gold is overvalued. On the contrary, a low ratio might suggest that Gold is undervalued relative to Silver.
(MENAFN– Daily Forex)
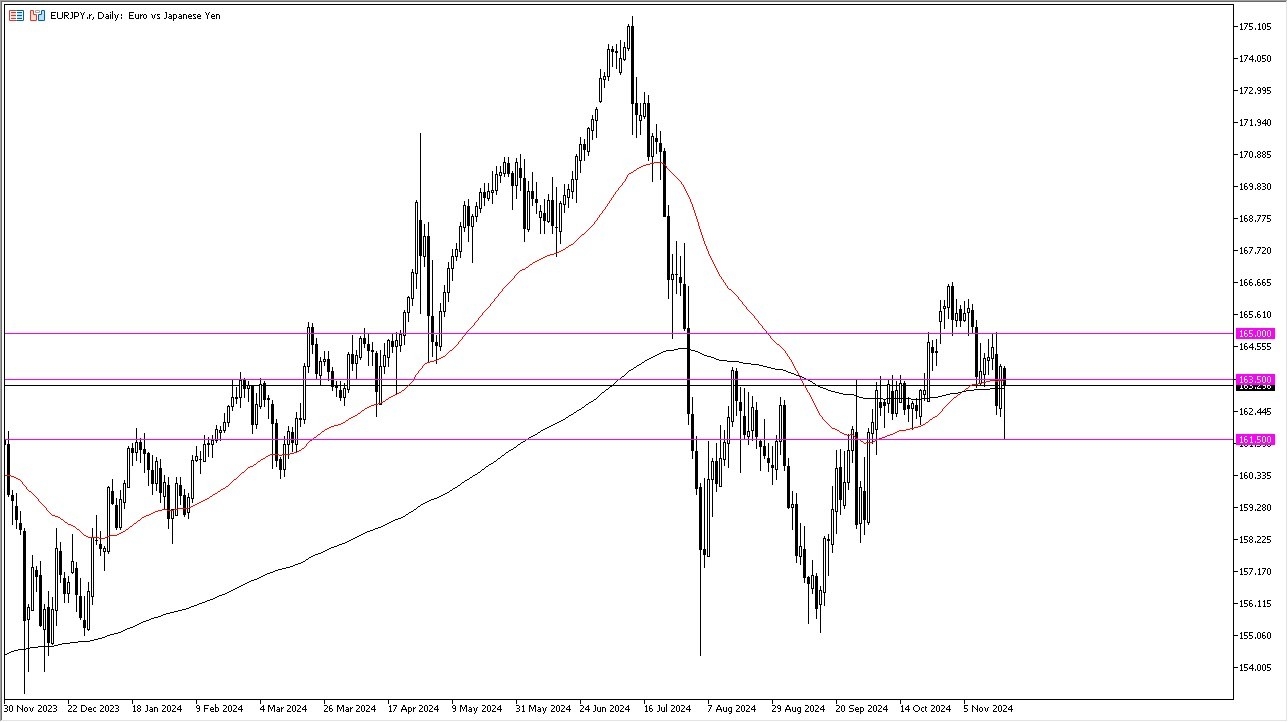
The euro tumbled against the Japanese yen on Tuesday, driven by heightened market anxiety over reports of Russia easing nuclear weapon restrictions following Ukraine’s launch of six NATO-provided missiles into Russian territory.
Because of this, there was a rush to safety and Europe wasn’t exactly the place people wanted to run to.
So, it all sets up for an obvious trade here.
That being said, it looks like cooler heads have prevailed and the 161.50 yen level has offered enough support to turn things around and form a bit of a hammer. The 163.50 level is an area that’s been like a bit of a magnet for price and previously it had been major resistance. So, the fact that we’re there again does make me very interested in this EUR/JPY pair, as this could be some kind of signal on where we go overall.Top Forex Brokers1 Get Started 74% of retail CFD accounts lose money If We Can Break HigherIf we can turn around and break above the highs of the trading session on Monday, then we may have the juice to go looking to the 165 yen level, possibly even the 166.50 yen level. Longer term, I still think this pair goes higher, mainly due to the fact that the Japanese have absolutely no way whatsoever to tighten monetary policy in any meaningful manner otherwise, they will trash the Japanese economy. If there is a run to safety for whatever reason, if we break down below the 161 yen level, then I think the bottom in this pair falls apart. And you probably then start to see Japanese yen strength against pretty much everything. All things being equal though, the Japanese are somewhat stuck. And I think that even the lowly euro will continue to find buyers against it although it might be a choppy road on the way higher.EURUSD Chart by TradingViewWant to trade our daily forex analysis and predictions? Here’s a list of forex brokers in Japan to check out.
MENAFN20112024000131011023ID1108905431

Legal Disclaimer:
MENAFN provides the information “as is” without warranty of any kind. We do not accept any responsibility or liability for the accuracy, content, images, videos, licenses, completeness, legality, or reliability of the information contained in this article. If you have any complaints or copyright issues related to this article, kindly contact the provider above.
GBP/USD trades in positive territory slightly above 1.2700 early Wednesday as markets assess latest inflation readings from the UK. The pair’s near-term technical picture highlights a buildup of recovery momentum.
The table below shows the percentage change of British Pound (GBP) against listed major currencies today. British Pound was the strongest against the Japanese Yen.
| USD | EUR | GBP | JPY | CAD | AUD | NZD | CHF | |
|---|---|---|---|---|---|---|---|---|
| USD | 0.12% | -0.20% | 0.59% | 0.00% | 0.16% | 0.26% | 0.24% | |
| EUR | -0.12% | -0.32% | 0.48% | -0.12% | 0.03% | 0.13% | 0.11% | |
| GBP | 0.20% | 0.32% | 0.77% | 0.20% | 0.35% | 0.45% | 0.44% | |
| JPY | -0.59% | -0.48% | -0.77% | -0.60% | -0.45% | -0.36% | -0.37% | |
| CAD | -0.00% | 0.12% | -0.20% | 0.60% | 0.16% | 0.26% | 0.24% | |
| AUD | -0.16% | -0.03% | -0.35% | 0.45% | -0.16% | 0.10% | 0.08% | |
| NZD | -0.26% | -0.13% | -0.45% | 0.36% | -0.26% | -0.10% | -0.02% | |
| CHF | -0.24% | -0.11% | -0.44% | 0.37% | -0.24% | -0.08% | 0.02% |
The heat map shows percentage changes of major currencies against each other. The base currency is picked from the left column, while the quote currency is picked from the top row. For example, if you pick the British Pound from the left column and move along the horizontal line to the US Dollar, the percentage change displayed in the box will represent GBP (base)/USD (quote).
The UK’s Office for National Statistics reported that annual inflation in the UK, as measured by the change in the Consumer Price Index (CPI), climbed to 2.3% in October from 1.7% in September, surpassing the market expectation of 2.2%. Additionally, the Core CPI, which excludes volatile food and energy prices, rose 3.3% in the same period, up from 3.2% in September. On a monthly basis, the CPI increased 0.6% after staying unchanged in September.
According to Reuters, UK rate futures point to 59 basis points (bps) of Bank of England (BoE) rate cuts by the end of 2025, vs 64 bps before stronger-than-forecast UK inflation data.
In the second half of the day, BoE Deputy Governor Sarah Breeden and Deputy Governor Dave Ramsden will be delivering speeches. While testifying before the UK Treasury Select Committee on Tuesday, BoE Governor Andrew Bailey noted that a gradual approach to removing monetary policy restraint will help them observe risks to the inflation outlook. In case BoE officials adopt a cautious tone regarding further policy easing, citing latest inflation readings, GBP/USD could continue to stretch higher.
The US economic calendar will not offer any high-impact macroeconomic data releases on Wednesday. Meanwhile, investors will keep a close eye on headlines surrounding the Russia-Ukraine conflict. A further escalation of geopolitical tensions could help the US Dollar (USD) stay resilient against its rivals and limit GBP/USD’s upside.
The Relative Strength Index (RSI) indicator on the 4-hour chart climbed above 50 early Wednesday, highlighting an increasing buyer interest. GBP/USD was last seen trading slightly above 1.2700, where the Fibonacci 23.6% retracement level of the latest downtrend is located. In case the pair confirms this level as support, it could face next resistance at 1.2740-1.2750 (50-period Simple Moving Average (SMA), Fibonacci 38.2% retracement) before 1.2800 (Fibonacci 50% retracement).
If GBP/USD fails to stabilize above 1.2700 and retreats below this level, the 20-period SMA at 1.2650 could be seen as next support ahead of 1.2600 (static level).
Inflation measures the rise in the price of a representative basket of goods and services. Headline inflation is usually expressed as a percentage change on a month-on-month (MoM) and year-on-year (YoY) basis. Core inflation excludes more volatile elements such as food and fuel which can fluctuate because of geopolitical and seasonal factors. Core inflation is the figure economists focus on and is the level targeted by central banks, which are mandated to keep inflation at a manageable level, usually around 2%.
The Consumer Price Index (CPI) measures the change in prices of a basket of goods and services over a period of time. It is usually expressed as a percentage change on a month-on-month (MoM) and year-on-year (YoY) basis. Core CPI is the figure targeted by central banks as it excludes volatile food and fuel inputs. When Core CPI rises above 2% it usually results in higher interest rates and vice versa when it falls below 2%. Since higher interest rates are positive for a currency, higher inflation usually results in a stronger currency. The opposite is true when inflation falls.
Although it may seem counter-intuitive, high inflation in a country pushes up the value of its currency and vice versa for lower inflation. This is because the central bank will normally raise interest rates to combat the higher inflation, which attract more global capital inflows from investors looking for a lucrative place to park their money.
Formerly, Gold was the asset investors turned to in times of high inflation because it preserved its value, and whilst investors will often still buy Gold for its safe-haven properties in times of extreme market turmoil, this is not the case most of the time. This is because when inflation is high, central banks will put up interest rates to combat it. Higher interest rates are negative for Gold because they increase the opportunity-cost of holding Gold vis-a-vis an interest-bearing asset or placing the money in a cash deposit account. On the flipside, lower inflation tends to be positive for Gold as it brings interest rates down, making the bright metal a more viable investment alternative.
Gold price stays on the front foot early Wednesday, looking to regain the $2,650 barrier as the road to recovery extends for the third straight day. Traders now await the upcoming speeches from US Federal Reserve (Fed) policymakers and Nvidia’s earnings report amid lingering geopolitical concerns between Russia and Ukraine.
The US Dollar (USD) seems to find fresh demand in Asian trading on Wednesday, tracking the uptick in the US Treasury bond yields as broader market sentiment improves on China’s stimulus hopes.
Markets were cautious earlier following the People’s Bank of China’s (PBOC) inaction on the Loan Prime Rates (LPR). However, expectations that China will roll out more stimulus to prop up the economy are lifting the market mood.
Further, worries over a further geopolitical escalation between Russia and Ukraine seem to fade, lifting risk appetite.
However, Gold buyers refuse to give up so far, anticipating a shift in risk sentiment if the American AI giant Nvidia Inc.’s earnings report disappoints and triggers a wave of risk aversion across the financial markets.
Also, the developments surrounding Russia and Ukraine will be closely eyed, keeping the demand for the traditional safe-haven Gold price underpinned.
On Tuesday, Russia’s Defence Ministry said that Ukraine fired six US-made Army Tactical Missile Systems (ATACMS) missiles at Bryansk region, just days after US President Joe Biden allowed the Ukrainian use of American-made weapons to strike inside Russia.
The Kremlin confirmed Tuesday that they lowered the threshold for a possible nuclear strike in response to non-nuclear attacks on Russia.
Besides, the Fedspeak will help gauge the US central bank’s path forward on interest rates, with markets now pricing in a 60% chance that the Fed will cut rates by 25 basis points (bps) in December.
The short-term technical outlook for Gold price remains the same, with traders likely to adopt a ‘sell on bounce’ trade strategy as the 14-day Relative Strength Index (RSI) remains below the 50 level. The indicator is currently trading near 47.
An impending Bear Cross adds credence to the downside potential. The 21-day Simple Moving Average (SMA) is looking to cross the 50-day SMA above. If that happens on a daily closing basis, it will validate the bearish crossover.
That said, failure to find acceptance above the 50-day SMA at $2,660 on a daily closing basis could reinforce sellers toward the $2,600 threshold.
The previous day’s low of $2,610 will be tested ahead of that.
On the flip side, the immediate resistance is seen at the 50-day SMA, above which the 21-day SMA at $2,682 will come into play.
Additional recovery could face stiff resistance at the $2,700 threshold.
Gold has played a key role in human’s history as it has been widely used as a store of value and medium of exchange. Currently, apart from its shine and usage for jewelry, the precious metal is widely seen as a safe-haven asset, meaning that it is considered a good investment during turbulent times. Gold is also widely seen as a hedge against inflation and against depreciating currencies as it doesn’t rely on any specific issuer or government.
Central banks are the biggest Gold holders. In their aim to support their currencies in turbulent times, central banks tend to diversify their reserves and buy Gold to improve the perceived strength of the economy and the currency. High Gold reserves can be a source of trust for a country’s solvency. Central banks added 1,136 tonnes of Gold worth around $70 billion to their reserves in 2022, according to data from the World Gold Council. This is the highest yearly purchase since records began. Central banks from emerging economies such as China, India and Turkey are quickly increasing their Gold reserves.
Gold has an inverse correlation with the US Dollar and US Treasuries, which are both major reserve and safe-haven assets. When the Dollar depreciates, Gold tends to rise, enabling investors and central banks to diversify their assets in turbulent times. Gold is also inversely correlated with risk assets. A rally in the stock market tends to weaken Gold price, while sell-offs in riskier markets tend to favor the precious metal.
The price can move due to a wide range of factors. Geopolitical instability or fears of a deep recession can quickly make Gold price escalate due to its safe-haven status. As a yield-less asset, Gold tends to rise with lower interest rates, while higher cost of money usually weighs down on the yellow metal. Still, most moves depend on how the US Dollar (USD) behaves as the asset is priced in dollars (XAU/USD). A strong Dollar tends to keep the price of Gold controlled, whereas a weaker Dollar is likely to push Gold prices up.

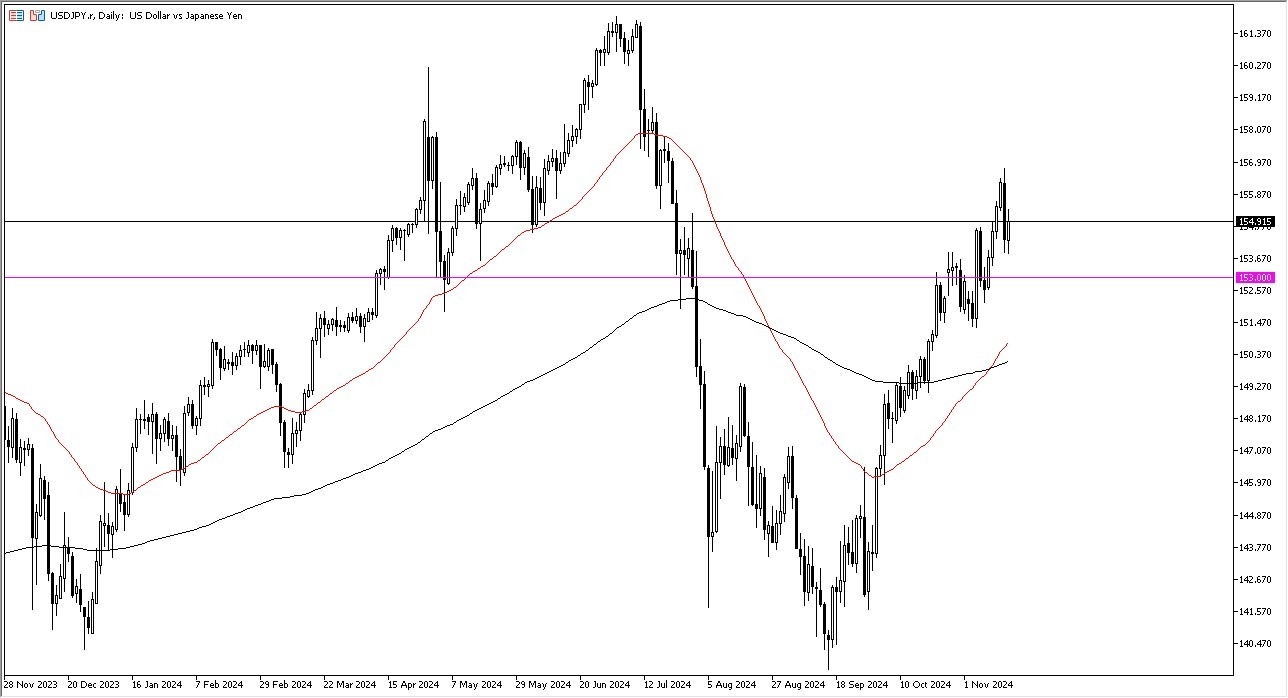
Do not forget the carry trade. This of course has a major influence on what happens next, and it’s probably worth noting that most traders are very well aware of the fact that they get paid at the end of every day when they hold this pair. In fact, I think that will continue to be the story here, despite the fact that the Federal Reserve has tried to do everything it can to bring down the rates. Quite frankly, traders in the bond market don’t want to hear about it, and it has made interest rates rise. If that’s going to be the case, then the US dollar will be much more preferable than the Japanese yen going forward, which of course is settled by extraordinarily loose monetary policy.
Further bolstering the carry trade will be the technical analysis, which of course is very bullish. The 50 Day EMA has recently broken above the 200 Day EMA, kicking off the so-called “golden cross.” Furthermore, I think that the ¥153 level is an area that people will be paying close attention to, as it is a large, round, psychologically significant figure. This area should offer support, and I think that if we were to drop below it, it could change a lot of things but right now it just doesn’t look very likely to happen. Yes, we did get a massive bearish engulfing candlestick for the Friday session, but I think in the big scheme of things it won’t really matter.
Ready to trade our daily forex forecast? Here are Japan’s Best Forex Brokers to choose from.
That being said, it looks like cooler heads have prevailed and the 161.50 yen level has offered enough support to turn things around and form a bit of a hammer. The 163.50 level is an area that’s been like a bit of a magnet for price and previously it had been major resistance. So, the fact that we’re there again does make me very interested in this EUR/JPY pair, as this could be some kind of signal on where we go overall.
If we can turn around and break above the highs of the trading session on Monday, then we may have the juice to go looking to the 165 yen level, possibly even the 166.50 yen level. Longer term, I still think this pair goes higher, mainly due to the fact that the Japanese have absolutely no way whatsoever to tighten monetary policy in any meaningful manner otherwise, they will trash the Japanese economy.
If there is a run to safety for whatever reason, if we break down below the 161 yen level, then I think the bottom in this pair falls apart. And you probably then start to see Japanese yen strength against pretty much everything. All things being equal though, the Japanese are somewhat stuck. And I think that even the lowly euro will continue to find buyers against it although it might be a choppy road on the way higher.
Want to trade our daily forex analysis and predictions? Here’s a list of forex brokers in Japan to check out.