The main category of Forex News.
You can use the search box below to find what you need.
[wd_asp id=1]
The main category of Forex News.
You can use the search box below to find what you need.
[wd_asp id=1]

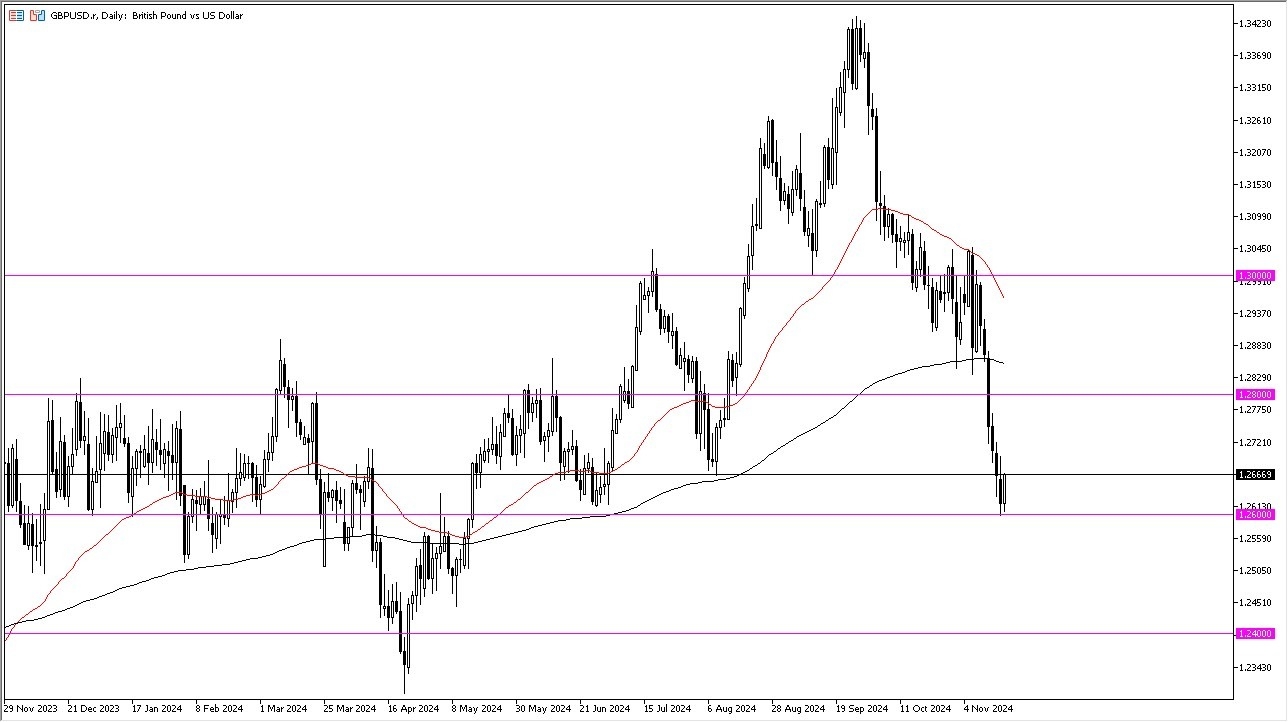
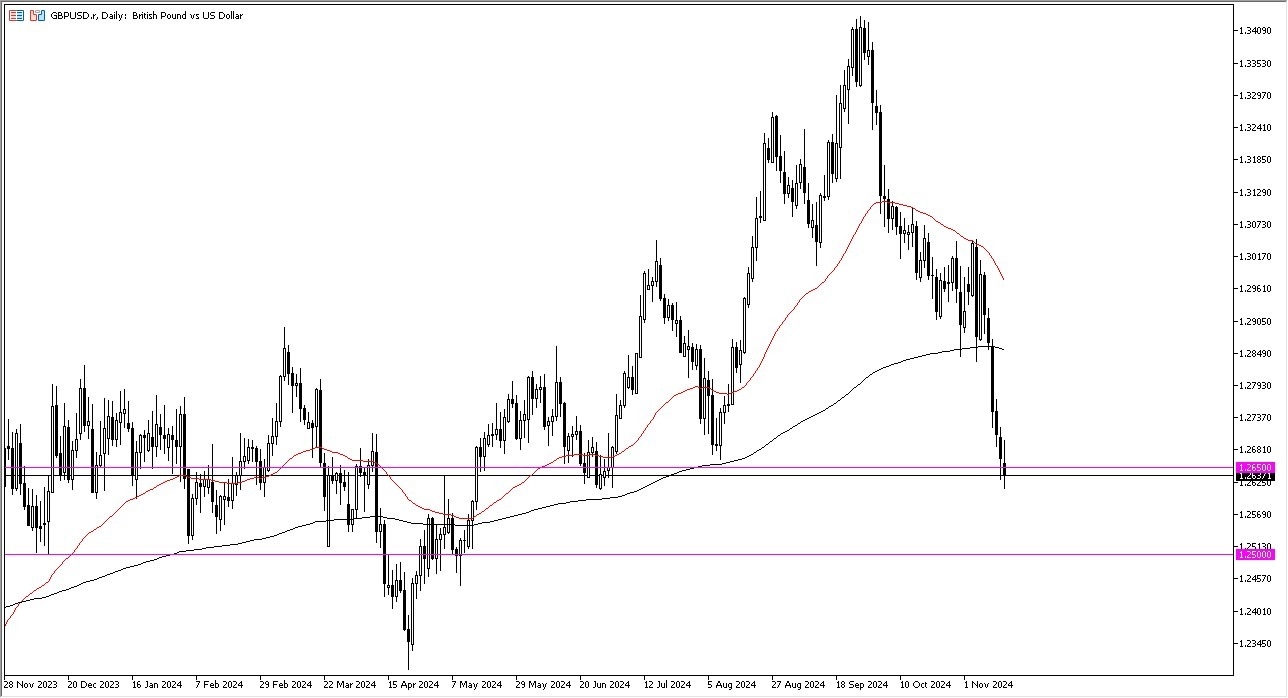
So, with all that being said, I think what we’re seeing here is a little bit of calming down of the dollar bullishness. That does not mean that we are looking at some type of major trend change. I don’t expect that to be the case. I think we get a little bit of a move here, perhaps even most of the week, until we start seeing seller pressure again.
Seller pressure will come in right around the 1.28 level, I suspect, or perhaps just above there at the 200 day EMA. We do get PMI numbers from both manufacturing and services from multiple economies around the world on Friday. So, between now and then, you might have a little bit of profit taking in the greenback.
But I would also say that if we were to break down below the 1.26 level, that could open up the floodgates for another 200 pips. All things being equal, I think you’ve got a couple of days of a relief rally just waiting to get stepped on again. The Federal Reserve, although somewhat dovish, there are questions as to whether or not they can cut in December, and that’s part of what we’ve seen over the last week or so, as the markets are trying to sort out what Jerome Powell and company do next.
Ready to trade our daily GBP/USD Forex forecast? Here’s some of the best forex broker UK reviews to check out.
The USD/JPY outlook shows a stronger yen as Ueda’s hawkish remarks increase the likelihood of a December BoJ rate cut. Meanwhile, the dollar remained steady as markets priced a more gradual pace for Fed rate cuts.
–Are you interested in learning more about Canadian forex brokers? Check our detailed guide-
Bank of Japan governor Kazuo Ueda, in his speech on Monday, noted that Japan’s economy was on the right path. Therefore, the central bank would need to hike rates in the near future. His remarks increased the likelihood of a rate hike in December to 54%, boosting the yen. However, Ueda failed to give clear guidance on the possible timing for the next rate hike.
The outlook for Japan’s currency had improved slightly when the Bank of Japan started increasing interest rates and the Fed began cutting. However, the Fed’s policy outlook has changed significantly since Trump won the election. The US central bank might not cut rates as much as previously expected since Trump’s policies might increase inflation.
Consequently, the rate differential between Japan and the US will likely remain wide, weighing on the yen. At the same time, Fed policymakers sounded more hawkish, with Powell stating there was no rush to lower borrowing costs. On the other hand, top officials in Japan are getting worried about a weak yen. Therefore, they are piling pressure on the Bank of Japan to hike rates.
A BoJ rate hike might give the yen temporary support. However, as long as demand and inflation go up with Trump’s administration, the dollar will remain strong, putting pressure on the yen.
Market participants do not expect any key reports from Japan or the US. Therefore, they might continue with the Trump trade.
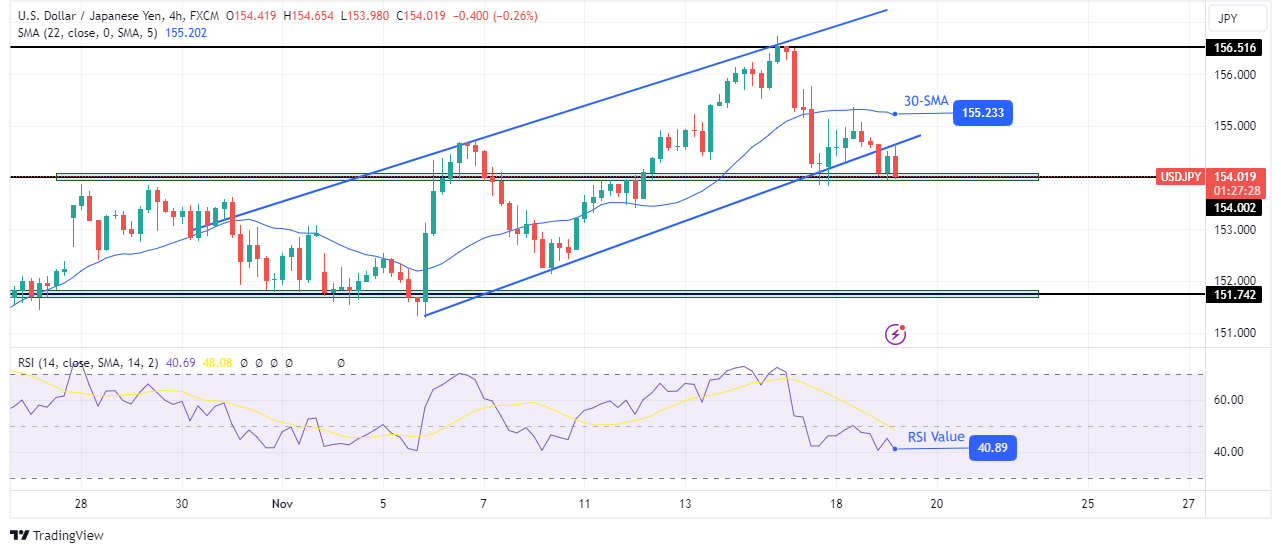
On the technical side, the USD/JPY price has broken out of its bullish channel, with bears leading the way. The decline started at the 156.51 resistance level. Price action changed to show strong bearish candles, which broke below the 30-SMA.
–Are you interested in learning more about high leveraged brokers? Check our detailed guide-
Initially, the price paused at the channel support. However, bears made another attempt at the level and broke below. The price is now facing the 154.00 support level. A break below will allow USD/JPY to reach the 151.74 level.
Looking to trade forex now? Invest at eToro!
68% of retail investor accounts lose money when trading CFDs with this provider. You should consider whether you can afford to take the high risk of losing your money
I would be a buyer of this pair if we can recapture the ¥164 level. If we get above there, I would put a stop loss at the ¥163 level and aim for the ¥167 level.
All things being equal, this is a pair that continues to favor interest rate differentials for the euro, with this being the case, the market is likely to continue to see a lot of people getting involved, as they can get paid at the end of every day to hang on to this pair. Quite frankly, even though the euro itself isn’t necessarily a currency that I liked, it is going to probably fare better than the Japanese yen going forward.
The technical analysis for the EUR/JPY currency pair of course suggests that there is a lot of support in this area, as the ¥163 level is an area that we’ve seen a lot of action at previously. That being said, the market is likely to continue to see the area between they are in the ¥162 level as a major “squishy support level.” By doing so, the market is likely to continue to see a lot of value hunters out there trying to get involved, and therefore I think you’ve got a scenario where people will look for a value play to get long again.
If we were to break down below the ¥161 level, then it’s likely that the pair could drop down to the ¥158.50 level, which is an area that we have seen a lot of support at previously. That would be a target for short sellers, but at this point in time I think they will probably be repudiated long before we get to that area.
Ready to trade our daily Forex forecast? Here’s a list of some of the best regulated forex brokers to check out.
Silver price (XAG/USD) continues to gain ground for the second consecutive day, trading around $31.40 per troy ounce during the Asian session on Tuesday. The prices of the dollar-denominated Silver recover from two-month lows as the US Dollar (USD) experiences profit-taking selling after a recent rally. This rally was fueled by expectations of fewer Federal Reserve (Fed) rate cuts and optimism about US economic outperformance under the incoming Trump administration.
Meanwhile, safe-haven Silver is gaining traction amid rising geopolitical tensions. US President Joe Biden authorized Ukraine to use US-made weapons for strikes deep within Russia, a move that escalated concerns in the region. In response, the Kremlin issued a warning on Monday, vowing to retaliate against what it called a reckless decision by the Biden administration. Russia had earlier cautioned that such actions could significantly increase the risk of confrontation with NATO.
Non-yielding assets like Silver faced headwinds after Fed Chair Jerome Powell tempered expectations of immediate rate cuts. Powell emphasized the economy’s strength, a robust labor market, and ongoing inflationary pressures. He stated, “The economy is not sending any signals that we need to be in a hurry to lower rates.” Investors now await additional remarks from Fed officials this week for further insight into the trajectory of US interest rates.
Markets are closely monitoring China’s upcoming Loan Prime Rate (LPR) decision, anticipating potential additional stimulus measures to support economic growth. This follows the recent 10 trillion Yuan debt package, which did not include direct economic stimulus, heightening market concerns. As one of the world’s largest manufacturing hubs for electronics, solar panels, and automotive components, China’s industrial demand for Silver remains a key factor influencing its prices.
Silver is a precious metal highly traded among investors. It has been historically used as a store of value and a medium of exchange. Although less popular than Gold, traders may turn to Silver to diversify their investment portfolio, for its intrinsic value or as a potential hedge during high-inflation periods. Investors can buy physical Silver, in coins or in bars, or trade it through vehicles such as Exchange Traded Funds, which track its price on international markets.
Silver prices can move due to a wide range of factors. Geopolitical instability or fears of a deep recession can make Silver price escalate due to its safe-haven status, although to a lesser extent than Gold’s. As a yieldless asset, Silver tends to rise with lower interest rates. Its moves also depend on how the US Dollar (USD) behaves as the asset is priced in dollars (XAG/USD). A strong Dollar tends to keep the price of Silver at bay, whereas a weaker Dollar is likely to propel prices up. Other factors such as investment demand, mining supply – Silver is much more abundant than Gold – and recycling rates can also affect prices.
Silver is widely used in industry, particularly in sectors such as electronics or solar energy, as it has one of the highest electric conductivity of all metals – more than Copper and Gold. A surge in demand can increase prices, while a decline tends to lower them. Dynamics in the US, Chinese and Indian economies can also contribute to price swings: for the US and particularly China, their big industrial sectors use Silver in various processes; in India, consumers’ demand for the precious metal for jewellery also plays a key role in setting prices.
Silver prices tend to follow Gold’s moves. When Gold prices rise, Silver typically follows suit, as their status as safe-haven assets is similar. The Gold/Silver ratio, which shows the number of ounces of Silver needed to equal the value of one ounce of Gold, may help to determine the relative valuation between both metals. Some investors may consider a high ratio as an indicator that Silver is undervalued, or Gold is overvalued. On the contrary, a low ratio might suggest that Gold is undervalued relative to Silver.
Gold price extends the recovery into Asian trading on Tuesday, reversing half the previous week’s decline. The focus remains on the upcoming speeches from US Federal Reserve (Fed) policymakers and geopolitical tensions between Russia and Ukraine.
Gold price stays firm for the second consecutive day so far, drawing support from the recent retracement in the US Treasury bond yields across the curve, fuelling the corrective downside in the US Dollar (USD) against its major currency rivals.
The US bond yields have embarked upon a correction mode as investors remain wary of the impact of the potential fiscal and trade policies to be introduced by US President-elect Donald Trump on the economic and inflation outlook.
Additionally, Gold price capitalizes on the renewed geopolitical escalation between Russia and Ukraine after US President Joe Biden authorized Ukraine to use American Army Tactical Missile Systems (ATACMS) to strike inside Russia on Sunday. The decision to allow the use of long-range US weapons inside Russia came after Moscow deployed North Korean ground troops to supplement its own forces.
Moreover, expectations of more stimulus measures coming in from China also bode well for the bright metal. China is the world’s top Gold consumer. Securities Journal, Chinese state media, quoted analysts saying further cuts to the Reserve Requirement Ratio (RRR) coming this year.
Note that China is the world’s top Gold consumer, and any support measures by the local authorities to boost economic performance seem positive for the precious metal. However, it remains to be seen if Gold price manages to hold on to its recovery momentum as traders turn cautious, awaiting more cues on the Fed’s interest rate outlook from the central bank talks due Tuesday and later this week.
Also, traders could refrain from placing fresh bets on the yellow metal ahead of the American AI giant Nvidia Inc.’s earnings report, which could significantly impact the broader market sentiment and the value of the USD, eventually influencing the USD-sensitive Gold price.
Technically, Gold price appears to be a ‘sell on bounce’ trade as long as the 14-day Relative Strength Index (RSI) remains below the 50 level. The indicator is currently trading near 45.
The immediate resistance is seen at the $2,630 round number, above which a strong topside barrier aligns at the 50-day Simple Moving Average (SMA) at $2,655.
Acceptance above the latter is critical to sustaining the recovery mode from two-month troughs of $2,537.
The next stiff resistance is located at $2,687, the 21-day SMA.
Failing to find a foothold above the 50-day SMA on a daily closing basis could revive the bearish sentiment, reinforcing sellers toward the $2,600 threshold.
Additional declines could threaten the confluence support at $2,551, where the 100-day SMA coincides with the September 18 low.
A sustained break below the last will trigger a fresh downtrend toward the $2,500 threshold, with the next bearish target seen at the September 4 low of $2,472.
Gold has played a key role in human’s history as it has been widely used as a store of value and medium of exchange. Currently, apart from its shine and usage for jewelry, the precious metal is widely seen as a safe-haven asset, meaning that it is considered a good investment during turbulent times. Gold is also widely seen as a hedge against inflation and against depreciating currencies as it doesn’t rely on any specific issuer or government.
Central banks are the biggest Gold holders. In their aim to support their currencies in turbulent times, central banks tend to diversify their reserves and buy Gold to improve the perceived strength of the economy and the currency. High Gold reserves can be a source of trust for a country’s solvency. Central banks added 1,136 tonnes of Gold worth around $70 billion to their reserves in 2022, according to data from the World Gold Council. This is the highest yearly purchase since records began. Central banks from emerging economies such as China, India and Turkey are quickly increasing their Gold reserves.
Gold has an inverse correlation with the US Dollar and US Treasuries, which are both major reserve and safe-haven assets. When the Dollar depreciates, Gold tends to rise, enabling investors and central banks to diversify their assets in turbulent times. Gold is also inversely correlated with risk assets. A rally in the stock market tends to weaken Gold price, while sell-offs in riskier markets tend to favor the precious metal.
The price can move due to a wide range of factors. Geopolitical instability or fears of a deep recession can quickly make Gold price escalate due to its safe-haven status. As a yield-less asset, Gold tends to rise with lower interest rates, while higher cost of money usually weighs down on the yellow metal. Still, most moves depend on how the US Dollar (USD) behaves as the asset is priced in dollars (XAU/USD). A strong Dollar tends to keep the price of Gold controlled, whereas a weaker Dollar is likely to push Gold prices up.
The Euro recovered some ground versus the British Pound on Monday as traders digested the latest UK Gross Domestic Product (GDP) report, which hinted the economy is slowing down. The EUR/GBP trades at 0.8359, up by 0.11%.
The EUR/GBP extended its gains past the psychological 0.8350 area, though buyers remain unable to crack 0.8400. Additionally, sellers leaning to the 50-day Simple Moving Average (SMA) at 0.8360 keep the cross pair from reaching 0.84 despite printing a daily peak of 0.8373.
If bulls clear 0.8373 and 0.84, the next stop would be the 100-day SMA at 0.8413. A breach of the latter will expose the 200-DMA at 0.8475.
Conversely, if EUR/GBP retreats below 0.8350, the first support would be the November 14 low of 0.8306. Once surpassed, the next floor would be the November 11 swing low of 0.8260.
Oscillators such as the Relative Strength Index (RSI) suggest bulls are gathering momentu, as the RSI cleared its neutral line, turning bullish.
The table below shows the percentage change of Euro (EUR) against listed major currencies today. Euro was the strongest against the Japanese Yen.
| USD | EUR | GBP | JPY | CAD | AUD | NZD | CHF | |
|---|---|---|---|---|---|---|---|---|
| USD | -0.24% | -0.05% | 0.43% | -0.04% | -0.05% | 0.28% | -0.23% | |
| EUR | 0.24% | 0.36% | 0.77% | 0.32% | 0.35% | 0.64% | 0.14% | |
| GBP | 0.05% | -0.36% | 0.43% | -0.05% | -0.02% | 0.27% | -0.24% | |
| JPY | -0.43% | -0.77% | -0.43% | -0.48% | -0.41% | -0.09% | -0.58% | |
| CAD | 0.04% | -0.32% | 0.05% | 0.48% | 0.01% | 0.32% | -0.18% | |
| AUD | 0.05% | -0.35% | 0.02% | 0.41% | -0.01% | 0.29% | -0.21% | |
| NZD | -0.28% | -0.64% | -0.27% | 0.09% | -0.32% | -0.29% | -0.50% | |
| CHF | 0.23% | -0.14% | 0.24% | 0.58% | 0.18% | 0.21% | 0.50% |
The heat map shows percentage changes of major currencies against each other. The base currency is picked from the left column, while the quote currency is picked from the top row. For example, if you pick the Euro from the left column and move along the horizontal line to the US Dollar, the percentage change displayed in the box will represent EUR (base)/USD (quote).
Silver prices soar late in the New York session, trading with gains of over 3% at around $31.16 after bouncing off daily lows of $30.24. A weak US Dollar and falling US Treasury yields augmented appetite for precious metals, which halted their slide after the US Presidential Election.
Silver’s uptrend remains intact despite trading below the 50-day Simple Moving Average (SMA) at $31.54. Although it has printed a lower low beneath the October 8 swing low of $30.13, sellers need the grey’s metal price to stay below the 50-day SMA. If that’s not achieved, the next resistance would be $32.00, followed by the October 4 peak at $32.95. On further strength, $33.00 would be up next.
On the other hand, XAG/USD is slumping below $30.13, and sellers are in charge. The next support would be $30.00, followed by the Intermediate support seen at $27.69, the September 6 low.
Oscillators such as the Relative Strength Index (RSI) remain bearishly biased, though in the short term, some upside is seen.
Silver is a precious metal highly traded among investors. It has been historically used as a store of value and a medium of exchange. Although less popular than Gold, traders may turn to Silver to diversify their investment portfolio, for its intrinsic value or as a potential hedge during high-inflation periods. Investors can buy physical Silver, in coins or in bars, or trade it through vehicles such as Exchange Traded Funds, which track its price on international markets.
Silver prices can move due to a wide range of factors. Geopolitical instability or fears of a deep recession can make Silver price escalate due to its safe-haven status, although to a lesser extent than Gold’s. As a yieldless asset, Silver tends to rise with lower interest rates. Its moves also depend on how the US Dollar (USD) behaves as the asset is priced in dollars (XAG/USD). A strong Dollar tends to keep the price of Silver at bay, whereas a weaker Dollar is likely to propel prices up. Other factors such as investment demand, mining supply – Silver is much more abundant than Gold – and recycling rates can also affect prices.
Silver is widely used in industry, particularly in sectors such as electronics or solar energy, as it has one of the highest electric conductivity of all metals – more than Copper and Gold. A surge in demand can increase prices, while a decline tends to lower them. Dynamics in the US, Chinese and Indian economies can also contribute to price swings: for the US and particularly China, their big industrial sectors use Silver in various processes; in India, consumers’ demand for the precious metal for jewellery also plays a key role in setting prices.
Silver prices tend to follow Gold’s moves. When Gold prices rise, Silver typically follows suit, as their status as safe-haven assets is similar. The Gold/Silver ratio, which shows the number of ounces of Silver needed to equal the value of one ounce of Gold, may help to determine the relative valuation between both metals. Some investors may consider a high ratio as an indicator that Silver is undervalued, or Gold is overvalued. On the contrary, a low ratio might suggest that Gold is undervalued relative to Silver.
Interest rates in America are to blame as to why the US dollar continues to strengthen as well as investment in US indices, because quite frankly, US indices continue to be the better performing ones in the world from a longer term perspective, dwarfing most others. So with that being said, I think you still have an argument for the US dollar, but whether or not we just fall from here, or if we get another bounce is the real question.
On a move to the upside, I’d be looking to fade any rally, especially if we get anywhere near the 200 day EMA, which is closer to the 1.2850 level. The Bank of England has been somewhat hesitant to cut rates, but they did recently. So it’ll be interesting to see what the trajectory there is. Federal Reserve comments coming out suggesting that perhaps the Americans might have to pause on any rate cuts. So, the game begins. We’ll have to wait and see how this plays out, but it certainly looks very negative at this point.
Ready to trade our GBP/USD daily analysis and predictions? Here are the best forex trading platforms UK to choose from.
After six consecutive days of losses, Gold prices manage to regain some balance and trim part of the recent intense pullback, reclaiming the $2,600 mark per troy ounce and above in quite a positive start to the new trading week.
The favourable backdrop in the precious metal also appears propped up by another negative day in the US Dollar (USD) as market participants keep re-assessing the recent Trump-infused strong rally, while the lack of a clear direction in US yields across different time frames also gives the yellow metal fresh legs.
However, the resurgence of the geopolitical factor, precisely from the Russia-Ukraine war, seems to be mostly behind the wake-up call in the metal, particularly after Biden’s administration “authorised” Ukraine to use US-made weapons to strike Russian territory.
Moving forward, it should be a week dominated by data releases surrounding the real economy worldwide, where the publication of preliminary PMIs is expected to take centre stage. In addition, opinions from central bank officials are also seen keeping investors entertained, especially after Fed’s Chair Jerome Powell suggested last week that the central bank is in no rush to cut its interest rates further given a resilient US economy.
On another front, non-commercial players (speculators) have reduced their net long positions in Gold to about 236.5K contracts, a level not seen since early June, according to the CFTC Positioning report for the week ending November 12. This retracement also came in tandem with the second straight drop in open interest, aligning with the recent decline.
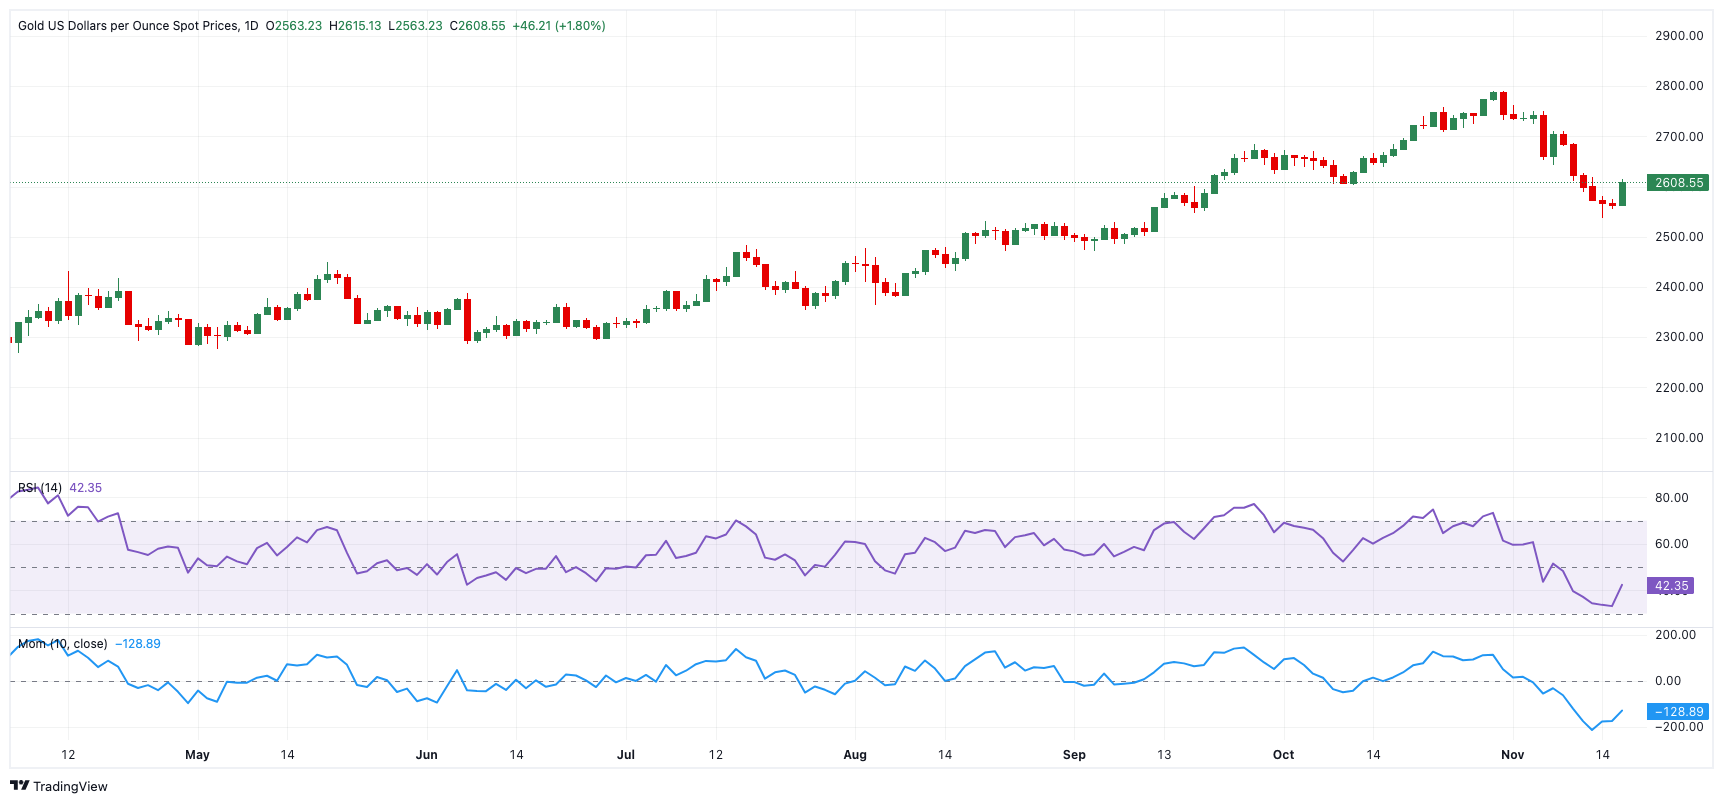
The daily chart for XAU/USD shows that it bounced from a bullish 100 Simple Moving Average (SMA) near $2,550, a region close to the November low ($2,536). However, the initial hurdle above $2,600 coincides with a Fibo retracement of the yearly rally and is expected to offer decent resistance.
In the near term, and according to the 4-hour chart, the ongoing upward correction seems poised to continue. The Relative Strength Index (RSI) rebounded but met resistance around the 55 level, while the Average Directional Index (ADX) around 32 is not supportive of a strong trend.
Initially, on the upside, emerges the 55-SMA at $2,630, which precedes the more significant 200-SMA and the provisional 100-SMA at $2,679 and $2,684, respectively. On the other hand comes $2,536.
The EUR/USD forecast remains neutral for the day as the economic calendar is light and trading activity is thin. The pair attempted to gain some ground from Friday’s lows but failed to sustain the gains at 1.0570. The broader dollar strength overshadows the recovery in risk assets.
–Are you interested in learning more about Canadian forex brokers? Check our detailed guide-
Geopolitics has again taken center stage with renewed heat from the Russia-Ukraine crisis. Hence, the risk-off sentiment favors the US dollar and keeps pressure on the Euro. Moreover, the fear of a trade war between the European Union and the US has also deteriorated Euro’s outlook.
After Trump’s victory, market analysts have revised their forecast for the US dollar in 2025, expecting a sharp growth in the currency. Fed’s dovish bets have also eased as the rate cut path could be slowed down. Fed Chair Jerome Powell said he cannot predict Trump’s policy guidance on the future rate cuts. He also said that the economic indicators have not sent signals to ramp up rates. The inflation is slowly moving towards a sustainable 2% target that could help us attain a neutral rate.
There is no significant event on the calendar today. However, the market participants may be looking for some fresh clues in today’s speech of ECB Chir Lagarde regarding monetary policy.
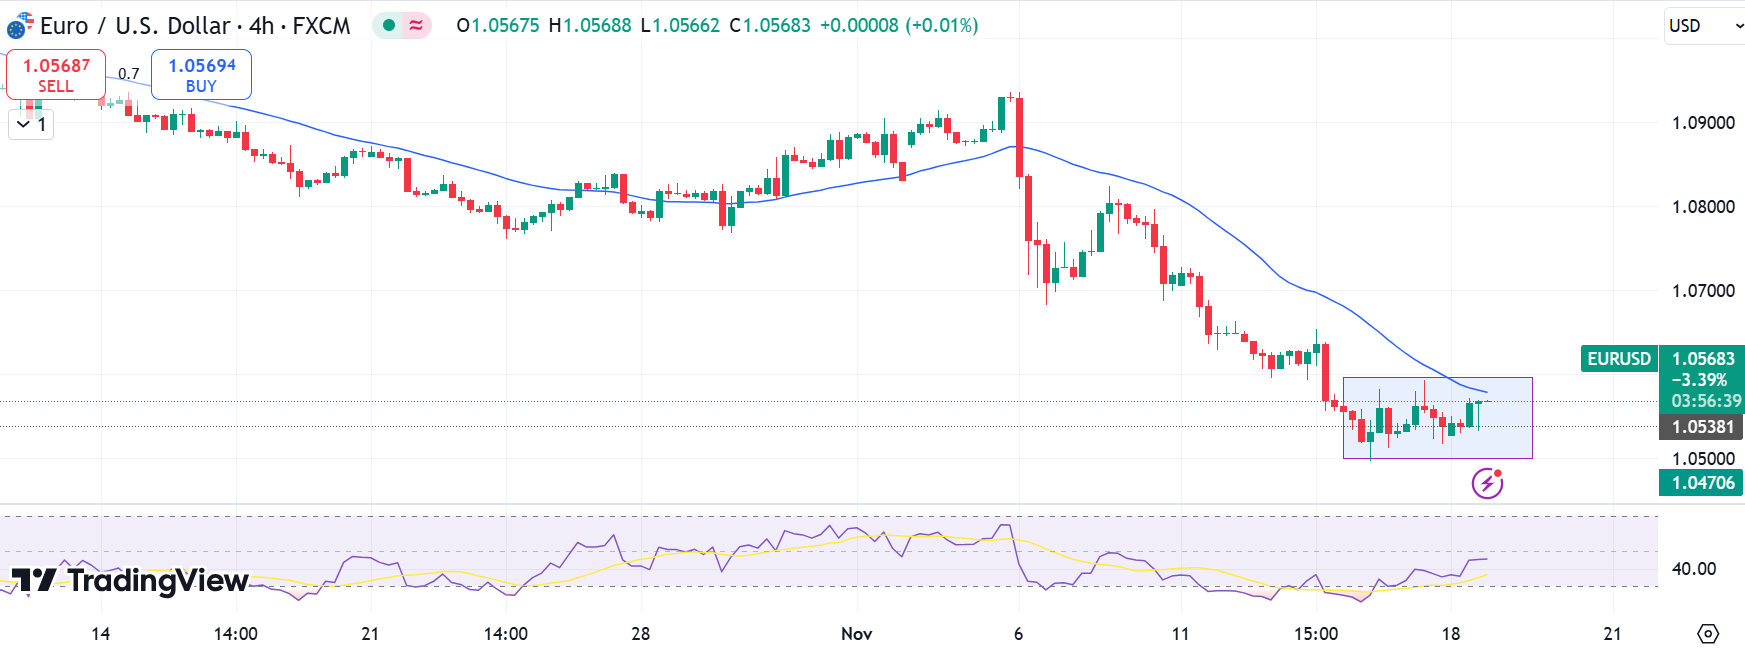
The EUR/USD forecast remains elusive as buyers attempt to stay above the 1.0500 mark but fail to sustain the gains beyond 1.0570. The 4-hour chart shows the price remains in a tight range starting from Nov 13th. The pair is perhaps looking for a fresh impetus to break out of the range on either side.
–Are you interested in learning more about high leveraged brokers? Check our detailed guide-
The 30-SMA lies above the price, showing a sustained bearish momentum, while the RSI has moved up to 40.0 level which indicates the pair is out of oversold condition and the downside momentum may continue.
Technically, the pair needs acceptance above 1.0600 to initiate a bullish momentum, while breaking the 1.0500 mark may bring strong selling towards the 1.0450 area.
Looking to trade forex now? Invest at eToro!
68% of retail investor accounts lose money when trading CFDs with this provider. You should consider whether you can afford to take the high risk of losing your money