The main category of Forex News.
You can use the search box below to find what you need.
[wd_asp id=1]
The main category of Forex News.
You can use the search box below to find what you need.
[wd_asp id=1]
EUR/GBP has suddenly reversed and shot higher on Thursday, gaining over 1.0% on the day so far. The explosive rally suggests a short squeeze is happening, and the short-term trend has reversed “on a dime”. The bulls are now back in control.
EUR/GBP will probably go higher. The next key resistance level lies at the cluster of Moving Averages in the 0.8450s. From there, a temporary pullback is likely, given the speed of the ascent. Any corrections will likely encounter support at around 0.8385, the July lows.
One warning of the sudden reversal came from the fact that the Relative Strength Index (RSI) was converging bullishly with price (red dashed lines on the chart). This signified a lack of downside momentum and increased chances of a pullback.
Another warning sign was that EUR/GBP has already reached the conservative target for the bear move that began at the August 5 high, at 0.8322. This raised the possibility that the whole move might have completely run its course, which appears to be the case given today’s price action.
Gold prices dropped as stronger U.S. economic data tempered expectations of a significant interest rate cut by the Federal Reserve in November. The market is now pricing in a 34% chance of a 50-basis-point cut, down from 49% last week, according to CME’s FedWatch tool. Richmond Federal Reserve President Thomas Barkin noted that inflation might remain above the 2% target for longer, limiting aggressive rate cuts.
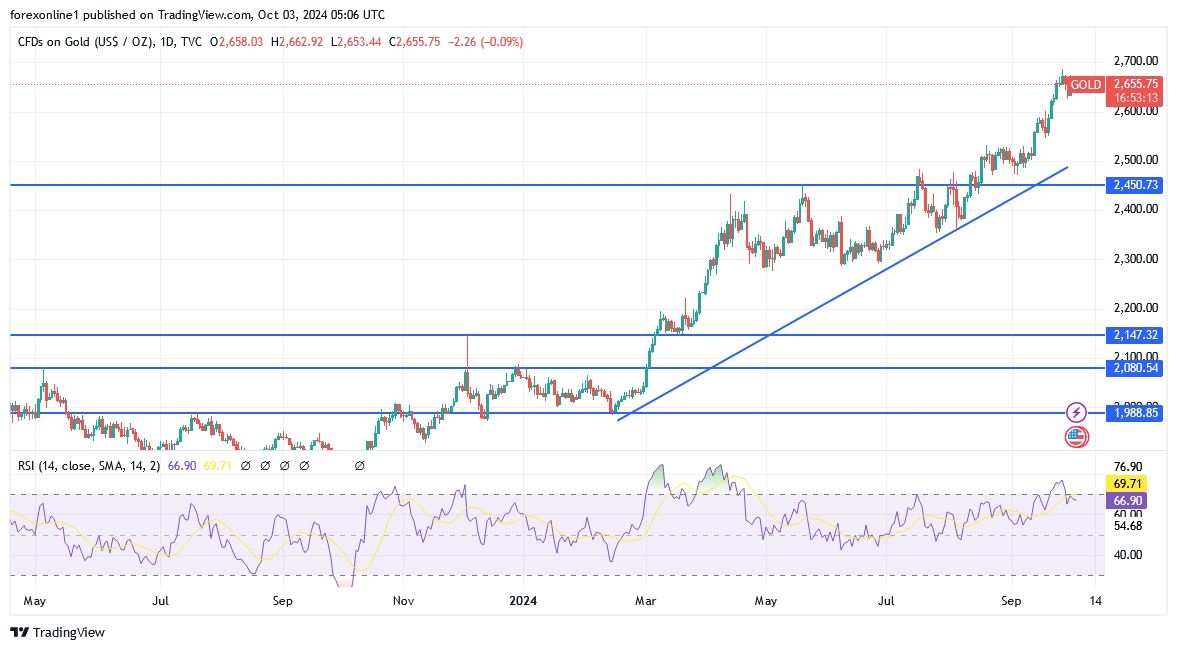
Despite the decline, gold remains near its record high of $2,685.64, supported by geopolitical tension in the Middle East. U.S.-Israel tensions intensified after Iran’s missile attack on Israel, adding safe-haven demand for gold. However, the possibility of a less aggressive rate cut continues to limit upside momentum.
Investors are awaiting the U.S. non-farm payrolls report, scheduled for Friday. A weaker-than-expected jobs print could drive gold prices higher, with potential to test the $2,700 mark.
U.S. Treasury yields rose on Thursday as investors shifted focus to labor market data, with the yield on the 10-year Treasury increasing by more than 2 basis points to 3.813%. The 2-year Treasury yield also rose to 3.674%. Private payrolls data from ADP revealed stronger-than-expected growth, with private employers adding 143,000 jobs in September, surpassing expectations of 128,000.
The labor market strength puts more pressure on the Federal Reserve’s interest rate decisions. Friday’s non-farm payrolls report will play a key role in shaping expectations for further monetary policy moves, particularly the potential for rate cuts.
The U.S. dollar strengthened across the board as geopolitical tensions and stronger economic data supported demand. Safe-haven buying increased following Iran’s missile attack on Israel, while better-than-expected U.S. private payrolls data pushed expectations for a robust non-farm payrolls report on Friday.
However, recent strong US jobs data has limited gold’s upward momentum by reducing the need for the Federal Reserve to adopt a more accommodative monetary policy. According to economic data, ADP data indicated that more US private sector jobs were created in September than expected, reinforcing the positive results from the JOLTS report and suggesting that the US Labor market is in better shape than previously thought at the beginning of the third quarter. Now, Financial markets see a 66% chance that the Federal Reserve will opt for a modest 25-basis point interest rate cut in November. Decisively, low interest rates reduce the opportunity cost of holding non-interest-bearing bullion assets.

According to licensed trading platforms, demand for the US dollar as a safe haven has increased after Iran launched a ballistic missile attack on Israel and the United States threatened severe consequences for the attack. Demand for gold, oil, and the dollar increased after news reports that the United States warned Israel late on Tuesday that Iran was preparing to launch a ballistic missile attack on Israel.
The intelligence information was accurate, as between 180 and 200 Iranian missiles were launched overnight, with Israel pledging to retaliate against Iran as a result. As a result, global stock markets declined amid growing investor anxiety. In the foreign exchange market, the pound sterling fell 0.66% against the dollar on Tuesday to 1.3284. The euro/dollar pair fell 0.6% to close at 1.1067.
The strength of the US dollar extended into the mid-week session; however, the selling had eased at the time of writing on Wednesday.
For the markets, there are two scenarios to consider:
Financial markets reverse losses and the US dollar gives up gains as tensions in the Middle East tend not to have a lasting impact on the market. In this regard, Jasper Faerestad, senior analyst at Danske Bank, says: “The Iranian missile attack on Israel has increased demand for safe-haven assets, boosting the US dollar and driving up oil and gold prices. This move has largely faded at the end of the session as the reported damage was apparently limited.”
This time is different as this is a major direct attack by Iran on a key US ally.
In the second scenario, the US dollar could extend its recent recovery.
According to today’s gold analysts’ forecasts. The gold index is still in a strong upward trend and its recent gains were enough to push all technical indicators towards strong overbought levels, but with the increase and continuation of global geopolitical tensions and the abandonment of tightening by global central banks, the factors for gold gains will remain. Strong and expected profit-taking will not occur without investors’ appetite for risk, calming of wars in the Middle East region and recovery of the US dollar price. Currently, the closest resistance levels for gold are $2670, $2685 and $2700 per ounce, and I do not recommend buying gold from record highs.
Ready to trade our Gold monthly forecast? Here’s a list of some of the best XAU/USD brokers to check out.
The newly appointed Minister of Economy expressed similar sentiments, calling on the Bank of Japan to be cautious about raising interest rates again. On the economic data front, the final reading showed that business activity in Japan remained expansionary for the eighth consecutive month in September amid strong demand. Also, the yen weakened against the US dollar as stronger-than-expected US private employment data supported the view that the Federal Reserve does not need to cut interest rates significantly.
On the stock trading platform front, Japanese stocks rise as the yen weakens. The Nikkei 225 index rose 2% to above 38,500 points, while the broader TOPIX index jumped 1.5% to 2,690 points on Thursday, as the yen fell to a one-month low, boosting shares of Japanese export-heavy companies.
According to reliable trading platforms, the yen weakened after new Prime Minister Shigeru Ishiba said it was too early to raise interest rates further following his meeting with Bank of Japan Governor Kazuo Ueda. Also, Benchmark indices recovered from sharp selling in the previous session, driven by escalating geopolitical tensions in the Middle East. Meanwhile, final data showed that business activity in Japan remained expansionary for the eighth consecutive month in September amid strong demand. As a result, technology stocks led the rally, with strong gains from Lasertec (4.5%), Disco Corp (5.5%), Tokyo Electron (3.1%), SoftBank Group (2.9%), and Advantest (3.8%). Other heavyweight stocks in the index also recorded gains, including Toyota Motor (2.2%), Fast Retailing (2.9%), and Nippon Yusen (4.6%).
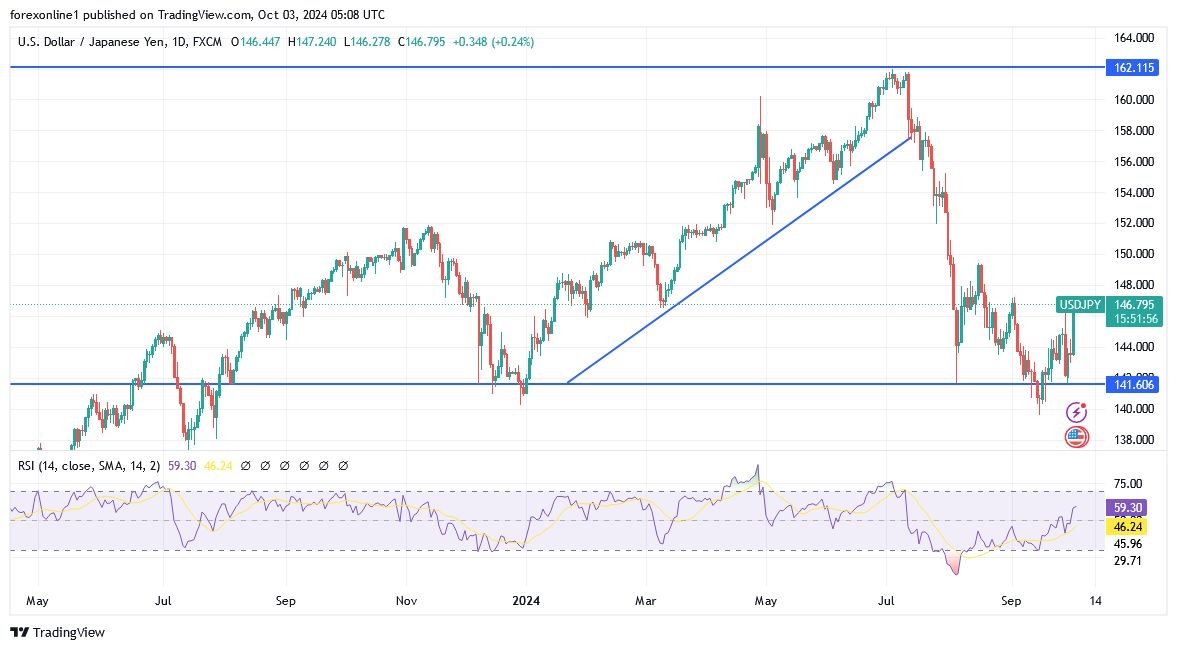
The recent move of the USD/JPY pair demonstrates the strength of our recommendations to buy the pair from any downward level when it dipped towards the psychological level of 140.00. We mentioned at the time that the yen’s gains might not last long, as the Bank of Japan’s shift towards tightening remains cautious. The recent gains, and potentially moving towards resistance at 148.80 and then the psychological resistance of 150.00, represent a significant shift in the overall trend to bullish, according to the daily chart performance. Furthermore, the USD/JPY pair will remain within its current range with an upward bias until reacting to the announcement of US jobs figures tomorrow, which will have a strong and significant impact on the future of market expectations regarding the fate of US interest rates.
Ready to trade our daily USD/JPY forex forecast? Here are the best forex brokers in Japan to choose from.
Europe’s coffee lovers are bracing themselves for higher prices as natural disasters hit the world’s top two coffee-producing countries.
Droughts in Brazil, the world’s largest coffee producer, and severe typhoons in Vietnam, the second-largest, have significantly disrupted global coffee supply chains, driving up production costs that are bubbling their way through to consumers.
As one of the world’s largest coffee-drinking regions, Europe’s coffee lovers will find price hikes particularly hard to swallow. Europeans consume approximately 3.2 million metric tons of coffee a year, accounting for almost 33% of the world’s total coffee consumption, according to German consumer data company Statista.
Brazil, responsible for around 40% of the world’s coffee production, has been grappling with one of its worst droughts in decades. The dry conditions have severely affected its arabica coffee-growing regions and reduced yields.
The 2023-2024 crop cycle has already seen a steep drop in production, some estimates suggest output could fall by as much as one-fifth (20%).
The impact is being felt most acutely in Minas Gerais, Brazil’s largest coffee-producing state and the home of the high quality arabica bean, which has experienced months of below-average rainfall.
While Brazil dominates the arabica market, Vietnam is the world’s leading producer of the cheaper robusta bean – used in instant coffee. Earlier this month, the country’s key coffee-growing regions in the Central Highlands were decimated by Typhoon Yagi, which killed at least 60 people and left hundreds injured.
Early assessments suggest thousands of hectares of coffee plantations were affected, with significant losses to both the current harvest and future production potential, as damaged trees will take years to recover.
The combined effects of Brazil’s drought and Vietnam’s typhoon have triggered a sharp increase in global coffee prices. The International Coffee Organization (ICO), the intergovernmental body made up of coffee exporting and importing countries, reported that prices surged by nearly 20% in the third quarter of 2024, reaching their highest levels in almost a decade.
Katharina Erfort, from international supply chain management company Inverto is gloomy about the prospect of a return to normal prices any time soon. Speaking to Euronews Business she said: “A quick recovery for the coffee sector is unlikely, even with potential improvements in supply.
“The ongoing effects of climate change make a swift return to stability difficult. The sector remains vulnerable to extreme weather patterns that can continue to disrupt future harvests. Additionally, rising global demand, particularly in emerging markets like Asia, may continue to put upward pressure on prices, further slowing recovery efforts.”
Arabica coffee futures, traded on the Intercontinental Exchange (ICE), have risen dramatically, with prices now hovering above $2.50 (€2.25) per pound – up from $1.80 (€1.62) earlier in the year. Robusta prices have followed a similar trajectory, climbing by around 25% to reach more than $2,000 (€1,796) per metric ton.
The sharp price increases have sent shockwaves through the global coffee market. Coffee traders are facing heightened volatility, with concerns growing that continued weather-related disruptions and the cost of rebuilding after the natural disasters could push prices even higher.
Agri-commodities analyst at Rabobank, Carlos Mera told Bloomberg that this crisis is compounded by logistical challenges, such as port congestion and a global shortage of shipping containers, which are hampering the movement of coffee worldwide.
The effects of rising costs are particularly pronounced in Europe. In Germany, Europe’s largest coffee market, retail prices for ground coffee and coffee beans have risen by an average of 10% since 2022, according to Statista.
A survey by the Brussels based European Coffee Federation (ECF) found that nearly 65% of cafes in Europe have raised their prices by between 5% and 15% since the start of 2023. Researchers noted that increases were likely to be driven by a range of factors beyond the cost of coffee beans, as inflation had driven up the price of other essentials such as milk, sugar, and disposable cups.
 ADVERTISEMENT
As the world’s big two coffee producers struggle to recover from their respective crises, the outlook for the global coffee market remains uncertain.
Climate change is reducing the availability of land on which coffee crops can thrive, and extreme weather events are increasing, creating a perfect storm of challenges for the sector and Europe’s coffee lovers.
Following Tuesday’s sharp decline, EUR/USD continued to stretch lower and closed in negative territory on Wednesday. The pair extended its slide in the Asian session on Thursday and touched its lowest level in three weeks below 1.1030 before staging a modest rebound toward 1.1050 in the European morning.
The table below shows the percentage change of Euro (EUR) against listed major currencies this week. Euro was the weakest against the US Dollar.
| USD | EUR | GBP | JPY | CAD | AUD | NZD | CHF | |
|---|---|---|---|---|---|---|---|---|
| USD | 1.15% | 2.04% | 3.08% | 0.10% | 0.74% | 1.79% | 1.16% | |
| EUR | -1.15% | 0.88% | 1.93% | -1.02% | -0.36% | 0.66% | 0.09% | |
| GBP | -2.04% | -0.88% | 1.15% | -1.88% | -1.22% | -0.22% | -0.78% | |
| JPY | -3.08% | -1.93% | -1.15% | -2.85% | -2.33% | -1.24% | -1.82% | |
| CAD | -0.10% | 1.02% | 1.88% | 2.85% | 0.69% | 1.69% | 1.12% | |
| AUD | -0.74% | 0.36% | 1.22% | 2.33% | -0.69% | 1.01% | 0.43% | |
| NZD | -1.79% | -0.66% | 0.22% | 1.24% | -1.69% | -1.01% | -0.59% | |
| CHF | -1.16% | -0.09% | 0.78% | 1.82% | -1.12% | -0.43% | 0.59% |
The heat map shows percentage changes of major currencies against each other. The base currency is picked from the left column, while the quote currency is picked from the top row. For example, if you pick the Euro from the left column and move along the horizontal line to the US Dollar, the percentage change displayed in the box will represent EUR (base)/USD (quote).
The risk-averse market atmosphere and the upbeat private sector employment data from the US helped the US Dollar (USD) hold its ground midweek and didn’t allow EUR/USD to gain traction.
Meanwhile, cautious comments from European Central Bank (ECB) officials put additional weight on the Euro’s shoulders. ECB Vice President Luis de Guindos said that risks to Eurozone growth remains tilted to the downside and ECB board member Isabel Schnabel noted that they cannot ignore headwinds to growth, adding that a return to the ECB’s 2% inflation target in a timely manner is becoming more likely.
In the early American session, the weekly Initial Jobless data will be featured in the US economic calendar. Markets expect the number of first-time applications for unemployment benefits to come in at 220,000 in the week ending September 28. Ahead of Friday’s critical Nonfarm Payrolls data, a reading close to 200,000 in the weekly Initial Jobless Claims could help the USD gather strength with the immediate reaction.
Later in the day, investors will scrutinize the ISM Services PMI data for September. An unexpected drop below 50 could revive concerns over an economic downturn in the US and make it difficult for the USD to outperform its rivals.
Market participants will also keep a close eye on the risk perception. US stock index futures trade in negative territory in the European session. EUR/USD could stay under bearish pressure if risk-off flows dominate the action in the second half of the day.
EUR/USD was last seen trading near 1.1040, where the Fibonacci 38.2% retracement of the latest uptrend is located. In case the pair fails to stabilize above this level, technical sellers could remain interested. On the downside, 1.1000 (Fibonacci 50% retracement) could be seen as next support before 1.0940 (Fibonacci 61.8% retracement).
If EUR/USD manages to reclaim 1.1040, next strong resistance could be seen at 1.1100, where the 100-period and the 200-period Simple Moving Averages (SMA) meet the Fibonacci 23.6% retracement, ahead of 1.1150 (static level).
The Euro is the currency for the 19 European Union countries that belong to the Eurozone. It is the second most heavily traded currency in the world behind the US Dollar. In 2022, it accounted for 31% of all foreign exchange transactions, with an average daily turnover of over $2.2 trillion a day. EUR/USD is the most heavily traded currency pair in the world, accounting for an estimated 30% off all transactions, followed by EUR/JPY (4%), EUR/GBP (3%) and EUR/AUD (2%).
The European Central Bank (ECB) in Frankfurt, Germany, is the reserve bank for the Eurozone. The ECB sets interest rates and manages monetary policy. The ECB’s primary mandate is to maintain price stability, which means either controlling inflation or stimulating growth. Its primary tool is the raising or lowering of interest rates. Relatively high interest rates – or the expectation of higher rates – will usually benefit the Euro and vice versa. The ECB Governing Council makes monetary policy decisions at meetings held eight times a year. Decisions are made by heads of the Eurozone national banks and six permanent members, including the President of the ECB, Christine Lagarde.
Eurozone inflation data, measured by the Harmonized Index of Consumer Prices (HICP), is an important econometric for the Euro. If inflation rises more than expected, especially if above the ECB’s 2% target, it obliges the ECB to raise interest rates to bring it back under control. Relatively high interest rates compared to its counterparts will usually benefit the Euro, as it makes the region more attractive as a place for global investors to park their money.
Data releases gauge the health of the economy and can impact on the Euro. Indicators such as GDP, Manufacturing and Services PMIs, employment, and consumer sentiment surveys can all influence the direction of the single currency. A strong economy is good for the Euro. Not only does it attract more foreign investment but it may encourage the ECB to put up interest rates, which will directly strengthen the Euro. Otherwise, if economic data is weak, the Euro is likely to fall. Economic data for the four largest economies in the euro area (Germany, France, Italy and Spain) are especially significant, as they account for 75% of the Eurozone’s economy.
Another significant data release for the Euro is the Trade Balance. This indicator measures the difference between what a country earns from its exports and what it spends on imports over a given period. If a country produces highly sought after exports then its currency will gain in value purely from the extra demand created from foreign buyers seeking to purchase these goods. Therefore, a positive net Trade Balance strengthens a currency and vice versa for a negative balance.
GBP/USD extends its losing streak for the third consecutive day, trading around 1.3200 during the Asian session on Thursday. The risk-sensitive GBP/USD pair receives downward pressure due to the safe-haven flows amid escalating Middle-East tensions.
The Israeli Broadcasting Authority (IBA) reported that Israel’s security cabinet has decided to issue a strong response to the recent Iranian attack. On Tuesday night, Iran launched over 200 ballistic missiles and drone strikes on Israel. Read more…
The GBP/USD pair extends its downside to around 1.3265 during the early Asian session on Thursday. The renewed demand for the US dollar (USD) amid the rising geopolitical tensions in the Middle East provides some support to the major pair. The US September ISM Services Purchasing Managers Index (PMI), the weekly Initial Jobless Claims, and the final S&P Global Services PMI will be in the spotlight on Thursday.
Iran fired more than 180 missiles at Israel on Tuesday, its biggest-ever direct attack on the country. Israel and the United States vowed retribution for the attack. A sign that conflict in the region is intensifying and the fear of wider war boosts the safe-haven flows, benefiting the Greenback against the Pound Sterling (GBP). Read more…
Gold price is trading listlessly in a narrow range under the key $2,670 static resistance, lacking a clear directional impetus so far this Thursday. The focus now shifts toward a fresh batch of US economic statistics and speeches from Federal Reserve (Fed) policymakers for fresh directives amid the escalating geopolitical conflict between Israel and Iran.
Several media outlets reported that Israel delivered a harsh response to the recent Iranian attack by bombing central Beirut in the early hours of Thursday. Lebanese security officials said that three missiles also struck the southern suburb of Dahiyeh, the place of Hezbollah leader Hassan Nasrallah’s killing. Lebanese health officials also reported that multiple people were injured following Israel’s strike in Beirut.
Iranian forces on Tuesday used hypersonic Fattah missiles for the first time and 90% of its missiles successfully hit their targets in Israel. Tehran said this attack was in response to Israeli killings of militant leaders and aggression in Lebanon against the Iran-backed armed movement Hezbollah and in Gaza.
Despite the increasing risks of the Israel-Iran conflict turning into a wider regional war in the Middle East, Gold price is struggling to capitalize on the risk-off flows, as diminishing odds of a 50 basis points (bps) interest rate cut by the Fed in November keep the sentiment around the US Dollar underpinned at the expense of the non-interest-bearing Gold price.
Data on Wednesday showed that US ADP private sector employment increased by 143,000 jobs for September, accelerating from the upwardly revised 103,000 in August and better than the 120,000 estimate. Strong ADP jobs report eased concerns about the health of the US labor market, supporting the expectations for Friday’s Nonfarm Payrolls data.
Markets are currently pricing in about a 34% chance that the Fed will opt for a big rate cut at its next meeting, compared with almost 60% last week, CME Group’s FedWatch Tool shows.
Next of note for Gold traders remain the US ISM Services PMI and the weekly Jobless Claims data for fresh signals on the state of the economy and the Fed’s next interest rate move. Also, Fedspeak will be closely scrutinized and will likely have a significant impact on the US Dollar valuation, eventually influencing the Gold price action.
The daily technical setup for Gold price remains constructive so long as the 14-day Relative Strength Index (RSI) remains in the bullish territory. The leading indicator is currently trading near 66.50.
Gold price needs to yield a daily candlestick closing above the static resistance near $2,670 for a renewed upside. The next resistance is aligned at the record high of $2,686.
Furrther up, buyers will target the $2,700 round level, followed by the rising trendline resistance at $2,740.
Alternatively, if Gold sellers flex their muscles, acceptance below the September 24 low of $2,623 is critical to unleashing further downside toward the $2,600 threshold.
Gold sellers could then challenge the September 20 low of $2,585, where the 21-day Simple Moving Average (SMA) hangs around.
The Institute for Supply Management (ISM) Services Purchasing Managers Index (PMI), released on a monthly basis, is a leading indicator gauging business activity in the US services sector, which makes up most of the economy. The indicator is obtained from a survey of supply executives across the US based on information they have collected within their respective organizations. Survey responses reflect the change, if any, in the current month compared to the previous month. A reading above 50 indicates that the services economy is generally expanding, a bullish sign for the US Dollar (USD). A reading below 50 signals that services sector activity is generally declining, which is seen as bearish for USD.
Important DisclaimersThe content provided on the website includes general news and publications, our personal analysis and opinions, and contents provided by third parties, which are intended for educational and research purposes only. It does not constitute, and should not be read as, any recommendation or advice to take any action whatsoever, including to make any investment or buy any product. When making any financial decision, you should perform your own due diligence checks, apply your own discretion and consult your competent advisors. The content of the website is not personally directed to you, and we does not take into account your financial situation or needs.The information contained in this website is not necessarily provided in real-time nor is it necessarily accurate. Prices provided herein may be provided by market makers and not by exchanges.Any trading or other financial decision you make shall be at your full responsibility, and you must not rely on any information provided through the website. FX Empire does not provide any warranty regarding any of the information contained in the website, and shall bear no responsibility for any trading losses you might incur as a result of using any information contained in the website.The website may include advertisements and other promotional contents, and FX Empire may receive compensation from third parties in connection with the content. FX Empire does not endorse any third party or recommends using any third party’s services, and does not assume responsibility for your use of any such third party’s website or services.FX Empire and its employees, officers, subsidiaries and associates, are not liable nor shall they be held liable for any loss or damage resulting from your use of the website or reliance on the information provided on this website.Risk DisclaimersThis website includes information about cryptocurrencies, contracts for difference (CFDs) and other financial instruments, and about brokers, exchanges and other entities trading in such instruments. Both cryptocurrencies and CFDs are complex instruments and come with a high risk of losing money. You should carefully consider whether you understand how these instruments work and whether you can afford to take the high risk of losing your money.FX Empire encourages you to perform your own research before making any investment decision, and to avoid investing in any financial instrument which you do not fully understand how it works and what are the risks involved.
Silver price recovered some ground on Wednesday, advanced some 0.39%, and reclaimed the $31.50 figure as buyers stepped in and pushed the grey’s metal price above its opening price. Higher US Treasury bond yields capped its advance, yet XAG/USD trades at $31.82 as Thursday’s Asian session begins.
Silver price has printed back-to-back bullish days, yet it failed to surpass the $32.00 figure, exposing the grey metal to selling pressure. The Relative Strength Index (RSI) hints that buyers remain in control, but it has turned flat, indicating that consolidation lies ahead.
If XAG/USD clears the October 2 peak of $32.30, it will resume its uptrend and challenge the year-to-date (YTD) high of $32.71. A breach of the latter will push Silver to $33.00 before testing on October 1, 2012, high at $35.40.
On the other hand, if XAG/USD dives beneath the October 2 daily low of $31.00, this would sponsor a leg-down to the psychological $30.50 figure, followed by the 100-day moving average (DMA) at $29.74, ahead of the 50-DMA at $29.32.
Silver is a precious metal highly traded among investors. It has been historically used as a store of value and a medium of exchange. Although less popular than Gold, traders may turn to Silver to diversify their investment portfolio, for its intrinsic value or as a potential hedge during high-inflation periods. Investors can buy physical Silver, in coins or in bars, or trade it through vehicles such as Exchange Traded Funds, which track its price on international markets.
Silver prices can move due to a wide range of factors. Geopolitical instability or fears of a deep recession can make Silver price escalate due to its safe-haven status, although to a lesser extent than Gold’s. As a yieldless asset, Silver tends to rise with lower interest rates. Its moves also depend on how the US Dollar (USD) behaves as the asset is priced in dollars (XAG/USD). A strong Dollar tends to keep the price of Silver at bay, whereas a weaker Dollar is likely to propel prices up. Other factors such as investment demand, mining supply – Silver is much more abundant than Gold – and recycling rates can also affect prices.
Silver is widely used in industry, particularly in sectors such as electronics or solar energy, as it has one of the highest electric conductivity of all metals – more than Copper and Gold. A surge in demand can increase prices, while a decline tends to lower them. Dynamics in the US, Chinese and Indian economies can also contribute to price swings: for the US and particularly China, their big industrial sectors use Silver in various processes; in India, consumers’ demand for the precious metal for jewellery also plays a key role in setting prices.
Silver prices tend to follow Gold’s moves. When Gold prices rise, Silver typically follows suit, as their status as safe-haven assets is similar. The Gold/Silver ratio, which shows the number of ounces of Silver needed to equal the value of one ounce of Gold, may help to determine the relative valuation between both metals. Some investors may consider a high ratio as an indicator that Silver is undervalued, or Gold is overvalued. On the contrary, a low ratio might suggest that Gold is undervalued relative to Silver.