The main category of Forex News.
You can use the search box below to find what you need.
[wd_asp id=1]
The main category of Forex News.
You can use the search box below to find what you need.
[wd_asp id=1]
USD/JPY trends will hinge on the inflation and jobless claims data from the US, coupled with BoJ forward guidance. A combination of hawkish BoJ comments and weaker US data could push the pair below 140.
Investors should remain alert with inflation, the US labor market, and central bank chatter likely to influence the BoJ and the Fed’s rate paths. Monitor real-time data, central bank insights, and expert commentary to adjust your trading strategies accordingly. Stay updated with our latest news and analysis to manage USD/JPY volatility.
The USD/JPY sat well below the 50-day and 200-day EMAs, affirming bearish price signals.
A USD/JPY return to 143.0 could give the bulls a run at the 143.495 resistance level. Furthermore, a breakout from the 143.495 resistance level may indicate a move toward the 145.891 resistance level.
Producer prices from Japan and the US, and US labor market data require consideration.
Conversely, a drop below the 141.032 support level the September 11 low of 140.706 could indicate a fall through 140.
The 14-day RSI at 35.10 indicates a USD/JPY drop below the 141.032 support level before entering oversold territory.
The EUR/USD pair extended its weekly decline to 1.1001 on Wednesday, bouncing just modestly ahead of the close. The pair is heading into the Asian opening trading around the 1.1020 level, with an overall bearish stance.
Financial markets turned risk-averse following the release of the United States (US) Consumer Price Index (CPI), as the figures weighed down the odds for a Federal Reserve (Fed) 50 basis points (bps) interest rate cut when it meets next week. The US Bureau of Labor Statistics reported that the CPI rose by 2.5% on a yearly basis in August, easing from 2.9% in July, while the core annual figure printed at 3.2%, unchanged from the previous month. Additionally, the core monthly index increased by 0.3%, worse than the 0.2% advance anticipated.
Speculative interest hoped for further easing in price pressures and a more aggressive Fed. As a result, stock markets plunged, with Wall Street posting sharp losses after the opening. Nevertheless, the three major indexes recovered ahead of the close and trimmed most of their early losses. The US Dollar, however, retained a good bunch of its gains across the FX board.
Investors will now focus on the European Central Bank (ECB). The ECB will announce its decision on monetary policy early on Thursday, and is widely anticipated to cut the three main interest rates by 25 bps each. Policymakers will act not only because of easing price pressures but also because of mounting concerns about a potential recession in the Eurozone. Of course, officials will not put that in words, but they will repeat that they will remain vigilant and data-dependent.
The daily chart for the EUR/USD pair shows that the risk remains skewed to the downside. The pair further extended its slump below a now flat 20 Simple Moving Average (SMA) while the 100 SMA is losing steam a few pips above a flat 200 SMA, both far below the current level. Technical indicators, in the meantime, have pared their slides but remain well into negative levels, far from suggesting downward exhaustion.
Technical readings in the 4-hour chart support another leg south. The 20 SMA gains downward traction below a flat 100 SMA, while EUR/USD bounced modestly after testing the 200 SMA. Finally, technical indicators have bounced from near oversold readings but remain below their midlines and lack directional strength. A break through the 1.1000 level will likely force buyers to give up and encourage sellers, with the pair then aiming to retest the 1.0900 threshold.
Support levels: 1.0990 1.0950 1.0910
Resistance levels: 1.1050 1.1090 1.1140
On the other hand, the country’s unemployment rate fell to 4.1% and the UK economy added 265,000 jobs, well above expectations of 265,000. Furthermore, the Bank of England cut interest rates in August but has taken a cautious approach to further rate cuts. Investors are expecting a fall in borrowing costs in November, with a further cut possible in December.
Prior to that, the pound sterling rose against the euro and the dollar on the back of strong job gains. According to reliable trading platforms, the pound sterling has risen against the US dollar and the euro and other G10 currencies following the release of UK jobs and wages data, which showed no significant deterioration in the Labor market. According to trades, the pound sterling rose to 1.1847 against the euro in the minutes following the National Statistics Office’s announcement that the UK added 265,000 jobs in the three months to July, beating estimates by 123,000 jobs, which is the largest increase since May 2022. Also, the unemployment rate fell to 4.1% from 4.2%. Wage data was in line with expectations at 5.1%, but when bonuses were included in the measure, the reading of 4.0% was slightly below estimates of 4.1%.
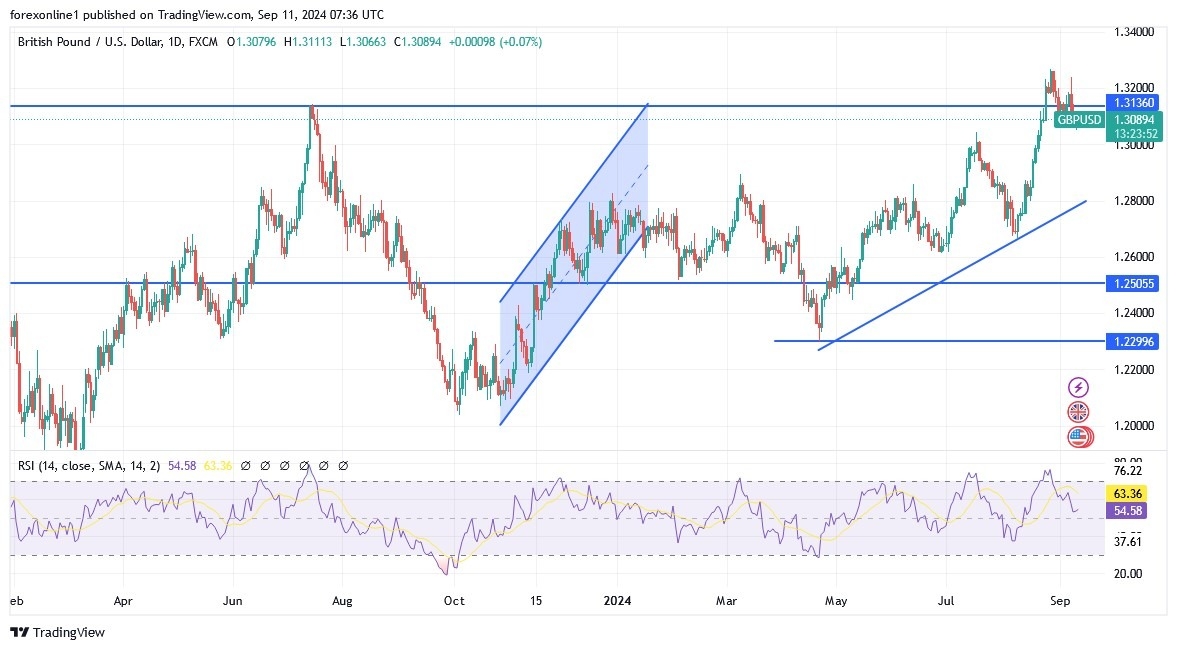
According to forex trades, the GBP/USD rose to 1.3082 but remains under pressure in the end due to the broader rise in the US dollar that began in September. Clearly, the jobs and wages report confirm the strength of the UK economy and confirms market expectations that the Bank of England will leave interest rates unchanged next week. In this regard, Kenneth Brooks, an analyst at Société Générale, said: “Is the Labor market slackening? Employment has now risen over the past three months, with the three-month moving average rising from -157,000 jobs in April to +127,000 jobs in July, a shift in trend that would give the Bank of England hawks ammunition to oppose faster rate cuts.”
Overall, economists expect the next rate cut to come in either October or November: “The bigger picture is that the bank will move slowly due to high wage levels that will help push inflation higher in the coming months.”
Meanwhile, the data indicates stubbornly high underlying inflationary pressures, and steady wage growth – which poses upside risks to inflation in the medium term – is likely to keep rate cuts at a more gradual pace than the European Central Bank and the Federal Reserve, even into next year. As a result, “We expect sterling to outperform the dollar and the euro on our forecast horizon.”
Michael Brown, chief analyst at Pepperstone, says a September rate cut is still out of the question after these days. He explains that quarterly 25 basis point cuts remain his base case, with these cuts likely to coincide with the bank’s updated economic forecasts, thus leaving the November meeting on the table for the next, and likely last, cut this year. Such expectations, of course, are somewhat tighter than those expected by the European Central Bank and the FOMC, where a 50-basis point rate cut in September remains a possibility. Consequently, this divergence could help support sterling in the medium term, against both the euro and the US dollar.
In general, market prices show that investors expect less than two rate cuts before the end of the year, which is confirmed by the nature of the coming days. This puts UK bond yields and the GBP at a relative advantage compared to the USD and the EUR, barring a correction in risk assets and another volatility shock.

Based on the performance on the daily chart attached, the GBP/USD price is still trending downwards and the bears’ control over the trend will strengthen if the currency pair moves towards the support levels of 1.3000, 1.2940 and 1.2880 respectively. At the latter level, the technical indicators will move towards strong oversold levels. In contrast, and over the same period, the bulls’ control over the trend will return if the currency pair stabilizes above the resistance of 1.3200 again. Decisively, today’s US inflation figures will be the last to determine the path of the currency pair in the coming days.
Ready to trade our GBP/USD Forex forecast? Here’s some of the best forex broker UK reviews to check out.
Gold price peaked at $2,528.95, flirting with its record high mid-European session. XAU/USD, however, changed course and fell towards the $2,500 level after the release of United States (US) macroeconomic data. The August Consumer Price Index (CPI) rose by 2.5% YoY in August, easing from the 2.9% posted in July and below the 2.6% anticipated by market participants. The annual core reading matched expectations by printing at 3.2%, although the monthly core reading rose by 0.3%, slightly higher than the previous and expected 0.2%.
The news heavily weighed on rate cut expectations, with the US Federal Reserve (Fed) now expected to proceed gradually. Market players expect the central bank to trim the main rate benchmark by 25 basis points (bps) when it meets next week. As the dust settled, concerns receded. US indexes keep trading in the red, but trimmed half of their post-release losses, helping XAU/USD reconquer the $2,510 mark.
The next first-tier event will take place on Thursday, as the European Central Bank (ECB) will announce its decision on monetary policy. Officials are widely anticipated to trim the three main interest rates by 25 bps each. If anything, a change in President Christine Lagarde’s usual wording can trigger action across financial markets.
From a technical point of view, the daily chart for the XAU/USD pair shows it remains on the bullish side despite the absence of upward momentum. The pair keeps trading above a bullish 20 Simple Moving Average, finding buyers around it. At the same time, the 100 and 200 SMAs maintain their bullish slopes far below the current level. Finally, technical indicators hold within positive levels, lacking evident directional strength yet maintaining the risk skewed to the upside.
In the near term, and according to the 4-hour chart, XAU/USD offers a neutral-to-bullish stance. The pair develops above converging 20 and 100 SMAs, at around $2,507.00, while technical indicators bounced from around their midlines, maintaining their upward slopes within positive levels.
Support levels: 2,507.60 2,489.60 2,475.70
Resistance levels: 2,519.75 2,531.60 2,545.00
In contrast, the US Federal Reserve is widely expected to start cutting interest rates this month, with Fed policymakers warning of rising risks to the Labor market. On the economic data front, a private survey showed that manufacturing sentiment in Japan fell to a seven-month low in September amid concerns about weak Chinese demand.
On the stock market platforms front, Japanese stocks declined due to the hawkish statements from the Bank of Japan. The Nikkei 225 index fell 1.49% to close at 35,620 points. Meanwhile, the broader TOPIX index fell 1.78% to close at 2,531 points on Wednesday, continuing the losses incurred in the previous session after hawkish remarks from a Bank of Japan policymaker. Furthermore, Bank of Japan board member Junko Nakagawa said that the central bank will continue to raise interest rates if the economy and inflation move in line with its expectations. As a result, the Japanese yen rose to near its highest levels since the beginning of the year following her comments, putting further downward pressure on domestic equities.
Elsewhere, the yield on the 10-year Japanese government bond fell to around 0.85% even after Bank of Japan board member Junko Nakagawa said the central bank would continue to raise interest rates if inflation moves in line with its expectations. Also, she added that the tight Labor market and continued increases in import prices pose upside risks to inflation. Moreover, she noted that real interest rates remain deeply negative despite the July rate hike.
Overall, markets are betting that the Bank of Japan will raise interest rates again before the end of the year in an attempt to steadily raise borrowing costs. On the data front, a private survey showed that manufacturing sentiment in Japan fell to a seven-month low in September amid concerns about weak Chinese demand.
Today, the annual inflation rate in the United States is likely to slow for the fifth straight month to 2.6% in August 2024, the lowest level since March 2021, from 2.9% in July. Compared to the previous month, the consumer price index is expected to rise 0.2%, the same as in July. Also, gasoline prices are expected to decline, while rents and auto insurance may show signs of slowing. Meanwhile, core US inflation is expected to remain steady at its lowest level in more than three years at 3.2%. The monthly core inflation rate is also expected to remain at 0.2%.
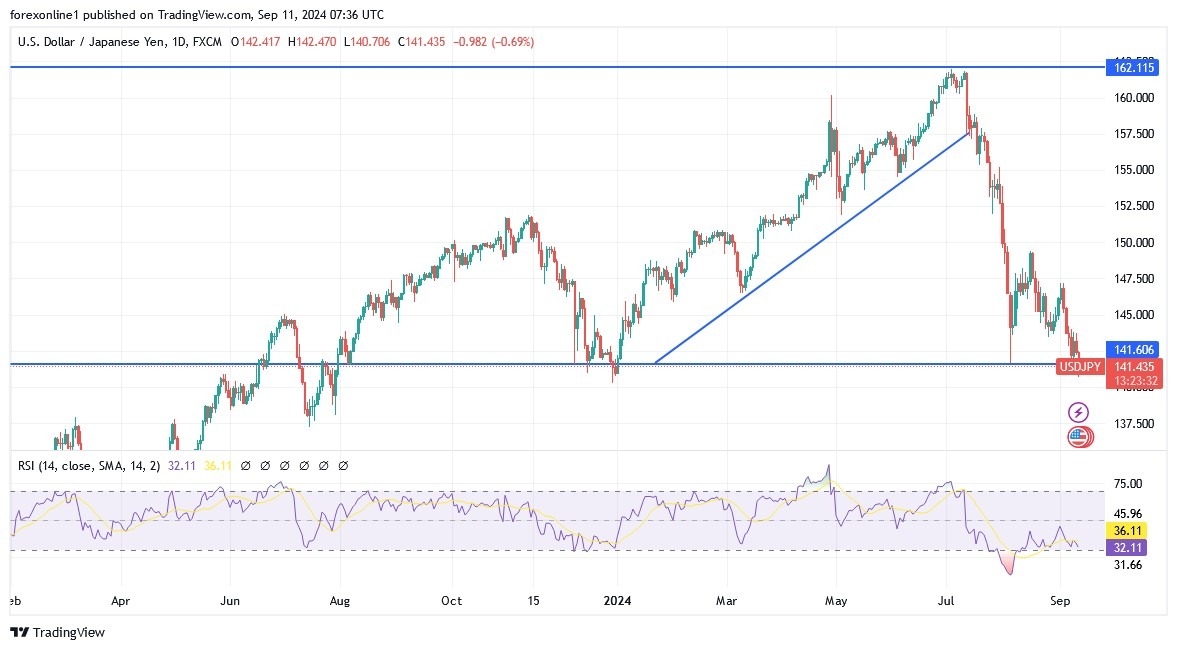
According to the performance on the daily chart attached, the USD/JPY is on a strong downward path. Also, we had indicated in the recent technical analysis of the currency pair that the bears are now closer to moving to break the most important support for that period of time, the 141.75 level, and indeed it is now below it. The psychological support of 140.00 may be the next stop, which in turn will move all technical indicators towards strong oversold levels. Technically, the current downward performance may remain until the markets and investors react to the upcoming announcements of both the US Federal Reserve and the Bank of Japan.
Ready to trade our daily forex forecast? Here are the best forex brokers in Japan to choose from.
The EUR/USD pair heads into the United States (US) opening trading near a fresh four-week low of 1.1002, as the US Dollar surged following the release of Consumer Price Index (CPI) figures. The US CPI rose by 2.5% on a yearly basis in August, easing from 2.9% in July, while the core annual figure printed at 3.2%, unchanged from the previous month, according to the US Bureau of Labor Statistics (BLS).
Moreover, the core monthly index increased by 0.3%, higher than the 0.2% advance anticipated. The figures diluted hopes for an upcoming 50 basis points (bps) interest rate cut from the Federal Reserve (Fed) next week and spurred risk aversion. As a result, the USD is up against most major rivals.
Falling stocks add to the picture ahead of the European Central Bank (ECB) monetary policy decision. The ECB is widely anticipated to announce a second 25 bps rate cut on Thursday, with the focus then on any forward guidance.
The EUR/USD pair is down for a fourth consecutive day, and the negative momentum will likely continue. In the daily chart, the 20 Simple Moving Average (SMA) has turned flat at around 1.1090, reinforcing a static resistance area. The longer moving averages remain over 150 pips below the current level, with only the 100 SMA showing modest upward strength. Finally, technical indicators lack directional strength but remain below their midlines, in line with another leg south.
In the near term, and according to the 4-hour chart, the risk skews to the downside. The pair met sellers around a bearish 20 SMA, which continues to accelerate south below a now flat 100 SMA. At the same time, EUR/USD is pressuring a mildly bullish 200 SMA for the first time in over a month. Finally, technical indicators head firmly south within negative levels, reflecting sellers’ strength.
Support levels: 1.0990 1.0950 1.0910
Resistance levels: 1.1050 1.1090 1.1140
(This story was corrected on September 11 at 13:25 GMT to clarify that US core inflation was higher than anticipated month-over-month, and not the headline reading.)
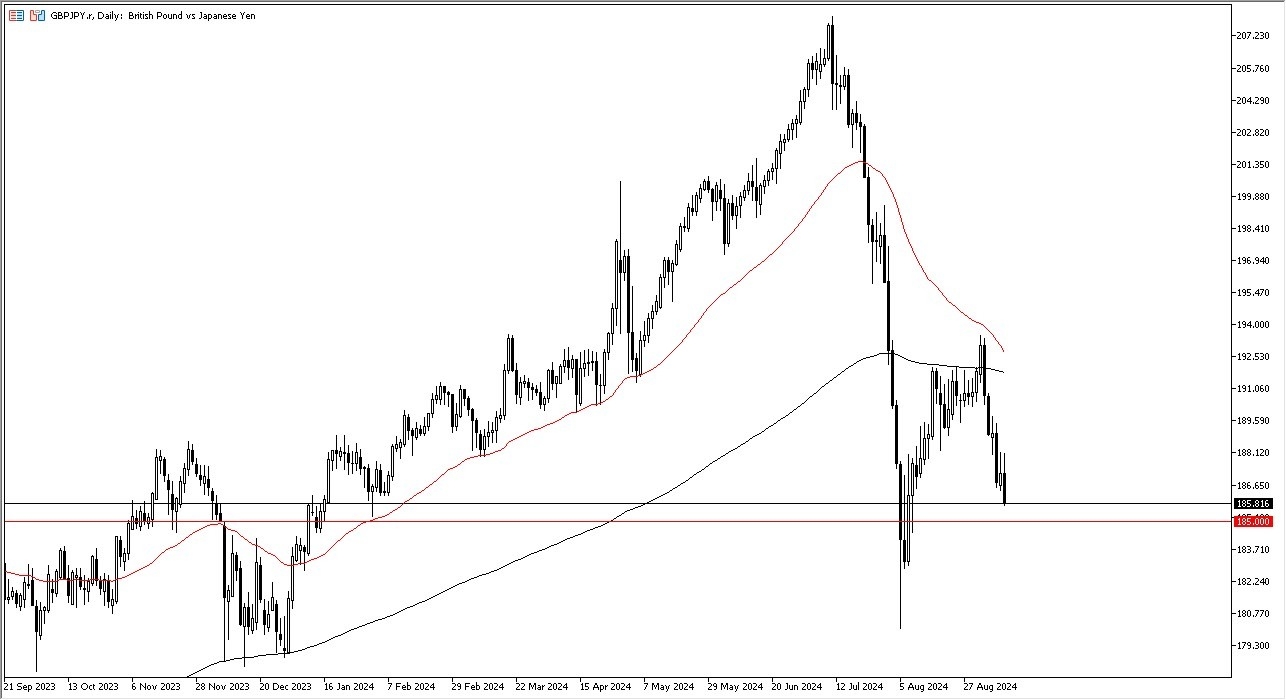
If we turn around and break above the 188.50 level, then I think we could go higher, perhaps reaching the 200 day EMA. Anything below the 185 yen level really starts to get a bit scary, perhaps reaching down to the 182 level. In general, this is a market that I think is going to continue to be very volatile, and that doesn’t do well for the carry trade because people don’t want to hold that type of risk.
In general, though, this is a situation where we need to just simply wait to see whether or not we get enough stability or if we continue to shake weak hands out. I don’t like shorting this pair right now. I think we’ve fallen too far, but it’s difficult to buy as well. I think if we can break above the highs of both Monday and Tuesday, then you can make an argument for going higher. But right now, it’s all about trying to find the floor and that’s generally a messy set of circumstances. Ultimately, I do think that it sooner or later we will get some type of clarity, but right now it’s very difficult to make that decision, due to the fact that the markets continued to see so many different freak outs on an almost daily basis.
Ready to trade our daily Forex forecast? Here’s some of the best forex broker UK reviews to check out
Following Tuesday’s indecisive action, GBP/USD struggles to make a decisive move in either direction and trades in a tight channel slightly below 1.3100. August inflation data from the US could trigger the next big action in the pair.
The table below shows the percentage change of British Pound (GBP) against listed major currencies this week. British Pound was the weakest against the Japanese Yen.
| USD | EUR | GBP | JPY | CAD | AUD | NZD | CHF | |
|---|---|---|---|---|---|---|---|---|
| USD | 0.41% | 0.36% | -0.47% | 0.16% | 0.17% | 0.54% | 0.18% | |
| EUR | -0.41% | -0.10% | -0.83% | -0.25% | -0.29% | 0.15% | -0.25% | |
| GBP | -0.36% | 0.10% | -0.85% | -0.14% | -0.18% | 0.23% | -0.15% | |
| JPY | 0.47% | 0.83% | 0.85% | 0.62% | 0.65% | 1.00% | 0.84% | |
| CAD | -0.16% | 0.25% | 0.14% | -0.62% | 0.05% | 0.37% | 0.18% | |
| AUD | -0.17% | 0.29% | 0.18% | -0.65% | -0.05% | 0.41% | 0.00% | |
| NZD | -0.54% | -0.15% | -0.23% | -1.00% | -0.37% | -0.41% | -0.37% | |
| CHF | -0.18% | 0.25% | 0.15% | -0.84% | -0.18% | -0.01% | 0.37% |
The heat map shows percentage changes of major currencies against each other. The base currency is picked from the left column, while the quote currency is picked from the top row. For example, if you pick the British Pound from the left column and move along the horizontal line to the US Dollar, the percentage change displayed in the box will represent GBP (base)/USD (quote).
Although the US Dollar (USD) stays under bearish pressure in the European session on Wednesday, GBP/USD finds it difficult to gain traction, with the latest data releases from the UK disappointing market participants.
The UK’s Office for National Statistics reported early Wednesday that Industrial Production and Manufacturing Production declined by 0.8% and 1%, respectively, on a monthly basis in July. Both of these prints fell short of analysts’ estimates. Other data from the UK showed that the monthly Gross Domestic Product (GDP) was unchanged in July.
In the second half of the day, the US Bureau of Labor Statistics will publish the Consumer Price Index (CPI) data for August. Investors are likely to react to a surprise in the monthly core CPI reading, which is not distorted by base effects and excludes volatile food and energy prices.
Markets expect an increase of 0.2% in the monthly core CPI in August. A stronger-than-forecast reading could provide a boost to the USD and pave the way for another leg lower in GBP/USD. On the flip side, investors could reassess the probability of a 50 basis points (bps) Federal Reserve rate cut in September, which currently stands at 35% according to the CME FedWatch Tool, on a soft print and cause the USD to come under renewed selling pressure.
GBP/USD stays below the 20-period, 50-period and 100-period Simple Moving Averages (SMA) on the 4-hour chart, while the Relative Strength Index (RSI) indicator stays near 40, suggesting that the bearish bias remains intact.
GBP/USD could meet first support at 1.3040 (Fibonacci 38.2% retracement level of the latest uptrend) before 1.3000 (psychological level, static level) and 1.2970 (Fibonacci 50% retracement, 200-period SMA).
On the upside, interim resistance is located at 1.3100 (static level) ahead of 1.3130 (50-period SMA, 100-period SMA) and 1.3200 (psychological level, static level).
The Pound Sterling (GBP) is the oldest currency in the world (886 AD) and the official currency of the United Kingdom. It is the fourth most traded unit for foreign exchange (FX) in the world, accounting for 12% of all transactions, averaging $630 billion a day, according to 2022 data. Its key trading pairs are GBP/USD, aka ‘Cable’, which accounts for 11% of FX, GBP/JPY, or the ‘Dragon’ as it is known by traders (3%), and EUR/GBP (2%). The Pound Sterling is issued by the Bank of England (BoE).
The single most important factor influencing the value of the Pound Sterling is monetary policy decided by the Bank of England. The BoE bases its decisions on whether it has achieved its primary goal of “price stability” – a steady inflation rate of around 2%. Its primary tool for achieving this is the adjustment of interest rates. When inflation is too high, the BoE will try to rein it in by raising interest rates, making it more expensive for people and businesses to access credit. This is generally positive for GBP, as higher interest rates make the UK a more attractive place for global investors to park their money. When inflation falls too low it is a sign economic growth is slowing. In this scenario, the BoE will consider lowering interest rates to cheapen credit so businesses will borrow more to invest in growth-generating projects.
Data releases gauge the health of the economy and can impact the value of the Pound Sterling. Indicators such as GDP, Manufacturing and Services PMIs, and employment can all influence the direction of the GBP. A strong economy is good for Sterling. Not only does it attract more foreign investment but it may encourage the BoE to put up interest rates, which will directly strengthen GBP. Otherwise, if economic data is weak, the Pound Sterling is likely to fall.
Another significant data release for the Pound Sterling is the Trade Balance. This indicator measures the difference between what a country earns from its exports and what it spends on imports over a given period. If a country produces highly sought-after exports, its currency will benefit purely from the extra demand created from foreign buyers seeking to purchase these goods. Therefore, a positive net Trade Balance strengthens a currency and vice versa for a negative balance.
Silver (XAG/USD) trades with a mild positive bias for the third straight day on Wednesday, albeit lacks bullish conviction and is currently placed around the $28.45 region, just below the weekly high touched during the Asian session.
From a technical perspective, the white metal is holding above the 23.6% Fibonacci retracement level of the August-September slide and looking to build on the momentum beyond the 200-period Simple Moving Average (SMA) on the 4-hour chart. Given that oscillators on the said chart have just started gaining positive traction, though are yet to confirm a bullish bias on the daily chart. Hence, the XAG/USD is more likely to confront stiff resistance near the $28.95-$29.00 confluence – comprising the 50% Fibo. level and the 100-period SMA on the 4-hour chart.
A sustained strength beyond, however, will be seen as a fresh trigger for bullish traders and pave the way for some meaningful appreciating move. The subsequent move up has the potential to lift the XAG/USD beyond the 61.8% Fibo. level resistance near the $29.25 region, towards the $29.65 area, or the 78.6% Fibo. level. The momentum could extend further towards reclaiming the $30.00 psychological mark, above which bulls might aim to challenge the August monthly swing high, around the $30.20 zone.
On the flip side, the $28.25 region, or the 23.6% Fibo. level is likely to protect the immediate downside ahead of the $28.00 mark. A convincing break below could make the XAG/USD vulnerable to weaken further below the $27.70-$27.65 zone, towards the next relevant support near the $27.20 region en route to the $27.00 mark. Some follow-through selling might then expose the August monthly swing low, around the $26.40-$26.35 area, before the white metal eventually drops to the $26.00 round figure.
Silver is a precious metal highly traded among investors. It has been historically used as a store of value and a medium of exchange. Although less popular than Gold, traders may turn to Silver to diversify their investment portfolio, for its intrinsic value or as a potential hedge during high-inflation periods. Investors can buy physical Silver, in coins or in bars, or trade it through vehicles such as Exchange Traded Funds, which track its price on international markets.
Silver prices can move due to a wide range of factors. Geopolitical instability or fears of a deep recession can make Silver price escalate due to its safe-haven status, although to a lesser extent than Gold’s. As a yieldless asset, Silver tends to rise with lower interest rates. Its moves also depend on how the US Dollar (USD) behaves as the asset is priced in dollars (XAG/USD). A strong Dollar tends to keep the price of Silver at bay, whereas a weaker Dollar is likely to propel prices up. Other factors such as investment demand, mining supply – Silver is much more abundant than Gold – and recycling rates can also affect prices.
Silver is widely used in industry, particularly in sectors such as electronics or solar energy, as it has one of the highest electric conductivity of all metals – more than Copper and Gold. A surge in demand can increase prices, while a decline tends to lower them. Dynamics in the US, Chinese and Indian economies can also contribute to price swings: for the US and particularly China, their big industrial sectors use Silver in various processes; in India, consumers’ demand for the precious metal for jewellery also plays a key role in setting prices.
Silver prices tend to follow Gold’s moves. When Gold prices rise, Silver typically follows suit, as their status as safe-haven assets is similar. The Gold/Silver ratio, which shows the number of ounces of Silver needed to equal the value of one ounce of Gold, may help to determine the relative valuation between both metals. Some investors may consider a high ratio as an indicator that Silver is undervalued, or Gold is overvalued. On the contrary, a low ratio might suggest that Gold is undervalued relative to Silver.
Gold price is consolidating a two-day uptrend above $2,500 in Wednesday’s Asian trading. Gold buyers take a breather, with the next directional move likely triggered by the critical US Consumer Price Index (CPI) data due later this Wednesday.
Gold traders have tuned on the sidelines, refraining from placing fresh bets before the US inflation test, which could confirm the size of the US Federal Reserve (Fed) interest rate cut next week. The data is critical to determining the next direction in Gold price, as it hangs close to the record high of $2,532 set on August 20.
US CPI is seen rising 2.6% YoY in August after recording a 2.9% increase in July. The core CPI inflation is expected to hold steady at 3.2% YoY in the same period. Meanwhile, the monthly headline and core CPIs are set to rise 0.2%, at the same pace as seen previously.
An upside surprise to the annual and monthly inflation readings could trigger a fresh US Dollar recovery at the expense of the Gold price, washing out expectations of an outsized Fed rate cut. Conversely, a softer-than-expected headline and core annual CPI data could revive 50 basis points (bps) Fed rate reduction bets, slamming the US Dollar (USD) while propelling Gold price to fresh lifetime highs.
Markets are currently pricing in a 33% chance of a 50 bps rate cut move while the odds of a 25 bps rate cut stand at 67%, the CME Group’s FedWatch Tool shows.
In the lead-up to the US CPI showdown, Gold price stays supported by renewed selling in the US Dollar, courtesy of the steep USD/JPY sell-off. The Japanese Yen spiked to fresh eight-month highs against the USD near 141.50 after the hawkish remarks from Bank of Japan (BoJ) board member Junko Nagakawa. The policymaker signaled the bank’s readiness to hike rates further, highlighting the policy divergence between the Fed and the BoJ.
Meanwhile, the first US Presidential debate between former President Donald Trump and Democratic nominee Kamala Harris in Pennsylvania failed to have any significant impact on the financial markets, as investors traded with caution and scurried to the safety of the US government bonds. This weighed negatively on the US Treasury bond yields, allowing Gold price to stay on the front foot.
Nothing seems to have changed for Gold price from a short-term technical perspective. Buyers continue to stay hopeful as Gold price managed to close above the 21-day Simple Moving Average (SMA), now at $2,503, for the second day in a row on Tuesday.
The 14-day Relative Strength Index (RSI) points higher once again while well above the 50 level, justifying the bullish potential.
Gold buyers now aim for a sustained breakthrough the record high of $2,532, above which the $2,550 psychological level will come into play.
If Gold price faces rejection once again near the $2,530 supply zone, a correction would ensue, with a daily closing below the 21-day SMA at $2,503 needed to negate the bullish outlook in the near term.
A breach of the latter will challenge the previous week’s low of $2,472, followed by the symmetrical triangle resistance-turned-support at $2,462.
Inflationary or deflationary tendencies are measured by periodically summing the prices of a basket of representative goods and services and presenting the data as The Consumer Price Index (CPI). CPI data is compiled on a monthly basis and released by the US Department of Labor Statistics. The YoY reading compares the prices of goods in the reference month to the same month a year earlier.The CPI is a key indicator to measure inflation and changes in purchasing trends. Generally speaking, a high reading is seen as bullish for the US Dollar (USD), while a low reading is seen as bearish.