The main category of Forex News.
You can use the search box below to find what you need.
[wd_asp id=1]
The main category of Forex News.
You can use the search box below to find what you need.
[wd_asp id=1]
The Friday candlestick suggests that we are not quite ready to take off yet, but that makes sense. I would actually prefer to see this market go sideways, mainly due to the fact that it shows more time being spent at this price. Recognizing them, the market accepts this price. If we can recapture the 155 yen level, then I think we could see the market much higher, perhaps racing towards the 50 day EMA, which is at the 157.50 yen level. Breaking above that level then opens up the possibility of a move all the way to the 160 yen level, which I think is very realistic. We do have a major interest rate differential between the US dollar and the Japanese yen. And as a result, I think you’ve got a scenario where you get paid at the end of every session and it does make sense to be involved.

That being said, if we were to turn around and break down below the 152 yen level, then we may have to look at the 150 yen level as potential support. Anything below there could be a significantly negative bias to really have people shorting this pair. But right now, the Bank of Japan is essentially stuck with its ultra-loose monetary policy while the Federal Reserve is still somewhat in the air as to how many cuts they are going to do in the next few months, if any at all.
Ready to trade our daily forex forecast? Here are the best forex brokers in Japan to choose from.
None of these trades set up.
Last week’s key takeaways were:
There were a few other events last week which were of lower significance:
The most important items over this coming week will be:
This month, I forecasted that the USD/JPY currency pair would increase in value. The performance of this forecast to date is as follows:

Last week, I made no weekly forecast, although the NZD/JPY currency cross experienced an unusually large directional price movement. I did not have faith that the price would revert over the week, so I made no weekly forecast.
This was a great call, as the NZD/JPY currency cross fell again.
Last week, all the Japanese Yen crosses (except CHF/JPY) experienced unusually large directional price movement. I, therefore, think next week we are likely to see rebounds in all these crosses, which suggests that next week will see good long trade opportunities and price advances in:
Directional volatility in the Forex market rose last week, with 52% of the most important currency pairs fluctuating by more than 1%.
Last week, the Japanese Yen was the strongest major currency, while the Australian Dollar was the weakest.
You can trade these forecasts in a real or demo Forex brokerage account.

The US Dollar Index printed an indecisive doji candlestick last week, with almost all the price action occurring between the new support level at 103.71 and the older resistance level at 104.15. This is a sign of indecision, as although the latest support is bullish, the fact that the price has been unable to escape to above 104.15 is a sign that this zone of resistance is still holding.
The greenback has no long-term trend: it is above its price of 3 months ago but below its price of 6 months ago, showing mixed trends. This adds to the picture of indecision and choppiness here.
If the US Dollar can establish itself above 104.15 over the coming days, that will be a bullish sign and likely a signal to stop trading the Dollar short. On the other hand, if it establishes itself below 103.71, that will be a bearish sign.
The Dollar will probably come to life later in the week when the Fed’s policy meeting is held, but in the meantime, the Forex action will likely focus on the volatile Japanese Yen.

The EUR/USD currency pair came off a 3-month high price it made two weeks ago and closed lower at the end of last week. However, the bearish retracement has not yet been deep enough to knock long-term trend traders out of this trade.
The price seems to have found support at $1.0833 but has not risen above the resistance level at $1.0870. The past few days have seen the price consolidate weakly between these levels.
The Euro, the Swiss Franc, and the British Pound have held their value relatively well against a very strong Japanese Yen and a firm US Dollar, but there is not much to say about the Euro right now.
The policy meeting of the US Federal Reserve will probably most strongly influence this currency pair this week.
I will enter a long trade if we get a daily close this week above $1.0939. However, the bullish outlook here is quite weak and unconvincing.

I expected the USD/CHF currency pair to have potential resistance at $0.8923.
The H1 price chart below shows how the price doubled inside bars, marked by the down arrow within the price chart below, rejecting this resistance level just before last Tuesday’s London close, signalling the timing of this bearish rejection.
This trade could still be open, but it has been extremely profitable so far, giving a maximum reward-to-risk ratio of approximately 14 to 1.

The AUD/JPY currency cross fell extremely strongly last week to close lower by more than 4%. This is an unusually large price movement that has not been seen for months, possibly even years. It was a very bearish weekly candle, although there was a significantly lower wick, which suggests that the price may have found some support towards the end of the week.
Although the Australian Dollar traded significantly lower last week on declining risk appetite, the Japanese Yen remains the real story. It enjoyed another week of dramatic strengthening but by even more than the previous week’s strong advance. This is driven by anticipation that, at last, economic data is showing inflation sustained firmly above the 2% target, making a rate hike by the Bank of Japan this week extremely likely.
Later this week, the Bank of Japan’s policy meeting injects a major element of uncertainty regarding the Yen. The Bank may hike its interest rate.
Although the price action can be seen as a bearish development, it is worth noting that such strong weekly directional movements in currency crosses tend to bounce back the next week. We already saw the price stop falling, and we may have found support towards the end of last week. Furthermore, almost all the Yen crosses had similar outsized moves.
Therefore, I expect this currency pair’s price to rise over the coming week.

The S&P 500 Index fell again last week, after the previous week when the major stock market index posted a weekly loss for the first time in seven weeks.
The move down was reasonably strong, but nothing out of the ordinary. Most trend traders won’t be long here any longer despite the recent strong bullish run, as the price has retraced by more than three times the long-term daily average true range.
Technology stock indices like the NASDAQ 100 have performed even more bearishly over the past week, suggesting that the stock market has made a rotational shift. Broader market investments now look likely to outperform leading technology stocks. Some major tech companies, such as NVIDIA, have seen massive drops over recent days.
I think the best approach to stocks right now is to stand on the sidelines and wait to see if the bullish trend resumes, whether we see a deeper bearish retracement or just a consolidation.

I see the best trading opportunities this week as follows:
Ready to trade our weekly Forex forecast? We’ve made a list of the best Forex brokers that you should review.
The GBP/USD weekly forecast is trending south as markets shift towards a more dovish outlook for the Bank of England.
The GBP/USD price fell last week as Bank of England rate cut expectations increased. At the same time, the dollar firmed as data showed economic resilience and easing inflation. Investors are fully expecting two rate cuts from the BoE by December. However, the timing remains unclear. Rate cut bets went up as bets for a September Fed cut rose.
–Are you interested in learning more about Forex robots? Check our detailed guide-
Meanwhile, data on business activity from the US and the UK showed further expansion in June. Therefore, both economies are doing well despite high rates. Additional US data revealed bigger-than-expected economic growth in Q2 and a drop in unemployment claims. The week ended with inflation figures coming in as expected at 0.2%.
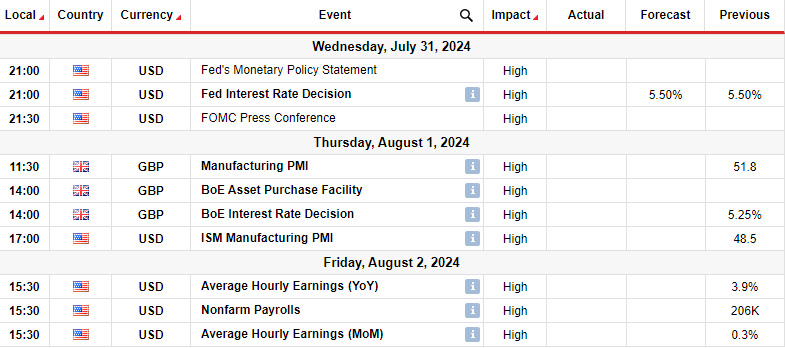
Next week, investors will pay close attention to monetary policy meetings in the US and the UK. The Fed will meet on Wednesday and likely keep interest rates unchanged at 5.50%. Meanwhile, the Bank of England will meet on Thursday, and there is a 50% chance policymakers will vote to lower borrowing costs.
Additionally, markets will focus on the all-important US monthly employment report. The last report showed slower job growth and an increase in the unemployment rate. If this trend continues, policymakers might assume a more dovish tone. At the same time, the dollar would fall, allowing GBP/USD to rally.
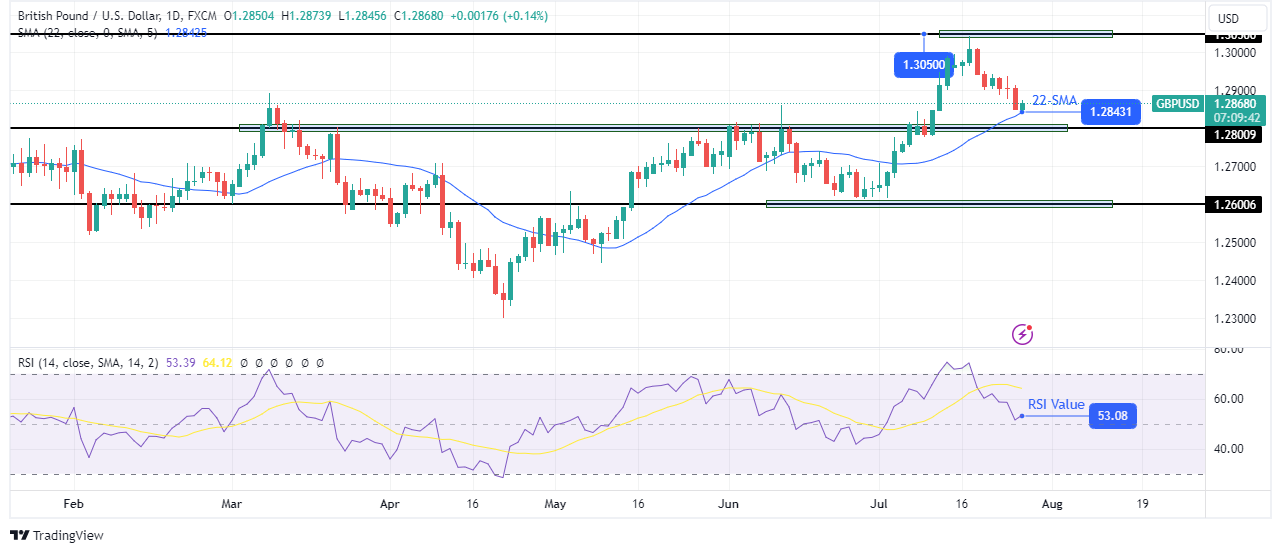
On the technical side, the GBP/USD price has fallen back to the 22-SMA after reaching new highs. However, the bullish bias remains intact, with the price above the SMA and the RSI slightly above 50. The bullish trend continued when the price broke above the 1.2800 key resistance level.
–Are you interested in learning more about XRP price prediction? Check our detailed guide-
Bears prompted a pullback before the price reached the 1.3050 key level. If the bullish trend remains in play, the price will bounce off the 22-SMA to revisit the 1.3050 resistance. However, if bears take over, it might break below the SMA and the 1.2800 support.
Looking to trade forex now? Invest at eToro!
68% of retail investor accounts lose money when trading CFDs with this provider. You should consider whether you can afford to take the high risk of losing your money.
The USD/JPY weekly forecast is bearish, with investors increasingly betting on a Bank of Japan rate hike at next week’s meeting.
The USD/JPY pair had a bearish week, where the yen found its feet against the dollar. The rally in the yen came as investors increased bets on a BoJ rate hike at next week’s policy meeting. The rate hike optimism kept the dollar at bay despite better-than-expected economic data.
–Are you interested in learning more about Forex robots? Check our detailed guide-
Notably, US business activity increased in June as the services sector expanded. Meanwhile, GDP figures for Q2 came in at 2.8%, well above the 2.0% forecast. Additionally, unemployment claims in the US fell last week, indicating a still robust labor market. Finally, the core PCE index came in line with expectations, rising by 0.2% m/m.
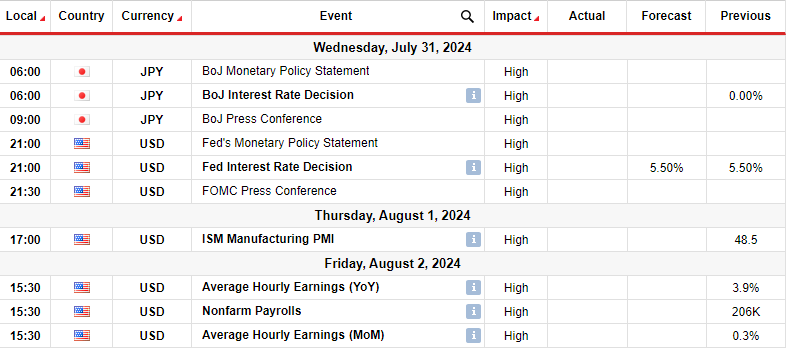
Next week, USD/JPY will experience a lot of volatility with the Bank of Japan and Fed policy meetings. At the same time, the US will release key manufacturing and employment data. Notably, there is a 67.2% chance that the BoJ will hike rates by 10bps next week. If this happens, the yen might strengthen, pushing USD/JPY lower.
Meanwhile, the Fed will likely keep rates unchanged. However, given the recent decline in inflation, policymakers might take a more dovish stance.
Elsewhere, the US nonfarm employment report will continue shaping the outlook for Fed rate cuts. Easing in the labor market will give policymakers more confidence to cut in September.
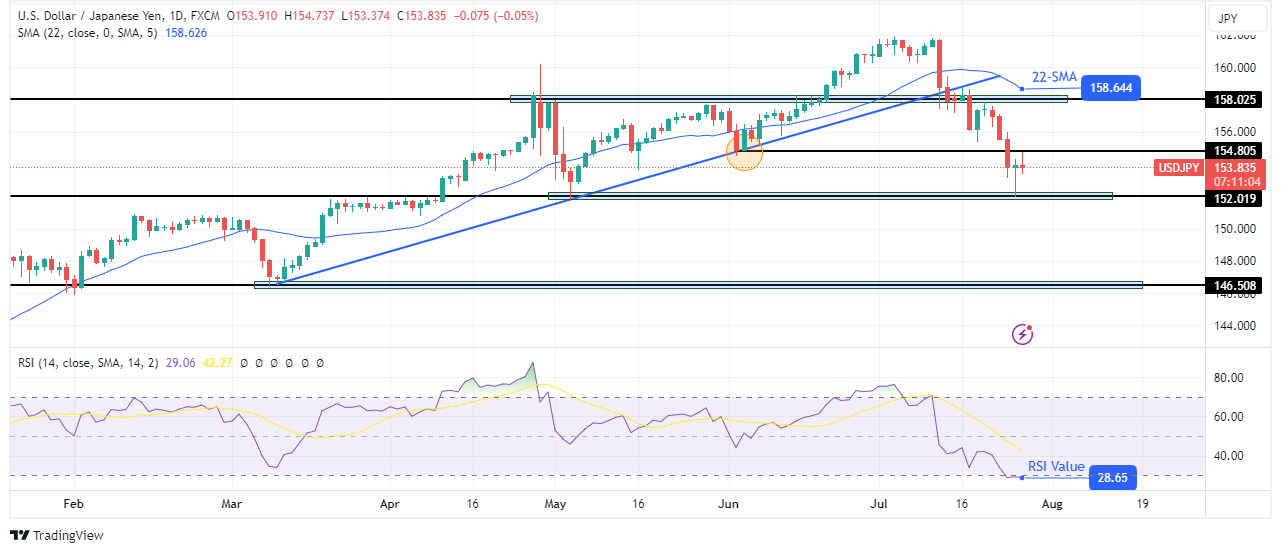
On the technical side, the USD/JPY price has broken below its bullish trendline and is approaching the 152.01 support level. Moreover, the RSI has crossed below 50, indicating a bearish sentiment shift.
–Are you interested in learning more about XRP price prediction? Check our detailed guide-
The price was in an uptrend with higher highs and lows for a long time. However, this changed when the price broke below the previous low to make a lower low. There is a high chance it will also make a lower high next week. A downtrend would allow bears to retest the 152.01 and 146.50 support levels.
Looking to trade forex now? Invest at eToro!
68% of retail investor accounts lose money when trading CFDs with this provider. You should consider whether you can afford to take the high risk of losing your money.
Poor harvests, soaring raw material costs and a security crisis affecting shipping through the Suez Canal are among the factors that have driven prices this summer.
On Tuesday, robusta beans hit an all-time high of $4,667 a metric ton on the London-based ICE Futures Europe market.
Giuseppe Lavazza said that trend was likely to continue throughout the year, driving prices of on-the-shelf coffee up by as much as 10 per this year.
Speaking at Wimbledon, which like Royal Ascot, left, is sponsored by the Italian family-run company, Lavazza set out the challenges facing the industry.
“The coffee supply chain has been dramatically under pressure for the past three years because of the price of raw materials,” he said.
He predicted this would drive the price of coffee for UK consumers between 20% and 25% higher between the start of 2023 and the end of 2024.
“People are going to have accept that the price of coffee is going to get more expensive in the short-term,” he said.
Among the “very strong headwinds” is the crisis in the Red Sea, where attacks by Iranian-backed Houthis on cargo ships have caused shipments of coffee from the Far East and East Africa to avoid the Suez Canal and instead circumnavigate Africa, massive increasing costs and causing buyers to wait an extra four weeks for supplies to reach their warehouses.
“It’s impossible for ships to go through (the Suez Canal) Ships have to circumnavigate Africa and to enter into Europe from the northern ports instead of the Mediterranean ports.
“It means the cost of shipping has risen a lot. During the pandemic the cost of shipping rose ten times average, and now we have increasing cost four times the average because of this long route.”
Mr Lavazza said the rise in the global price of coffee was unlike anything ever seen in history of the industry – and isn’t going to change in the foreseeable future.
Forecasts for harvest in Vietnam — the world’s second-biggest coffee producer behind Brazil — are “not very solid”, causing a multi-million bag shortage of supply which he said was fuelling commodity market speculation, pushing prices up even higher.
“The market will stay volatile, very unpredictable,” he said.

A major concern for Lavazza is the European Union Deforestation Regulation (EUDR), due to come into force in 2025.
The regulation aims to slash global deforestation linked to the consumption of coffee and other commodities including beef, palm oil and rubber.
It requires complete traceability for every coffee bean entering the bloc, with hefty fines for companies breaching the rules.
Mr Lavazza said he supported the law’s intention to protect the environment but warned it could have a devastating effect on the industry unless changes are made.
“Tracking all the coffee supply chain is very difficult. For many countries it’s absolutely impossible because they don’t have any infrastructure to do that.
“You need to plot your farm using geo satellite coordinates and enter all the data on a digital platform. This maybe could be done for farmers in Europe — but not in many producing countries.
“The problem is the system they’ve decided to adopt is imply not applicable to many farmers around the world.”
Calling for a delay to the implementation, Mr Lavazza said only Brazil was ready to comply with the regulations, making it “too risky” for buyers to purchase coffee beans from elsewhere.
“It’s one of the most dangerous things we have to cope with.”
Despite these industry-wide pressures, Mr Lavazza said the company, which was founded by Luigi Lavazza in Turin 129 years ago, was “still growing”.
“In 2010, the company had a turnover of about 1billion euros. In 2023 we reach 3billion euros.”
Sales across its markets continue to “pretty good” with UK revenues reaching £117 million in 2023 – 10% up on the previous year.
The Australian dollar has fallen rather significantly during the course of the week to break down below the 0.6650 level, an area that has been both support and resistance at multiple times. However, when you look at the overall market, it’s easy to see that we’re in basically a two and a half year consolidation range. This is very similar to how the euro is behaving. In this case, we have the 0.6850 level above offering resistance with the 200 week EMA sitting there. Underneath we have the 0.6450 level offering support, followed by the 0.63 level, which I think is a pretty hard floor.
A lot of noise is found in this pair, but quite frankly, if you wait for it to get a little extreme in one direction or the other, over the last couple of years, it has shown its proclivity to jump right back to about where we are now. With that being said, despite the fact that the candlestick is rather negative, I am rather neutral, at least from a longer term standpoint.
If we can drop a bit from here and then see a bit of a bounce, I might be a buyer. But quite frankly, unless you are a longer term rangebound trader, the Aussie dollar probably doesn’t offer a whole lot as we are just showing a lot of choppy behavior time and time again. Because of this, I think you have to look at this market as one that is sideways overall, and therefore you will have to look at short term charts for guidance.
For a look at all of today’s economic events, check out our economic calendar.
This article was originally posted on FX Empire
You have reached your limit of 5 free articles for this month.
Access all our articles, insights, and analysts.
Your coupon code
After recovering to 1.0870 early Thursday, EUR/USD lost its momentum and closed the day virtually unchanged slightly below 1.0850 as the US Dollar (USD) benefited from upbeat data releases. Although the risk mood seems to be improving early Friday, the Euro is having a difficult time attracting buyers.
The table below shows the percentage change of Euro (EUR) against listed major currencies this week. Euro was the weakest against the Japanese Yen.
| USD | EUR | GBP | JPY | CAD | AUD | NZD | CHF | |
|---|---|---|---|---|---|---|---|---|
| USD | 0.28% | 0.34% | -2.14% | 0.67% | 1.94% | 2.01% | -0.53% | |
| EUR | -0.28% | 0.04% | -2.46% | 0.37% | 1.70% | 1.66% | -0.87% | |
| GBP | -0.34% | -0.04% | -2.60% | 0.29% | 1.65% | 1.60% | -0.93% | |
| JPY | 2.14% | 2.46% | 2.60% | 2.92% | 4.25% | 4.21% | 1.60% | |
| CAD | -0.67% | -0.37% | -0.29% | -2.92% | 1.35% | 1.32% | -1.20% | |
| AUD | -1.94% | -1.70% | -1.65% | -4.25% | -1.35% | -0.03% | -2.54% | |
| NZD | -2.01% | -1.66% | -1.60% | -4.21% | -1.32% | 0.03% | -2.46% | |
| CHF | 0.53% | 0.87% | 0.93% | -1.60% | 1.20% | 2.54% | 2.46% |
The heat map shows percentage changes of major currencies against each other. The base currency is picked from the left column, while the quote currency is picked from the top row. For example, if you pick the Euro from the left column and move along the horizontal line to the US Dollar, the percentage change displayed in the box will represent EUR (base)/USD (quote).
The US Bureau of Economic Analysis (BEA) reported on Thursday the United States’ Gross Domestic Product (GDP) expanded at an annual rate of 2.8% in the second quarter, according to its first estimate. This print followed the 1.4% growth recorded in the first quarter and surpassed the market forecast of 2% by a wide margin.
The stronger-than-expected GDP reading and the mixed action seen in Wall Street helped the USD stay resilient against its major rivals during the American trading hours, limiting EUR/USD’s upside.
Later in the day, the BEA will release the Personal Consumption Expenditures (PCE) Price Index data for June. The GDP report showed that the core Personal Consumption Expenditures Price Index rose 2.9% on a quarterly basis, below the 3.7% increase registered in the first quarter but above analysts’ estimate of 2.7%. Since the quarterly PCE inflation data takes June’s PCE Price Index into account, the market reaction to the monthly reading is likely to remain muted.
Nevertheless, changes in risk perception ahead of the weekend could drive EUR/USD’s action. In the European session, US stock index futures trade marginally higher on the day. In case risk flows take control of markets following a bullish opening in Wall Street, the USD could struggle to gather strength and allow EUR/USD to hold its ground.
EUR/USD failed to reclaim the 100-period Simple Moving Average (SMA) for the second straight day on Thursday and the Relative Strength Index (RSI) indicator on the 4-hour chart edged lower after touching 50, reflecting a lack of buyer interest.
On the downside, the 100-day and the 200-day SMAs form strong support area at 1.0800-1.0790 ahead of 1.0740 (Fibonacci 78.6% retracement of the latest uptrend) and 1.0700 (psychological level, static level). Resistances could be seen at 1.0860 (100-period SMA),1.0880 (Fibonacci 23.6% retracement) and 1.0900 (psychological level, static level).
The Euro is the currency for the 20 European Union countries that belong to the Eurozone. It is the second most heavily traded currency in the world behind the US Dollar. In 2022, it accounted for 31% of all foreign exchange transactions, with an average daily turnover of over $2.2 trillion a day. EUR/USD is the most heavily traded currency pair in the world, accounting for an estimated 30% off all transactions, followed by EUR/JPY (4%), EUR/GBP (3%) and EUR/AUD (2%).
The European Central Bank (ECB) in Frankfurt, Germany, is the reserve bank for the Eurozone. The ECB sets interest rates and manages monetary policy. The ECB’s primary mandate is to maintain price stability, which means either controlling inflation or stimulating growth. Its primary tool is the raising or lowering of interest rates. Relatively high interest rates – or the expectation of higher rates – will usually benefit the Euro and vice versa. The ECB Governing Council makes monetary policy decisions at meetings held eight times a year. Decisions are made by heads of the Eurozone national banks and six permanent members, including the President of the ECB, Christine Lagarde.
Eurozone inflation data, measured by the Harmonized Index of Consumer Prices (HICP), is an important econometric for the Euro. If inflation rises more than expected, especially if above the ECB’s 2% target, it obliges the ECB to raise interest rates to bring it back under control. Relatively high interest rates compared to its counterparts will usually benefit the Euro, as it makes the region more attractive as a place for global investors to park their money.
Data releases gauge the health of the economy and can impact on the Euro. Indicators such as GDP, Manufacturing and Services PMIs, employment, and consumer sentiment surveys can all influence the direction of the single currency. A strong economy is good for the Euro. Not only does it attract more foreign investment but it may encourage the ECB to put up interest rates, which will directly strengthen the Euro. Otherwise, if economic data is weak, the Euro is likely to fall. Economic data for the four largest economies in the euro area (Germany, France, Italy and Spain) are especially significant, as they account for 75% of the Eurozone’s economy.
Another significant data release for the Euro is the Trade Balance. This indicator measures the difference between what a country earns from its exports and what it spends on imports over a given period. If a country produces highly sought after exports then its currency will gain in value purely from the extra demand created from foreign buyers seeking to purchase these goods. Therefore, a positive net Trade Balance strengthens a currency and vice versa for a negative balance.
After recovering to 1.0870 early Thursday, EUR/USD lost its momentum and closed the day virtually unchanged slightly below 1.0850 as the US Dollar (USD) benefited from upbeat data releases. Although the risk mood seems to be improving early Friday, the Euro is having a difficult time attracting buyers.
The table below shows the percentage change of Euro (EUR) against listed major currencies this week. Euro was the weakest against the Japanese Yen.
| USD | EUR | GBP | JPY | CAD | AUD | NZD | CHF | |
|---|---|---|---|---|---|---|---|---|
| USD | 0.28% | 0.34% | -2.14% | 0.67% | 1.94% | 2.01% | -0.53% | |
| EUR | -0.28% | 0.04% | -2.46% | 0.37% | 1.70% | 1.66% | -0.87% | |
| GBP | -0.34% | -0.04% | -2.60% | 0.29% | 1.65% | 1.60% | -0.93% | |
| JPY | 2.14% | 2.46% | 2.60% | 2.92% | 4.25% | 4.21% | 1.60% | |
| CAD | -0.67% | -0.37% | -0.29% | -2.92% | 1.35% | 1.32% | -1.20% | |
| AUD | -1.94% | -1.70% | -1.65% | -4.25% | -1.35% | -0.03% | -2.54% | |
| NZD | -2.01% | -1.66% | -1.60% | -4.21% | -1.32% | 0.03% | -2.46% | |
| CHF | 0.53% | 0.87% | 0.93% | -1.60% | 1.20% | 2.54% | 2.46% |
The heat map shows percentage changes of major currencies against each other. The base currency is picked from the left column, while the quote currency is picked from the top row. For example, if you pick the Euro from the left column and move along the horizontal line to the US Dollar, the percentage change displayed in the box will represent EUR (base)/USD (quote).
The US Bureau of Economic Analysis (BEA) reported on Thursday the United States’ Gross Domestic Product (GDP) expanded at an annual rate of 2.8% in the second quarter, according to its first estimate. This print followed the 1.4% growth recorded in the first quarter and surpassed the market forecast of 2% by a wide margin.
The stronger-than-expected GDP reading and the mixed action seen in Wall Street helped the USD stay resilient against its major rivals during the American trading hours, limiting EUR/USD’s upside.
Later in the day, the BEA will release the Personal Consumption Expenditures (PCE) Price Index data for June. The GDP report showed that the core Personal Consumption Expenditures Price Index rose 2.9% on a quarterly basis, below the 3.7% increase registered in the first quarter but above analysts’ estimate of 2.7%. Since the quarterly PCE inflation data takes June’s PCE Price Index into account, the market reaction to the monthly reading is likely to remain muted.
Nevertheless, changes in risk perception ahead of the weekend could drive EUR/USD’s action. In the European session, US stock index futures trade marginally higher on the day. In case risk flows take control of markets following a bullish opening in Wall Street, the USD could struggle to gather strength and allow EUR/USD to hold its ground.
EUR/USD failed to reclaim the 100-period Simple Moving Average (SMA) for the second straight day on Thursday and the Relative Strength Index (RSI) indicator on the 4-hour chart edged lower after touching 50, reflecting a lack of buyer interest.
On the downside, the 100-day and the 200-day SMAs form strong support area at 1.0800-1.0790 ahead of 1.0740 (Fibonacci 78.6% retracement of the latest uptrend) and 1.0700 (psychological level, static level). Resistances could be seen at 1.0860 (100-period SMA),1.0880 (Fibonacci 23.6% retracement) and 1.0900 (psychological level, static level).
The Euro is the currency for the 20 European Union countries that belong to the Eurozone. It is the second most heavily traded currency in the world behind the US Dollar. In 2022, it accounted for 31% of all foreign exchange transactions, with an average daily turnover of over $2.2 trillion a day. EUR/USD is the most heavily traded currency pair in the world, accounting for an estimated 30% off all transactions, followed by EUR/JPY (4%), EUR/GBP (3%) and EUR/AUD (2%).
The European Central Bank (ECB) in Frankfurt, Germany, is the reserve bank for the Eurozone. The ECB sets interest rates and manages monetary policy. The ECB’s primary mandate is to maintain price stability, which means either controlling inflation or stimulating growth. Its primary tool is the raising or lowering of interest rates. Relatively high interest rates – or the expectation of higher rates – will usually benefit the Euro and vice versa. The ECB Governing Council makes monetary policy decisions at meetings held eight times a year. Decisions are made by heads of the Eurozone national banks and six permanent members, including the President of the ECB, Christine Lagarde.
Eurozone inflation data, measured by the Harmonized Index of Consumer Prices (HICP), is an important econometric for the Euro. If inflation rises more than expected, especially if above the ECB’s 2% target, it obliges the ECB to raise interest rates to bring it back under control. Relatively high interest rates compared to its counterparts will usually benefit the Euro, as it makes the region more attractive as a place for global investors to park their money.
Data releases gauge the health of the economy and can impact on the Euro. Indicators such as GDP, Manufacturing and Services PMIs, employment, and consumer sentiment surveys can all influence the direction of the single currency. A strong economy is good for the Euro. Not only does it attract more foreign investment but it may encourage the ECB to put up interest rates, which will directly strengthen the Euro. Otherwise, if economic data is weak, the Euro is likely to fall. Economic data for the four largest economies in the euro area (Germany, France, Italy and Spain) are especially significant, as they account for 75% of the Eurozone’s economy.
Another significant data release for the Euro is the Trade Balance. This indicator measures the difference between what a country earns from its exports and what it spends on imports over a given period. If a country produces highly sought after exports then its currency will gain in value purely from the extra demand created from foreign buyers seeking to purchase these goods. Therefore, a positive net Trade Balance strengthens a currency and vice versa for a negative balance.
A decisive break down below 2.00 will indicate a likely continuation of the bearish trend. Natural gas would then be heading towards the next lower support zone that is anchored around the 78.6% Fibonacci retracement at 1.92. The 1.94 price area can also be watched as it was resistance previously at the minor swing high on April 10 and may show support now. Notice that there is an unfilled gap that will be filled at 1.94.
Be aware that support from the month of May was seen at 1.91, a three-month low. If the current bearish retracement does not find support above 1.91, a monthly bearish continuation signal would be triggered on a drop below 1.91. If that happens then the next lower support zone from around 1.85 to 1.80 could be next on the agenda.
The decline today triggered a bearish weekly continuation as last week’s low of 2.015 was exceeded to the downside. Since the current week ends today natural gas is on track to close weak, near the lows of this week’s trading range. This is bearish behavior that increases the chance for a test of lower support levels.
If it ends the week below last week’s low a clearer bearish indication will be given. Regardless, this will be the sixth week in a row of lower weekly highs and lower weekly lows therefore signaling a bearish continuation of the decline.
There remains a chance that the 2.00 support zone will hold and see demand increase. That scenario would be indicated on a rally above today’s high of 2.08. The 20-Day MA at 2.26 along with this week’s high of 2.27 would be the initial upside pivots.
I’m not necessarily going to be in the mood to try to gamble here. I think that what we need to see is a little bit of stability and then a bounce. I thought we had that a couple of days ago, but we don’t have that yet. The 152 yen level is an area that not only features the 200-day EMA, but it’s also the previous resistance barrier, so I think with that being the case, it does make sense that market memory lifts the dollar there.
Furthermore, it’ll be interesting to see how traders approach the yen and the interest rate differential. But at this point, you would have to assume that interest rates are probably going to shrink a little bit, at least in the futures markets. So that’ll be interesting. All things being equal, this is a market that is still in an uptrend, but man, are we getting hammered. And I think this is something that you need to pay close attention to because this could be a sea change, but we are not there yet. That being said, USD/JPY is a pair that I have no issues holding, but I think there will be better opportunities in this pair to get involved at a better price. Remember, you are looking for the USD to be “on sale” and supported.
Ready to trade our daily forex forecast? Here are the best forex brokers in Japan to choose from.
The US dollar initially pulled back just a bit against the Japanese yen on Friday, but then turned around the show signs of life. By doing so, I think the market is likely to continue to see the 155 yen level as a gateway to bigger moves. If we can break above there, then I think the US dollar not only rallies, but I think it rallies somewhat hard without the wait and see. The sell-off in this pair has been overdone, and it is worth noting that we bounced directly from the 200-day EMA, which of course is an indicator that a lot of people will be paying close attention to.
With this, I am bullish. I also continue to pound home the idea you get paid to hold this pair. That doesn’t necessarily mean you have to go in with a huge position. Over time, it will add up as well. Now that we’ve had this pullback, you’ll have to take a look at a few possibilities, but right now, if you do a Fibonacci study, it’s worth noting that the 50%, almost the 50% Fibonacci retracement level was tested at the 200 day EMA, and now it looks like we are ready to continue to the upside. And with that being the case, I do like this pair, and I like it even more if we can get above the 155 yen level as it would show a continuation of momentum and the overall uptrend that we have seen for some time.